
Key Insights
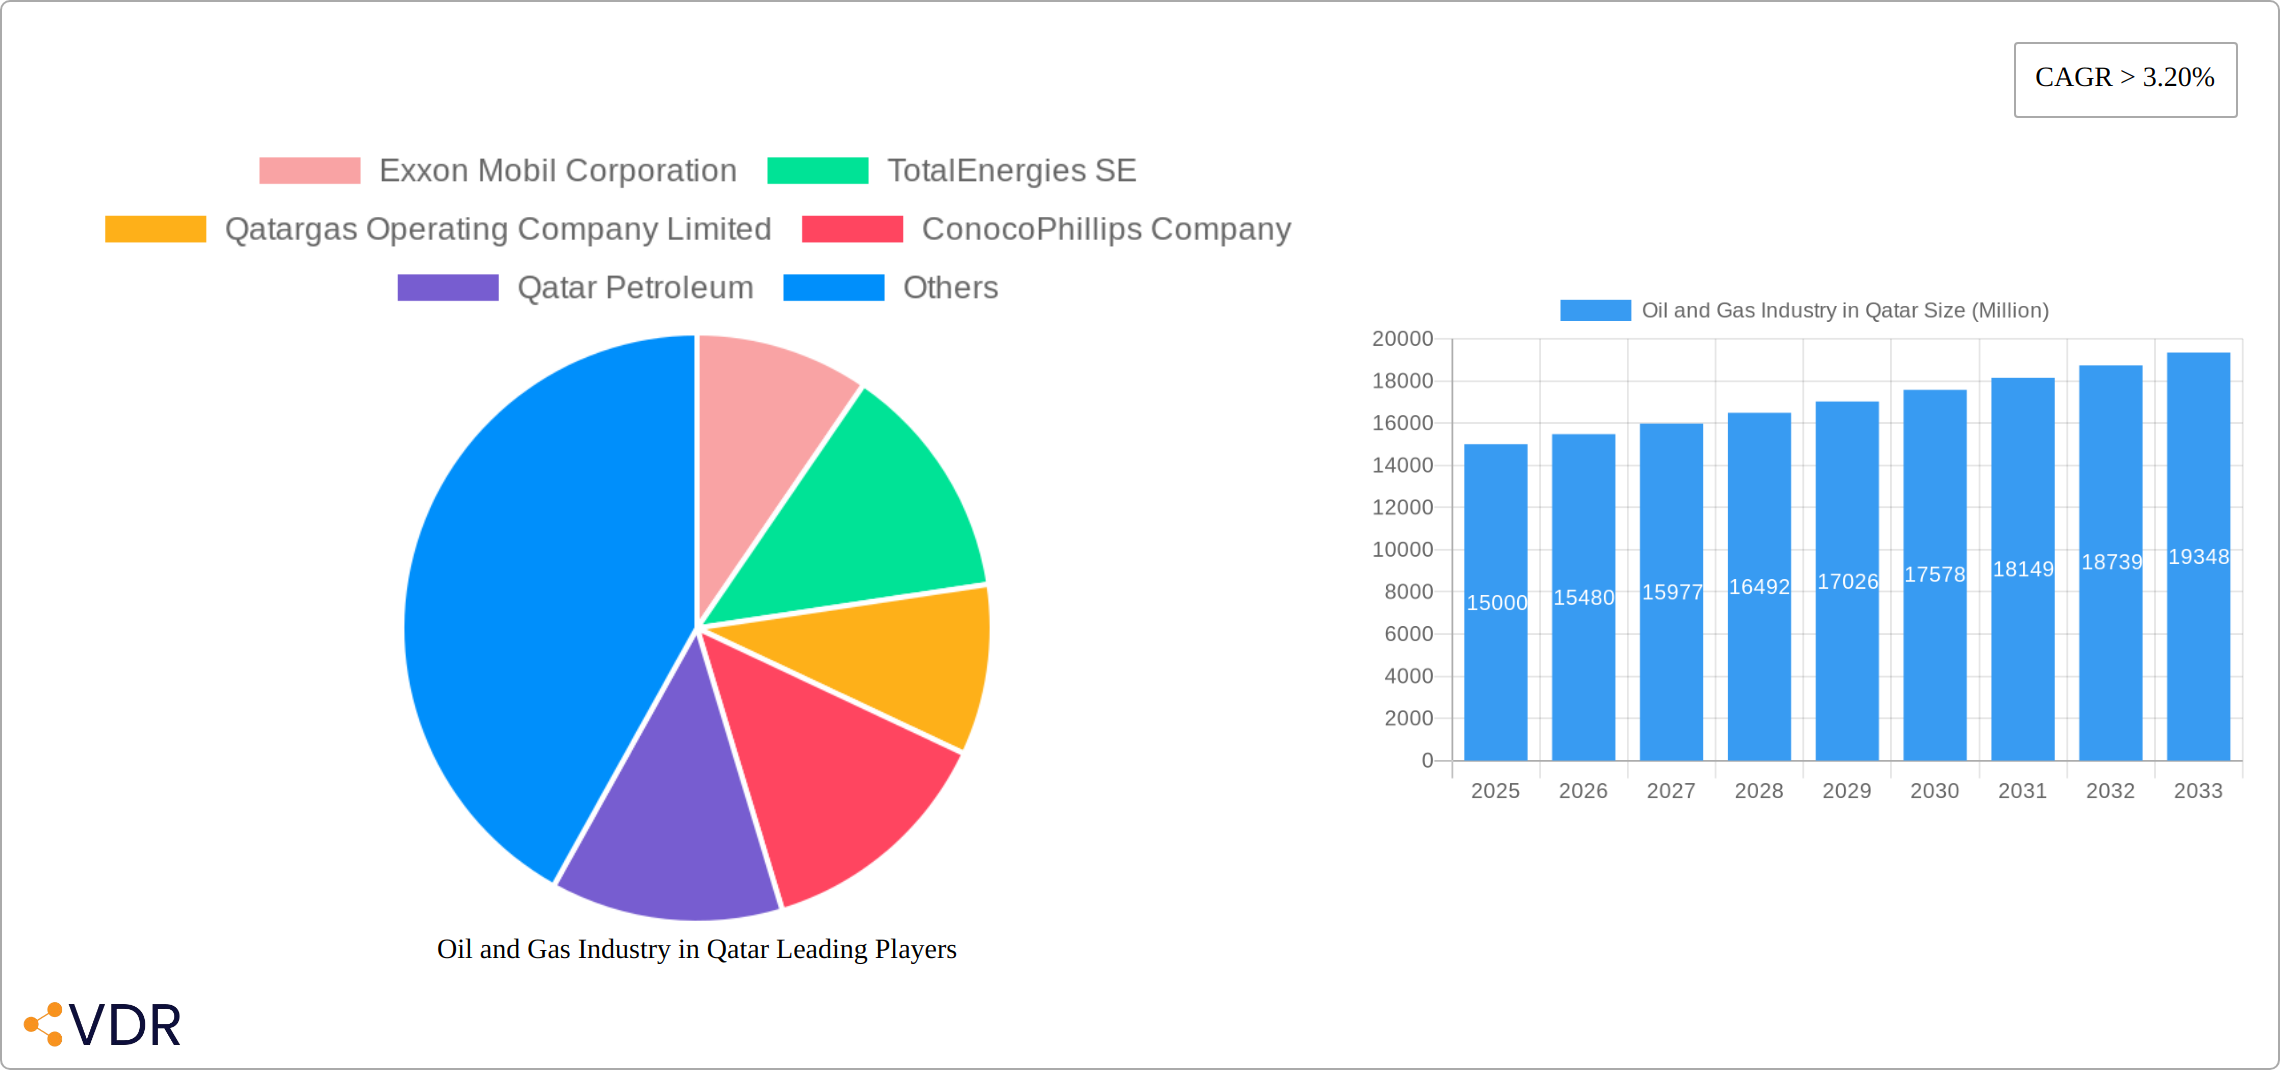
The Qatari oil and gas market, a significant player in the global energy landscape, exhibits robust growth potential. Driven by substantial reserves, strategic government investments in infrastructure development, and a consistent focus on maximizing production efficiency, the sector is projected to maintain a Compound Annual Growth Rate (CAGR) exceeding 3.20% from 2025 to 2033. The upstream segment, encompassing exploration and production, benefits from Qatar's vast natural gas reserves, notably the North Field expansion project, which significantly increases LNG production capacity. This expansion fuels growth in the midstream (processing and transportation) and downstream (refining and distribution) segments, serving both domestic and international markets. Demand is primarily driven by the industrial sector, encompassing petrochemicals and fertilizer production, followed by commercial and residential consumption. Challenges such as global energy transition initiatives and fluctuating oil prices present potential restraints, but Qatar's strategic focus on LNG exports and diversification mitigates these risks. Major players like ExxonMobil, TotalEnergies, and Qatargas are key contributors to the industry's success, leveraging their expertise and technological advancements to maintain production and expand market share.
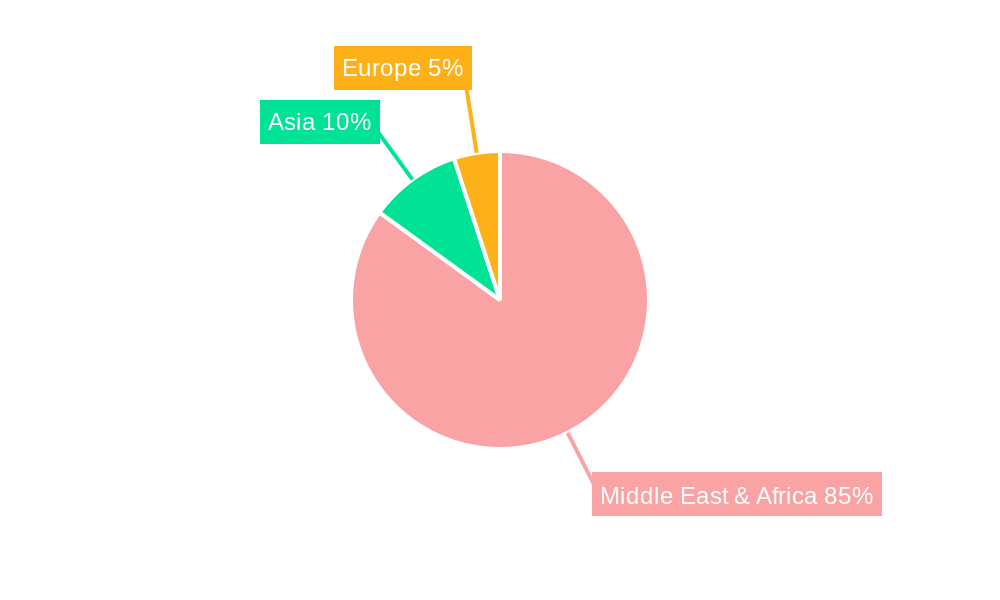
The market segmentation reveals a strong emphasis on LNG exports, contributing significantly to Qatar's economic diversification strategy. The country's geographical location provides strategic advantages in accessing major Asian and European markets. While the residential sector's demand is comparatively smaller, the industrial sector's reliance on oil and gas for its operations acts as a considerable market driver. Future growth hinges on maintaining technological innovation, strategic partnerships, and continued investment in sustainable practices to ensure long-term profitability and environmental responsibility within the evolving global energy landscape. Competition among major players drives efficiency and technological advancements, while government regulations promote responsible resource management and environmental stewardship. The continued focus on the North Field expansion project ensures Qatar's position as a leading global LNG exporter for years to come.
Oil and Gas Industry in Qatar: A Comprehensive Market Report (2019-2033)
This comprehensive report provides an in-depth analysis of the Oil and Gas Industry in Qatar, covering the period from 2019 to 2033. It examines market dynamics, growth trends, dominant segments, key players, and future opportunities, offering invaluable insights for industry professionals, investors, and policymakers. The report leverages extensive data analysis and expert insights to provide a clear understanding of this crucial sector in the Qatari economy. Keywords: Qatar Oil and Gas, Upstream Qatar, Midstream Qatar, Downstream Qatar, Qatar Petroleum, ExxonMobil Qatar, TotalEnergies Qatar, Qatargas, ConocoPhillips Qatar, Oil and Gas Market Qatar, Energy Market Qatar.
Oil and Gas Industry in Qatar Market Dynamics & Structure
This section provides a comprehensive analysis of Qatar's oil and gas market dynamics and structure, covering market concentration, technological advancements, regulatory frameworks, competitive landscape, mergers and acquisitions (M&A) activities, and the impact of global trends. The study period spans from 2019 to 2033, with 2025 serving as the base and estimated year. The forecast period is 2025-2033, and the historical period is 2019-2024.
- Market Concentration: The Qatari oil and gas market exhibits high concentration, with a few dominant players controlling a significant market share. QatarEnergy (formerly Qatar Petroleum) holds a leading position in the upstream sector. In 2025, the top five companies (QatarEnergy, ExxonMobil Corporation, TotalEnergies SE, Qatargas Operating Company Limited, and ConocoPhillips Company) are estimated to collectively control approximately 85% of the market. This concentration influences pricing, investment decisions, and overall market behavior.
- Technological Innovation: The industry is characterized by continuous technological advancements, driven by the pursuit of enhanced efficiency, reduced environmental impact, improved safety, and increased production capacity. Key areas of innovation include advanced gas liquefaction techniques, carbon capture and storage (CCS) technologies, and digitalization efforts. However, significant barriers to innovation persist, including substantial capital investment requirements and the need for a highly skilled workforce.
- Regulatory Framework: The Qatari government plays a crucial role in regulating the oil and gas sector, aiming to ensure sustainable development, maximize national benefits, and maintain a stable investment climate. The regulatory framework encompasses licensing, environmental protection, safety standards, and fiscal policies. Changes in regulations directly influence investment decisions and operational strategies of companies operating within the sector.
- Competitive Landscape & Product Substitutes: The emergence of renewable energy sources, such as solar and wind power, poses a long-term competitive challenge to traditional fossil fuels. Natural gas, however, is currently positioned as a crucial transition fuel due to its relatively lower carbon emissions compared to coal and oil. The competitive landscape also involves international energy companies vying for market share and project development opportunities.
- End-User Demographics and Demand: The primary end-users of Qatari oil and gas products are the industrial, commercial, and residential sectors, with industrial applications representing the largest share of demand. Detailed demand projections for each sector, considering factors such as economic growth and energy consumption patterns, are incorporated into the analysis.
- M&A Trends: The Qatari oil and gas sector has witnessed notable mergers and acquisitions (M&A) activity in recent years, primarily focused on resource consolidation, operational expansion, and technological integration. The total value of M&A deals within the sector from 2019 to 2024 is estimated at [Insert Estimated Value] Million. These activities are expected to continue shaping the market structure and competitiveness.
Oil and Gas Industry in Qatar Growth Trends & Insights
Qatar's oil and gas market has experienced significant growth over the past decade, driven by factors such as increasing global energy demand, strategic investments in upstream production, and expansion of LNG export capacity. The market size is projected to reach xx Million in 2025 and xx Million in 2033, exhibiting a Compound Annual Growth Rate (CAGR) of xx% during the forecast period. This growth is attributed to [specific reasons, e.g., increased production of LNG, strategic partnerships]. Technological disruptions, particularly in upstream exploration and production, have contributed to enhanced efficiency and cost reduction. Shifting consumer behavior towards cleaner energy sources is expected to moderate market growth but not significantly hinder it during the forecast period. Detailed segment-wise CAGR and market penetration data are provided in the full report.

Dominant Regions, Countries, or Segments in Oil and Gas Industry in Qatar
The upstream segment, particularly natural gas production, is the dominant driver of growth in Qatar's oil and gas industry. The country's massive North Field gas reserves are a key factor.
- Upstream: The vast reserves of natural gas in the North Field fuel the dominance of the upstream segment. This is further supported by strategic investments in exploration and production technologies. Market share in 2025 is estimated at xx%.
- Midstream: The expansion of LNG export infrastructure significantly contributes to the growth of the midstream segment. Market share in 2025 is estimated at xx%.
- Downstream: The downstream segment's growth is closely linked to the development of petrochemical industries and domestic demand. Market share in 2025 is estimated at xx%.
- Industrial: The industrial sector consumes the largest share of oil and gas, mainly for power generation and petrochemical production. Market share in 2025 is estimated at xx%.
- Commercial: The commercial sector shows steady growth, driven by economic expansion and infrastructure development. Market share in 2025 is estimated at xx%.
- Residential: The residential sector's consumption is comparatively smaller, yet still vital for household energy needs. Market share in 2025 is estimated at xx%.
Oil and Gas Industry in Qatar Product Landscape
The Qatari oil and gas sector focuses on producing high-quality LNG, along with associated petrochemicals. Recent innovations include advanced technologies for gas liquefaction, enhancing efficiency and reducing environmental impact. Product differentiation relies on superior quality, reliability of supply, and long-term contracts. Technological advancements have led to improved safety, reduced operational costs, and increased production capacity.
Key Drivers, Barriers & Challenges in Oil and Gas Industry in Qatar
Key Drivers: Qatar's massive natural gas reserves, strategic government investment, and favorable geographical location are major growth drivers. Furthermore, technological advancements in LNG production and export have expanded the market reach. The country's political stability and strong infrastructure contribute to a secure investment climate.
Key Challenges: Global price volatility, increasing environmental concerns, and the need for continuous technological upgrades are significant challenges. The growing adoption of renewable energy sources introduces long-term competition. Supply chain disruptions can impact operations, and regulatory compliance requirements can increase operational costs.
Emerging Opportunities in Oil and Gas Industry in Qatar
Emerging opportunities include expanding into new petrochemical products, improving the efficiency of gas-to-power and gas-to-chemicals conversion, and leveraging the digital transformation for optimization across the value chain.
Growth Accelerators in the Oil and Gas Industry in Qatar Industry
Long-term growth in Qatar's oil and gas sector will be driven by continued investment in upstream production, expansion of LNG export capacity, and strategic partnerships for downstream development. Technological innovation, particularly in carbon capture and storage, will play a key role in ensuring sustainable growth.
Key Players Shaping the Oil and Gas Industry in Qatar Market
- Exxon Mobil Corporation
- TotalEnergies SE
- Qatargas Operating Company Limited
- ConocoPhillips Company
- Qatar Petroleum
Notable Milestones in Oil and Gas Industry in Qatar Sector
- 2021: Significant expansion of the North Field East project announced.
- 2022: Continued investments in LNG export infrastructure.
- 2023: Focus on carbon capture and storage technologies implemented. (Further milestones to be added as data becomes available)
In-Depth Oil and Gas Industry in Qatar Market Outlook
The future of Qatar's oil and gas industry is bright, driven by its significant reserves and strategic initiatives. Continued investment in LNG production, coupled with technological advancements and strategic partnerships, will ensure strong growth. The market's long-term potential lies in diversification into petrochemicals and leveraging its position as a major LNG exporter. The focus on sustainability and environmental responsibility will play a critical role in shaping the sector's future.
Oil and Gas Industry in Qatar Segmentation
- 1. Upstream
- 2. Midstream
- 3. Downstream
Oil and Gas Industry in Qatar Segmentation By Geography
-
1. North America
- 1.1. United States
- 1.2. Canada
- 1.3. Mexico
-
2. South America
- 2.1. Brazil
- 2.2. Argentina
- 2.3. Rest of South America
-
3. Europe
- 3.1. United Kingdom
- 3.2. Germany
- 3.3. France
- 3.4. Italy
- 3.5. Spain
- 3.6. Russia
- 3.7. Benelux
- 3.8. Nordics
- 3.9. Rest of Europe
-
4. Middle East & Africa
- 4.1. Turkey
- 4.2. Israel
- 4.3. GCC
- 4.4. North Africa
- 4.5. South Africa
- 4.6. Rest of Middle East & Africa
-
5. Asia Pacific
- 5.1. China
- 5.2. India
- 5.3. Japan
- 5.4. South Korea
- 5.5. ASEAN
- 5.6. Oceania
- 5.7. Rest of Asia Pacific
Oil and Gas Industry in Qatar REPORT HIGHLIGHTS
| Aspects | Details |
|---|---|
| Study Period | 2019-2033 |
| Base Year | 2024 |
| Estimated Year | 2025 |
| Forecast Period | 2025-2033 |
| Historical Period | 2019-2024 |
| Growth Rate | CAGR of > 3.20% from 2019-2033 |
| Segmentation |
|
Table of Contents
- 1. Introduction
- 1.1. Research Scope
- 1.2. Market Segmentation
- 1.3. Research Methodology
- 1.4. Definitions and Assumptions
- 2. Executive Summary
- 2.1. Introduction
- 3. Market Dynamics
- 3.1. Introduction
- 3.2. Market Drivers
- 3.2.1. Drivers; Restraints
- 3.3. Market Restrains
- 3.3.1. 4.; Political Instability and Militant Attacks on Pipeline Infrastructure
- 3.4. Market Trends
- 3.4.1. Upstream Segment to Dominate the Market
- 4. Market Factor Analysis
- 4.1. Porters Five Forces
- 4.2. Supply/Value Chain
- 4.3. PESTEL analysis
- 4.4. Market Entropy
- 4.5. Patent/Trademark Analysis
- 5. Global Oil and Gas Industry in Qatar Analysis, Insights and Forecast, 2019-2031
- 5.1. Market Analysis, Insights and Forecast - by Upstream
- 5.2. Market Analysis, Insights and Forecast - by Midstream
- 5.3. Market Analysis, Insights and Forecast - by Downstream
- 5.4. Market Analysis, Insights and Forecast - by Region
- 5.4.1. North America
- 5.4.2. South America
- 5.4.3. Europe
- 5.4.4. Middle East & Africa
- 5.4.5. Asia Pacific
- 5.1. Market Analysis, Insights and Forecast - by Upstream
- 6. North America Oil and Gas Industry in Qatar Analysis, Insights and Forecast, 2019-2031
- 6.1. Market Analysis, Insights and Forecast - by Upstream
- 6.2. Market Analysis, Insights and Forecast - by Midstream
- 6.3. Market Analysis, Insights and Forecast - by Downstream
- 6.1. Market Analysis, Insights and Forecast - by Upstream
- 7. South America Oil and Gas Industry in Qatar Analysis, Insights and Forecast, 2019-2031
- 7.1. Market Analysis, Insights and Forecast - by Upstream
- 7.2. Market Analysis, Insights and Forecast - by Midstream
- 7.3. Market Analysis, Insights and Forecast - by Downstream
- 7.1. Market Analysis, Insights and Forecast - by Upstream
- 8. Europe Oil and Gas Industry in Qatar Analysis, Insights and Forecast, 2019-2031
- 8.1. Market Analysis, Insights and Forecast - by Upstream
- 8.2. Market Analysis, Insights and Forecast - by Midstream
- 8.3. Market Analysis, Insights and Forecast - by Downstream
- 8.1. Market Analysis, Insights and Forecast - by Upstream
- 9. Middle East & Africa Oil and Gas Industry in Qatar Analysis, Insights and Forecast, 2019-2031
- 9.1. Market Analysis, Insights and Forecast - by Upstream
- 9.2. Market Analysis, Insights and Forecast - by Midstream
- 9.3. Market Analysis, Insights and Forecast - by Downstream
- 9.1. Market Analysis, Insights and Forecast - by Upstream
- 10. Asia Pacific Oil and Gas Industry in Qatar Analysis, Insights and Forecast, 2019-2031
- 10.1. Market Analysis, Insights and Forecast - by Upstream
- 10.2. Market Analysis, Insights and Forecast - by Midstream
- 10.3. Market Analysis, Insights and Forecast - by Downstream
- 10.1. Market Analysis, Insights and Forecast - by Upstream
- 11. UAE Oil and Gas Industry in Qatar Analysis, Insights and Forecast, 2019-2031
- 12. South Africa Oil and Gas Industry in Qatar Analysis, Insights and Forecast, 2019-2031
- 13. Saudi Arabia Oil and Gas Industry in Qatar Analysis, Insights and Forecast, 2019-2031
- 14. Rest of MEA Oil and Gas Industry in Qatar Analysis, Insights and Forecast, 2019-2031
- 15. Competitive Analysis
- 15.1. Global Market Share Analysis 2024
- 15.2. Company Profiles
- 15.2.1 Exxon Mobil Corporation
- 15.2.1.1. Overview
- 15.2.1.2. Products
- 15.2.1.3. SWOT Analysis
- 15.2.1.4. Recent Developments
- 15.2.1.5. Financials (Based on Availability)
- 15.2.2 TotalEnergies SE
- 15.2.2.1. Overview
- 15.2.2.2. Products
- 15.2.2.3. SWOT Analysis
- 15.2.2.4. Recent Developments
- 15.2.2.5. Financials (Based on Availability)
- 15.2.3 Qatargas Operating Company Limited
- 15.2.3.1. Overview
- 15.2.3.2. Products
- 15.2.3.3. SWOT Analysis
- 15.2.3.4. Recent Developments
- 15.2.3.5. Financials (Based on Availability)
- 15.2.4 ConocoPhillips Company
- 15.2.4.1. Overview
- 15.2.4.2. Products
- 15.2.4.3. SWOT Analysis
- 15.2.4.4. Recent Developments
- 15.2.4.5. Financials (Based on Availability)
- 15.2.5 Qatar Petroleum
- 15.2.5.1. Overview
- 15.2.5.2. Products
- 15.2.5.3. SWOT Analysis
- 15.2.5.4. Recent Developments
- 15.2.5.5. Financials (Based on Availability)
- 15.2.1 Exxon Mobil Corporation
List of Figures
- Figure 1: Global Oil and Gas Industry in Qatar Revenue Breakdown (Million, %) by Region 2024 & 2032
- Figure 2: Global Oil and Gas Industry in Qatar Volume Breakdown (Tonnes, %) by Region 2024 & 2032
- Figure 3: Middle East & Africa Oil and Gas Industry in Qatar Revenue (Million), by Country 2024 & 2032
- Figure 4: Middle East & Africa Oil and Gas Industry in Qatar Volume (Tonnes), by Country 2024 & 2032
- Figure 5: Middle East & Africa Oil and Gas Industry in Qatar Revenue Share (%), by Country 2024 & 2032
- Figure 6: Middle East & Africa Oil and Gas Industry in Qatar Volume Share (%), by Country 2024 & 2032
- Figure 7: North America Oil and Gas Industry in Qatar Revenue (Million), by Upstream 2024 & 2032
- Figure 8: North America Oil and Gas Industry in Qatar Volume (Tonnes), by Upstream 2024 & 2032
- Figure 9: North America Oil and Gas Industry in Qatar Revenue Share (%), by Upstream 2024 & 2032
- Figure 10: North America Oil and Gas Industry in Qatar Volume Share (%), by Upstream 2024 & 2032
- Figure 11: North America Oil and Gas Industry in Qatar Revenue (Million), by Midstream 2024 & 2032
- Figure 12: North America Oil and Gas Industry in Qatar Volume (Tonnes), by Midstream 2024 & 2032
- Figure 13: North America Oil and Gas Industry in Qatar Revenue Share (%), by Midstream 2024 & 2032
- Figure 14: North America Oil and Gas Industry in Qatar Volume Share (%), by Midstream 2024 & 2032
- Figure 15: North America Oil and Gas Industry in Qatar Revenue (Million), by Downstream 2024 & 2032
- Figure 16: North America Oil and Gas Industry in Qatar Volume (Tonnes), by Downstream 2024 & 2032
- Figure 17: North America Oil and Gas Industry in Qatar Revenue Share (%), by Downstream 2024 & 2032
- Figure 18: North America Oil and Gas Industry in Qatar Volume Share (%), by Downstream 2024 & 2032
- Figure 19: North America Oil and Gas Industry in Qatar Revenue (Million), by Country 2024 & 2032
- Figure 20: North America Oil and Gas Industry in Qatar Volume (Tonnes), by Country 2024 & 2032
- Figure 21: North America Oil and Gas Industry in Qatar Revenue Share (%), by Country 2024 & 2032
- Figure 22: North America Oil and Gas Industry in Qatar Volume Share (%), by Country 2024 & 2032
- Figure 23: South America Oil and Gas Industry in Qatar Revenue (Million), by Upstream 2024 & 2032
- Figure 24: South America Oil and Gas Industry in Qatar Volume (Tonnes), by Upstream 2024 & 2032
- Figure 25: South America Oil and Gas Industry in Qatar Revenue Share (%), by Upstream 2024 & 2032
- Figure 26: South America Oil and Gas Industry in Qatar Volume Share (%), by Upstream 2024 & 2032
- Figure 27: South America Oil and Gas Industry in Qatar Revenue (Million), by Midstream 2024 & 2032
- Figure 28: South America Oil and Gas Industry in Qatar Volume (Tonnes), by Midstream 2024 & 2032
- Figure 29: South America Oil and Gas Industry in Qatar Revenue Share (%), by Midstream 2024 & 2032
- Figure 30: South America Oil and Gas Industry in Qatar Volume Share (%), by Midstream 2024 & 2032
- Figure 31: South America Oil and Gas Industry in Qatar Revenue (Million), by Downstream 2024 & 2032
- Figure 32: South America Oil and Gas Industry in Qatar Volume (Tonnes), by Downstream 2024 & 2032
- Figure 33: South America Oil and Gas Industry in Qatar Revenue Share (%), by Downstream 2024 & 2032
- Figure 34: South America Oil and Gas Industry in Qatar Volume Share (%), by Downstream 2024 & 2032
- Figure 35: South America Oil and Gas Industry in Qatar Revenue (Million), by Country 2024 & 2032
- Figure 36: South America Oil and Gas Industry in Qatar Volume (Tonnes), by Country 2024 & 2032
- Figure 37: South America Oil and Gas Industry in Qatar Revenue Share (%), by Country 2024 & 2032
- Figure 38: South America Oil and Gas Industry in Qatar Volume Share (%), by Country 2024 & 2032
- Figure 39: Europe Oil and Gas Industry in Qatar Revenue (Million), by Upstream 2024 & 2032
- Figure 40: Europe Oil and Gas Industry in Qatar Volume (Tonnes), by Upstream 2024 & 2032
- Figure 41: Europe Oil and Gas Industry in Qatar Revenue Share (%), by Upstream 2024 & 2032
- Figure 42: Europe Oil and Gas Industry in Qatar Volume Share (%), by Upstream 2024 & 2032
- Figure 43: Europe Oil and Gas Industry in Qatar Revenue (Million), by Midstream 2024 & 2032
- Figure 44: Europe Oil and Gas Industry in Qatar Volume (Tonnes), by Midstream 2024 & 2032
- Figure 45: Europe Oil and Gas Industry in Qatar Revenue Share (%), by Midstream 2024 & 2032
- Figure 46: Europe Oil and Gas Industry in Qatar Volume Share (%), by Midstream 2024 & 2032
- Figure 47: Europe Oil and Gas Industry in Qatar Revenue (Million), by Downstream 2024 & 2032
- Figure 48: Europe Oil and Gas Industry in Qatar Volume (Tonnes), by Downstream 2024 & 2032
- Figure 49: Europe Oil and Gas Industry in Qatar Revenue Share (%), by Downstream 2024 & 2032
- Figure 50: Europe Oil and Gas Industry in Qatar Volume Share (%), by Downstream 2024 & 2032
- Figure 51: Europe Oil and Gas Industry in Qatar Revenue (Million), by Country 2024 & 2032
- Figure 52: Europe Oil and Gas Industry in Qatar Volume (Tonnes), by Country 2024 & 2032
- Figure 53: Europe Oil and Gas Industry in Qatar Revenue Share (%), by Country 2024 & 2032
- Figure 54: Europe Oil and Gas Industry in Qatar Volume Share (%), by Country 2024 & 2032
- Figure 55: Middle East & Africa Oil and Gas Industry in Qatar Revenue (Million), by Upstream 2024 & 2032
- Figure 56: Middle East & Africa Oil and Gas Industry in Qatar Volume (Tonnes), by Upstream 2024 & 2032
- Figure 57: Middle East & Africa Oil and Gas Industry in Qatar Revenue Share (%), by Upstream 2024 & 2032
- Figure 58: Middle East & Africa Oil and Gas Industry in Qatar Volume Share (%), by Upstream 2024 & 2032
- Figure 59: Middle East & Africa Oil and Gas Industry in Qatar Revenue (Million), by Midstream 2024 & 2032
- Figure 60: Middle East & Africa Oil and Gas Industry in Qatar Volume (Tonnes), by Midstream 2024 & 2032
- Figure 61: Middle East & Africa Oil and Gas Industry in Qatar Revenue Share (%), by Midstream 2024 & 2032
- Figure 62: Middle East & Africa Oil and Gas Industry in Qatar Volume Share (%), by Midstream 2024 & 2032
- Figure 63: Middle East & Africa Oil and Gas Industry in Qatar Revenue (Million), by Downstream 2024 & 2032
- Figure 64: Middle East & Africa Oil and Gas Industry in Qatar Volume (Tonnes), by Downstream 2024 & 2032
- Figure 65: Middle East & Africa Oil and Gas Industry in Qatar Revenue Share (%), by Downstream 2024 & 2032
- Figure 66: Middle East & Africa Oil and Gas Industry in Qatar Volume Share (%), by Downstream 2024 & 2032
- Figure 67: Middle East & Africa Oil and Gas Industry in Qatar Revenue (Million), by Country 2024 & 2032
- Figure 68: Middle East & Africa Oil and Gas Industry in Qatar Volume (Tonnes), by Country 2024 & 2032
- Figure 69: Middle East & Africa Oil and Gas Industry in Qatar Revenue Share (%), by Country 2024 & 2032
- Figure 70: Middle East & Africa Oil and Gas Industry in Qatar Volume Share (%), by Country 2024 & 2032
- Figure 71: Asia Pacific Oil and Gas Industry in Qatar Revenue (Million), by Upstream 2024 & 2032
- Figure 72: Asia Pacific Oil and Gas Industry in Qatar Volume (Tonnes), by Upstream 2024 & 2032
- Figure 73: Asia Pacific Oil and Gas Industry in Qatar Revenue Share (%), by Upstream 2024 & 2032
- Figure 74: Asia Pacific Oil and Gas Industry in Qatar Volume Share (%), by Upstream 2024 & 2032
- Figure 75: Asia Pacific Oil and Gas Industry in Qatar Revenue (Million), by Midstream 2024 & 2032
- Figure 76: Asia Pacific Oil and Gas Industry in Qatar Volume (Tonnes), by Midstream 2024 & 2032
- Figure 77: Asia Pacific Oil and Gas Industry in Qatar Revenue Share (%), by Midstream 2024 & 2032
- Figure 78: Asia Pacific Oil and Gas Industry in Qatar Volume Share (%), by Midstream 2024 & 2032
- Figure 79: Asia Pacific Oil and Gas Industry in Qatar Revenue (Million), by Downstream 2024 & 2032
- Figure 80: Asia Pacific Oil and Gas Industry in Qatar Volume (Tonnes), by Downstream 2024 & 2032
- Figure 81: Asia Pacific Oil and Gas Industry in Qatar Revenue Share (%), by Downstream 2024 & 2032
- Figure 82: Asia Pacific Oil and Gas Industry in Qatar Volume Share (%), by Downstream 2024 & 2032
- Figure 83: Asia Pacific Oil and Gas Industry in Qatar Revenue (Million), by Country 2024 & 2032
- Figure 84: Asia Pacific Oil and Gas Industry in Qatar Volume (Tonnes), by Country 2024 & 2032
- Figure 85: Asia Pacific Oil and Gas Industry in Qatar Revenue Share (%), by Country 2024 & 2032
- Figure 86: Asia Pacific Oil and Gas Industry in Qatar Volume Share (%), by Country 2024 & 2032
List of Tables
- Table 1: Global Oil and Gas Industry in Qatar Revenue Million Forecast, by Region 2019 & 2032
- Table 2: Global Oil and Gas Industry in Qatar Volume Tonnes Forecast, by Region 2019 & 2032
- Table 3: Global Oil and Gas Industry in Qatar Revenue Million Forecast, by Upstream 2019 & 2032
- Table 4: Global Oil and Gas Industry in Qatar Volume Tonnes Forecast, by Upstream 2019 & 2032
- Table 5: Global Oil and Gas Industry in Qatar Revenue Million Forecast, by Midstream 2019 & 2032
- Table 6: Global Oil and Gas Industry in Qatar Volume Tonnes Forecast, by Midstream 2019 & 2032
- Table 7: Global Oil and Gas Industry in Qatar Revenue Million Forecast, by Downstream 2019 & 2032
- Table 8: Global Oil and Gas Industry in Qatar Volume Tonnes Forecast, by Downstream 2019 & 2032
- Table 9: Global Oil and Gas Industry in Qatar Revenue Million Forecast, by Region 2019 & 2032
- Table 10: Global Oil and Gas Industry in Qatar Volume Tonnes Forecast, by Region 2019 & 2032
- Table 11: Global Oil and Gas Industry in Qatar Revenue Million Forecast, by Country 2019 & 2032
- Table 12: Global Oil and Gas Industry in Qatar Volume Tonnes Forecast, by Country 2019 & 2032
- Table 13: UAE Oil and Gas Industry in Qatar Revenue (Million) Forecast, by Application 2019 & 2032
- Table 14: UAE Oil and Gas Industry in Qatar Volume (Tonnes) Forecast, by Application 2019 & 2032
- Table 15: South Africa Oil and Gas Industry in Qatar Revenue (Million) Forecast, by Application 2019 & 2032
- Table 16: South Africa Oil and Gas Industry in Qatar Volume (Tonnes) Forecast, by Application 2019 & 2032
- Table 17: Saudi Arabia Oil and Gas Industry in Qatar Revenue (Million) Forecast, by Application 2019 & 2032
- Table 18: Saudi Arabia Oil and Gas Industry in Qatar Volume (Tonnes) Forecast, by Application 2019 & 2032
- Table 19: Rest of MEA Oil and Gas Industry in Qatar Revenue (Million) Forecast, by Application 2019 & 2032
- Table 20: Rest of MEA Oil and Gas Industry in Qatar Volume (Tonnes) Forecast, by Application 2019 & 2032
- Table 21: Global Oil and Gas Industry in Qatar Revenue Million Forecast, by Upstream 2019 & 2032
- Table 22: Global Oil and Gas Industry in Qatar Volume Tonnes Forecast, by Upstream 2019 & 2032
- Table 23: Global Oil and Gas Industry in Qatar Revenue Million Forecast, by Midstream 2019 & 2032
- Table 24: Global Oil and Gas Industry in Qatar Volume Tonnes Forecast, by Midstream 2019 & 2032
- Table 25: Global Oil and Gas Industry in Qatar Revenue Million Forecast, by Downstream 2019 & 2032
- Table 26: Global Oil and Gas Industry in Qatar Volume Tonnes Forecast, by Downstream 2019 & 2032
- Table 27: Global Oil and Gas Industry in Qatar Revenue Million Forecast, by Country 2019 & 2032
- Table 28: Global Oil and Gas Industry in Qatar Volume Tonnes Forecast, by Country 2019 & 2032
- Table 29: United States Oil and Gas Industry in Qatar Revenue (Million) Forecast, by Application 2019 & 2032
- Table 30: United States Oil and Gas Industry in Qatar Volume (Tonnes) Forecast, by Application 2019 & 2032
- Table 31: Canada Oil and Gas Industry in Qatar Revenue (Million) Forecast, by Application 2019 & 2032
- Table 32: Canada Oil and Gas Industry in Qatar Volume (Tonnes) Forecast, by Application 2019 & 2032
- Table 33: Mexico Oil and Gas Industry in Qatar Revenue (Million) Forecast, by Application 2019 & 2032
- Table 34: Mexico Oil and Gas Industry in Qatar Volume (Tonnes) Forecast, by Application 2019 & 2032
- Table 35: Global Oil and Gas Industry in Qatar Revenue Million Forecast, by Upstream 2019 & 2032
- Table 36: Global Oil and Gas Industry in Qatar Volume Tonnes Forecast, by Upstream 2019 & 2032
- Table 37: Global Oil and Gas Industry in Qatar Revenue Million Forecast, by Midstream 2019 & 2032
- Table 38: Global Oil and Gas Industry in Qatar Volume Tonnes Forecast, by Midstream 2019 & 2032
- Table 39: Global Oil and Gas Industry in Qatar Revenue Million Forecast, by Downstream 2019 & 2032
- Table 40: Global Oil and Gas Industry in Qatar Volume Tonnes Forecast, by Downstream 2019 & 2032
- Table 41: Global Oil and Gas Industry in Qatar Revenue Million Forecast, by Country 2019 & 2032
- Table 42: Global Oil and Gas Industry in Qatar Volume Tonnes Forecast, by Country 2019 & 2032
- Table 43: Brazil Oil and Gas Industry in Qatar Revenue (Million) Forecast, by Application 2019 & 2032
- Table 44: Brazil Oil and Gas Industry in Qatar Volume (Tonnes) Forecast, by Application 2019 & 2032
- Table 45: Argentina Oil and Gas Industry in Qatar Revenue (Million) Forecast, by Application 2019 & 2032
- Table 46: Argentina Oil and Gas Industry in Qatar Volume (Tonnes) Forecast, by Application 2019 & 2032
- Table 47: Rest of South America Oil and Gas Industry in Qatar Revenue (Million) Forecast, by Application 2019 & 2032
- Table 48: Rest of South America Oil and Gas Industry in Qatar Volume (Tonnes) Forecast, by Application 2019 & 2032
- Table 49: Global Oil and Gas Industry in Qatar Revenue Million Forecast, by Upstream 2019 & 2032
- Table 50: Global Oil and Gas Industry in Qatar Volume Tonnes Forecast, by Upstream 2019 & 2032
- Table 51: Global Oil and Gas Industry in Qatar Revenue Million Forecast, by Midstream 2019 & 2032
- Table 52: Global Oil and Gas Industry in Qatar Volume Tonnes Forecast, by Midstream 2019 & 2032
- Table 53: Global Oil and Gas Industry in Qatar Revenue Million Forecast, by Downstream 2019 & 2032
- Table 54: Global Oil and Gas Industry in Qatar Volume Tonnes Forecast, by Downstream 2019 & 2032
- Table 55: Global Oil and Gas Industry in Qatar Revenue Million Forecast, by Country 2019 & 2032
- Table 56: Global Oil and Gas Industry in Qatar Volume Tonnes Forecast, by Country 2019 & 2032
- Table 57: United Kingdom Oil and Gas Industry in Qatar Revenue (Million) Forecast, by Application 2019 & 2032
- Table 58: United Kingdom Oil and Gas Industry in Qatar Volume (Tonnes) Forecast, by Application 2019 & 2032
- Table 59: Germany Oil and Gas Industry in Qatar Revenue (Million) Forecast, by Application 2019 & 2032
- Table 60: Germany Oil and Gas Industry in Qatar Volume (Tonnes) Forecast, by Application 2019 & 2032
- Table 61: France Oil and Gas Industry in Qatar Revenue (Million) Forecast, by Application 2019 & 2032
- Table 62: France Oil and Gas Industry in Qatar Volume (Tonnes) Forecast, by Application 2019 & 2032
- Table 63: Italy Oil and Gas Industry in Qatar Revenue (Million) Forecast, by Application 2019 & 2032
- Table 64: Italy Oil and Gas Industry in Qatar Volume (Tonnes) Forecast, by Application 2019 & 2032
- Table 65: Spain Oil and Gas Industry in Qatar Revenue (Million) Forecast, by Application 2019 & 2032
- Table 66: Spain Oil and Gas Industry in Qatar Volume (Tonnes) Forecast, by Application 2019 & 2032
- Table 67: Russia Oil and Gas Industry in Qatar Revenue (Million) Forecast, by Application 2019 & 2032
- Table 68: Russia Oil and Gas Industry in Qatar Volume (Tonnes) Forecast, by Application 2019 & 2032
- Table 69: Benelux Oil and Gas Industry in Qatar Revenue (Million) Forecast, by Application 2019 & 2032
- Table 70: Benelux Oil and Gas Industry in Qatar Volume (Tonnes) Forecast, by Application 2019 & 2032
- Table 71: Nordics Oil and Gas Industry in Qatar Revenue (Million) Forecast, by Application 2019 & 2032
- Table 72: Nordics Oil and Gas Industry in Qatar Volume (Tonnes) Forecast, by Application 2019 & 2032
- Table 73: Rest of Europe Oil and Gas Industry in Qatar Revenue (Million) Forecast, by Application 2019 & 2032
- Table 74: Rest of Europe Oil and Gas Industry in Qatar Volume (Tonnes) Forecast, by Application 2019 & 2032
- Table 75: Global Oil and Gas Industry in Qatar Revenue Million Forecast, by Upstream 2019 & 2032
- Table 76: Global Oil and Gas Industry in Qatar Volume Tonnes Forecast, by Upstream 2019 & 2032
- Table 77: Global Oil and Gas Industry in Qatar Revenue Million Forecast, by Midstream 2019 & 2032
- Table 78: Global Oil and Gas Industry in Qatar Volume Tonnes Forecast, by Midstream 2019 & 2032
- Table 79: Global Oil and Gas Industry in Qatar Revenue Million Forecast, by Downstream 2019 & 2032
- Table 80: Global Oil and Gas Industry in Qatar Volume Tonnes Forecast, by Downstream 2019 & 2032
- Table 81: Global Oil and Gas Industry in Qatar Revenue Million Forecast, by Country 2019 & 2032
- Table 82: Global Oil and Gas Industry in Qatar Volume Tonnes Forecast, by Country 2019 & 2032
- Table 83: Turkey Oil and Gas Industry in Qatar Revenue (Million) Forecast, by Application 2019 & 2032
- Table 84: Turkey Oil and Gas Industry in Qatar Volume (Tonnes) Forecast, by Application 2019 & 2032
- Table 85: Israel Oil and Gas Industry in Qatar Revenue (Million) Forecast, by Application 2019 & 2032
- Table 86: Israel Oil and Gas Industry in Qatar Volume (Tonnes) Forecast, by Application 2019 & 2032
- Table 87: GCC Oil and Gas Industry in Qatar Revenue (Million) Forecast, by Application 2019 & 2032
- Table 88: GCC Oil and Gas Industry in Qatar Volume (Tonnes) Forecast, by Application 2019 & 2032
- Table 89: North Africa Oil and Gas Industry in Qatar Revenue (Million) Forecast, by Application 2019 & 2032
- Table 90: North Africa Oil and Gas Industry in Qatar Volume (Tonnes) Forecast, by Application 2019 & 2032
- Table 91: South Africa Oil and Gas Industry in Qatar Revenue (Million) Forecast, by Application 2019 & 2032
- Table 92: South Africa Oil and Gas Industry in Qatar Volume (Tonnes) Forecast, by Application 2019 & 2032
- Table 93: Rest of Middle East & Africa Oil and Gas Industry in Qatar Revenue (Million) Forecast, by Application 2019 & 2032
- Table 94: Rest of Middle East & Africa Oil and Gas Industry in Qatar Volume (Tonnes) Forecast, by Application 2019 & 2032
- Table 95: Global Oil and Gas Industry in Qatar Revenue Million Forecast, by Upstream 2019 & 2032
- Table 96: Global Oil and Gas Industry in Qatar Volume Tonnes Forecast, by Upstream 2019 & 2032
- Table 97: Global Oil and Gas Industry in Qatar Revenue Million Forecast, by Midstream 2019 & 2032
- Table 98: Global Oil and Gas Industry in Qatar Volume Tonnes Forecast, by Midstream 2019 & 2032
- Table 99: Global Oil and Gas Industry in Qatar Revenue Million Forecast, by Downstream 2019 & 2032
- Table 100: Global Oil and Gas Industry in Qatar Volume Tonnes Forecast, by Downstream 2019 & 2032
- Table 101: Global Oil and Gas Industry in Qatar Revenue Million Forecast, by Country 2019 & 2032
- Table 102: Global Oil and Gas Industry in Qatar Volume Tonnes Forecast, by Country 2019 & 2032
- Table 103: China Oil and Gas Industry in Qatar Revenue (Million) Forecast, by Application 2019 & 2032
- Table 104: China Oil and Gas Industry in Qatar Volume (Tonnes) Forecast, by Application 2019 & 2032
- Table 105: India Oil and Gas Industry in Qatar Revenue (Million) Forecast, by Application 2019 & 2032
- Table 106: India Oil and Gas Industry in Qatar Volume (Tonnes) Forecast, by Application 2019 & 2032
- Table 107: Japan Oil and Gas Industry in Qatar Revenue (Million) Forecast, by Application 2019 & 2032
- Table 108: Japan Oil and Gas Industry in Qatar Volume (Tonnes) Forecast, by Application 2019 & 2032
- Table 109: South Korea Oil and Gas Industry in Qatar Revenue (Million) Forecast, by Application 2019 & 2032
- Table 110: South Korea Oil and Gas Industry in Qatar Volume (Tonnes) Forecast, by Application 2019 & 2032
- Table 111: ASEAN Oil and Gas Industry in Qatar Revenue (Million) Forecast, by Application 2019 & 2032
- Table 112: ASEAN Oil and Gas Industry in Qatar Volume (Tonnes) Forecast, by Application 2019 & 2032
- Table 113: Oceania Oil and Gas Industry in Qatar Revenue (Million) Forecast, by Application 2019 & 2032
- Table 114: Oceania Oil and Gas Industry in Qatar Volume (Tonnes) Forecast, by Application 2019 & 2032
- Table 115: Rest of Asia Pacific Oil and Gas Industry in Qatar Revenue (Million) Forecast, by Application 2019 & 2032
- Table 116: Rest of Asia Pacific Oil and Gas Industry in Qatar Volume (Tonnes) Forecast, by Application 2019 & 2032
Frequently Asked Questions
1. What is the projected Compound Annual Growth Rate (CAGR) of the Oil and Gas Industry in Qatar?
The projected CAGR is approximately > 3.20%.
2. Which companies are prominent players in the Oil and Gas Industry in Qatar?
Key companies in the market include Exxon Mobil Corporation, TotalEnergies SE, Qatargas Operating Company Limited, ConocoPhillips Company, Qatar Petroleum.
3. What are the main segments of the Oil and Gas Industry in Qatar?
The market segments include Upstream, Midstream, Downstream.
4. Can you provide details about the market size?
The market size is estimated to be USD XX Million as of 2022.
5. What are some drivers contributing to market growth?
Drivers; Restraints.
6. What are the notable trends driving market growth?
Upstream Segment to Dominate the Market.
7. Are there any restraints impacting market growth?
4.; Political Instability and Militant Attacks on Pipeline Infrastructure.
8. Can you provide examples of recent developments in the market?
N/A
9. What pricing options are available for accessing the report?
Pricing options include single-user, multi-user, and enterprise licenses priced at USD 3800, USD 4500, and USD 5800 respectively.
10. Is the market size provided in terms of value or volume?
The market size is provided in terms of value, measured in Million and volume, measured in Tonnes.
11. Are there any specific market keywords associated with the report?
Yes, the market keyword associated with the report is "Oil and Gas Industry in Qatar," which aids in identifying and referencing the specific market segment covered.
12. How do I determine which pricing option suits my needs best?
The pricing options vary based on user requirements and access needs. Individual users may opt for single-user licenses, while businesses requiring broader access may choose multi-user or enterprise licenses for cost-effective access to the report.
13. Are there any additional resources or data provided in the Oil and Gas Industry in Qatar report?
While the report offers comprehensive insights, it's advisable to review the specific contents or supplementary materials provided to ascertain if additional resources or data are available.
14. How can I stay updated on further developments or reports in the Oil and Gas Industry in Qatar?
To stay informed about further developments, trends, and reports in the Oil and Gas Industry in Qatar, consider subscribing to industry newsletters, following relevant companies and organizations, or regularly checking reputable industry news sources and publications.
Methodology
Step 1 - Identification of Relevant Samples Size from Population Database


Step 2 - Approaches for Defining Global Market Size (Value, Volume* & Price*)

Note*: In applicable scenarios
Step 3 - Data Sources
Primary Research
- Web Analytics
- Survey Reports
- Research Institute
- Latest Research Reports
- Opinion Leaders
Secondary Research
- Annual Reports
- White Paper
- Latest Press Release
- Industry Association
- Paid Database
- Investor Presentations

Step 4 - Data Triangulation
Involves using different sources of information in order to increase the validity of a study
These sources are likely to be stakeholders in a program - participants, other researchers, program staff, other community members, and so on.
Then we put all data in single framework & apply various statistical tools to find out the dynamic on the market.
During the analysis stage, feedback from the stakeholder groups would be compared to determine areas of agreement as well as areas of divergence


