
Key Insights
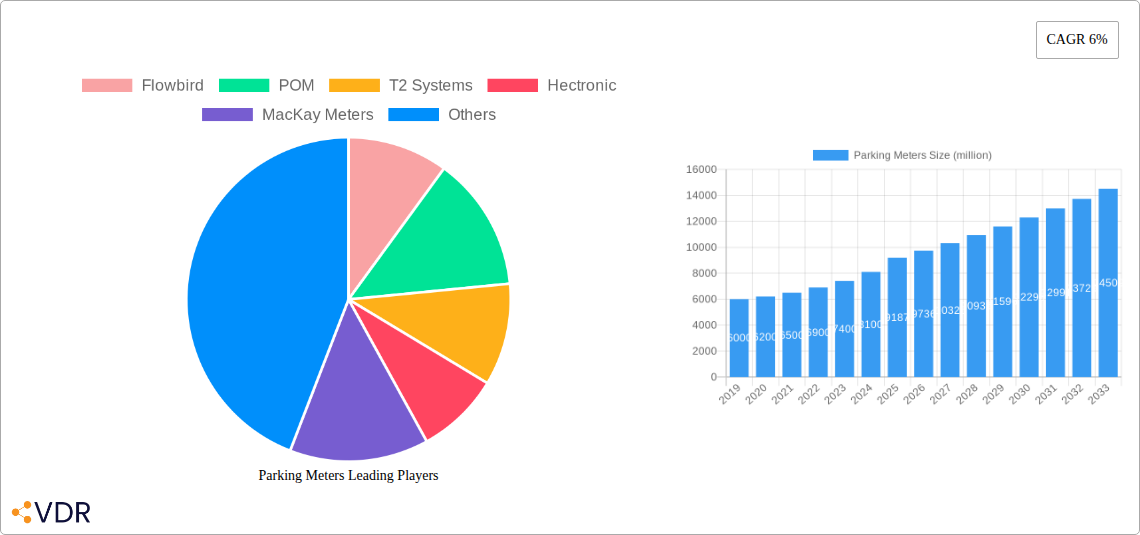
The global parking meters market is poised for substantial growth, projected to reach an estimated market size of $9,187 million by 2025, with a Compound Annual Growth Rate (CAGR) of 6% throughout the forecast period of 2025-2033. This robust expansion is primarily driven by the increasing urbanization and the subsequent rise in vehicular density in cities worldwide, creating an urgent need for efficient parking management solutions. Government institutions are a significant application segment, investing heavily in smart parking technologies to streamline traffic flow, reduce congestion, and enhance urban mobility. Hospitals and transit systems also represent key growth areas, as they seek to optimize parking operations for patient convenience and commuter accessibility. Furthermore, the growing adoption of smart city initiatives and the integration of IoT (Internet of Things) technologies in parking infrastructure are acting as significant catalysts. These advancements enable real-time monitoring, automated payment systems, and data analytics, improving the overall parking experience and operational efficiency. The demand for advanced parking solutions is further fueled by the increasing need for revenue generation and cost optimization by parking operators.
The market is characterized by a strong trend towards the adoption of multi-space parking kiosks, which offer greater flexibility and convenience compared to traditional single-space parking meters. These kiosks can manage multiple parking bays, accept various payment methods, and often integrate with mobile applications for remote payment and parking space availability. Key players such as Flowbird, POM, and T2 Systems are actively innovating and expanding their product portfolios to cater to the evolving demands of governments, municipalities, and private parking operators. Restraints such as the high initial investment cost for advanced parking systems and potential data security concerns are present, but are being addressed through technological advancements and evolving regulatory frameworks. Geographically, North America and Europe are expected to lead the market due to their early adoption of smart city technologies and established infrastructure. However, the Asia Pacific region is anticipated to exhibit the fastest growth, driven by rapid urbanization, increasing disposable incomes, and government initiatives promoting smart infrastructure development.
Comprehensive Report: Global Parking Meters Market Analysis & Future Outlook (2019-2033)
This in-depth report offers a panoramic view of the global parking meters market, providing critical insights for stakeholders across government, technology, and urban planning sectors. With a forecast period extending to 2033, this analysis leverages historical data from 2019-2024 and a base year of 2025 to deliver actionable intelligence on market dynamics, growth trends, regional dominance, product innovations, and future opportunities. We meticulously dissect the parent and child market structures, integrating high-traffic keywords essential for maximizing search engine visibility and engaging industry professionals. All quantitative data is presented in millions of units.
Parking Meters Market Dynamics & Structure
The global parking meters market exhibits a moderately concentrated structure, with key players like Flowbird, POM, and T2 Systems commanding significant market share. Technological innovation is a primary driver, fueled by the integration of IoT, AI, and cashless payment solutions. Regulatory frameworks, particularly those promoting smart city initiatives and urban mobility solutions, are increasingly shaping market adoption. Competitive product substitutes, such as mobile parking applications and integrated payment systems within vehicles, pose a growing challenge, necessitating continuous innovation in smart parking meter technology. End-user demographics are shifting towards tech-savvy urban dwellers and municipalities seeking efficient and user-friendly parking management. Mergers and acquisitions (M&A) are observed, with companies consolidating to expand their product portfolios and geographical reach. For instance, the past five years have seen approximately 15-20 significant M&A deals in the smart parking solutions sector, impacting market concentration. Innovation barriers include the high cost of R&D for advanced features and the need for robust cybersecurity measures.
- Market Concentration: Leading companies hold an estimated 55-60% of the total market share.
- Technological Innovation Drivers: IoT integration for real-time data, AI for predictive analytics, and contactless payment options.
- Regulatory Frameworks: Smart city mandates, urban traffic management policies, and data privacy regulations.
- Competitive Product Substitutes: Mobile parking apps (estimated 25% market penetration), integrated vehicle payment systems.
- End-User Demographics: Urban commuters, property developers, government agencies, and fleet operators.
- M&A Trends: Strategic acquisitions focusing on technology integration and market expansion, with an average of 3-4 major acquisitions annually.
Parking Meters Growth Trends & Insights
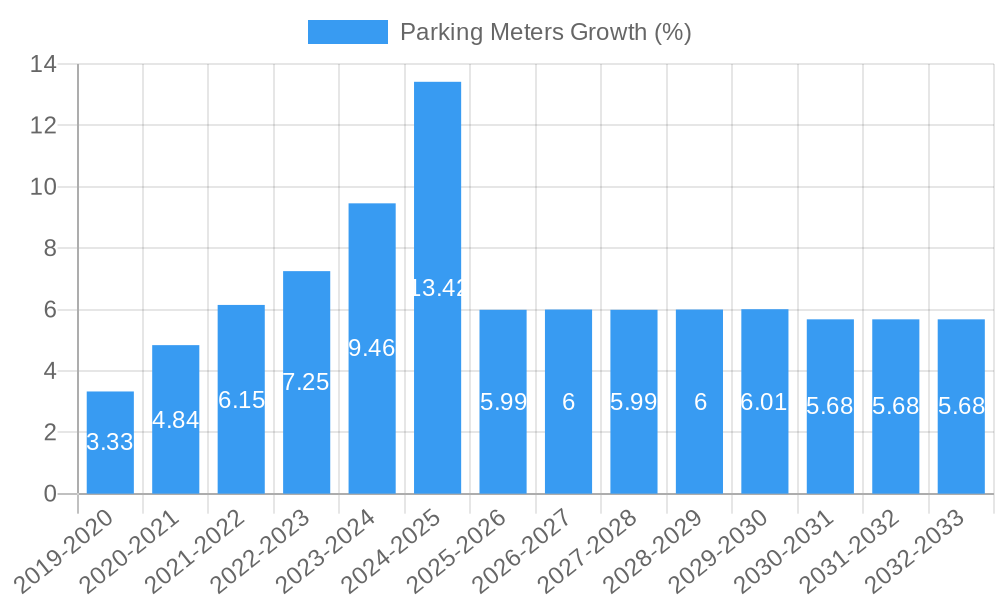
The global parking meters market is poised for robust growth, driven by an escalating need for efficient urban mobility and smart city development. The market size is projected to expand at a Compound Annual Growth Rate (CAGR) of approximately 8.5% between 2025 and 2033. This growth is underpinned by increasing urbanization, a rise in vehicle ownership, and a growing demand for seamless parking experiences. Adoption rates are accelerating, particularly for smart parking meters and kiosks that offer advanced features like remote monitoring, automated payment, and real-time occupancy data. Technological disruptions are transforming the industry, with the advent of AI-powered analytics for optimizing parking space utilization and the integration of 5G technology for enhanced connectivity and data transmission. Consumer behavior is shifting towards convenience and speed, with a strong preference for cashless transactions and app-based parking solutions. The penetration of smart parking meters, which currently stands at around 40%, is expected to reach over 70% by 2033. This evolution is creating a ripple effect across the entire parking ecosystem, from meter manufacturing to enforcement and payment processing. The demand for solutions that reduce traffic congestion and improve air quality in urban centers is also a significant catalyst. Furthermore, the increasing deployment of electric vehicles (EVs) is creating new opportunities for integrated charging and parking solutions, further propelling market growth. The base year (2025) witnessed a market valuation of approximately $4.5 billion, with projections indicating a significant surge in the forecast period.
Dominant Regions, Countries, or Segments in Parking Meters
North America is currently the dominant region in the global parking meters market, driven by strong government initiatives supporting smart city development and a high adoption rate of advanced parking technologies. The United States, in particular, leads due to significant investments in smart infrastructure and a well-established ecosystem of technology providers. Government institutions represent the largest application segment, accounting for an estimated 35% of the market share, followed by Malls & Stadiums at approximately 25%.
Key drivers of this dominance include:
- Economic Policies: Favorable government funding for smart city projects and urban infrastructure upgrades.
- Infrastructure Development: Significant investment in modernizing parking facilities and deploying intelligent traffic management systems.
- Technological Advancement: Early adoption and widespread integration of IoT, AI, and cloud-based solutions in parking management.
- Regulatory Support: Policies encouraging the development and implementation of smart parking technologies to alleviate urban congestion.
- Consumer Demand: A high level of consumer expectation for convenience, efficiency, and cashless payment options in parking.
Within the "Type" segment, Parking Kiosks (Multi Space) are witnessing accelerated growth, accounting for roughly 60% of the market share compared to Single Space Parking Meters (approximately 40%). This trend is attributed to their ability to manage multiple parking bays efficiently, reduce the number of physical units required, and offer a wider range of payment and information services. The market share for parking kiosks is projected to grow at a CAGR of 9.2% during the forecast period.
- Dominant Region: North America.
- Leading Country: United States.
- Largest Application Segment: Government Institutions (estimated 35% market share).
- Second Largest Application Segment: Malls & Stadiums (estimated 25% market share).
- Dominant Type Segment: Parking Kiosks (Multi Space) (estimated 60% market share).
- Growth Potential: High, driven by smart city initiatives and demand for integrated solutions.
Parking Meters Product Landscape
The parking meters product landscape is characterized by rapid innovation, moving beyond basic coin-operated mechanisms to sophisticated digital solutions. Key product innovations include the integration of solar power for energy efficiency, advanced sensor technologies for real-time occupancy detection, and NFC/QR code payment capabilities. Smart parking meters now offer features like remote management, dynamic pricing, and integration with municipal payment platforms, enhancing operational efficiency and user experience. Performance metrics are measured by uptime, accuracy of occupancy detection (exceeding 98%), and data security. Unique selling propositions lie in their ability to reduce manual enforcement, optimize parking space utilization, and generate valuable data analytics for urban planning. Technologically advanced parking kiosks, often incorporating large touchscreens and multilingual support, are emerging as central hubs for parking payment and information dissemination, significantly improving the urban parking experience.
Key Drivers, Barriers & Challenges in Parking Meters
Key Drivers:
- Smart City Initiatives: Government mandates and funding for intelligent urban infrastructure.
- Urbanization and Vehicle Growth: Increasing population density and car ownership necessitate efficient parking management.
- Technological Advancements: IoT, AI, and cloud computing enable smarter, more connected parking solutions.
- Demand for Convenience: Consumers prefer seamless, cashless payment options and real-time information.
- Revenue Generation: Municipalities seek to optimize parking revenue and enforcement.
Barriers & Challenges:
- High Initial Investment: The cost of deploying advanced smart parking systems can be substantial, estimated to be 20-30% higher than traditional meters.
- Cybersecurity Threats: Protecting sensitive payment and user data from breaches is paramount.
- Integration Complexities: Seamless integration with existing city infrastructure and diverse payment gateways can be challenging.
- Regulatory Hurdles: Varying local regulations and data privacy laws can create implementation complexities.
- Public Acceptance and Training: Ensuring user adoption and understanding of new technologies.
- Supply Chain Disruptions: Global events can impact the availability and cost of electronic components.
Emerging Opportunities in Parking Meters
Emerging opportunities in the parking meters sector lie in the expansion of integrated smart city solutions, where parking management becomes a seamless part of a larger urban ecosystem. The growing demand for electric vehicle (EV) charging infrastructure presents a significant opportunity to embed charging stations within smart parking meters and kiosks. Furthermore, the application of AI for predictive parking analytics, anticipating demand and optimizing space allocation, is a rapidly evolving area. Untapped markets in developing economies, as they urbanize and invest in smart infrastructure, offer substantial growth potential. Innovative payment models, such as subscription-based parking services and dynamic pricing based on real-time demand, are also gaining traction. The "Others" application segment, encompassing areas like university campuses and private commercial lots, is also witnessing increased adoption of smart parking solutions.
Growth Accelerators in the Parking Meters Industry
Several key growth accelerators are propelling the parking meters industry forward. The relentless pace of technological innovation, particularly in IoT connectivity and data analytics, is a primary driver. Strategic partnerships between parking technology providers, municipalities, and mobility service providers are fostering integrated solutions and expanding market reach. Market expansion strategies, including entry into emerging economies and catering to niche segments like healthcare facilities and transit hubs, are crucial for long-term growth. The increasing focus on sustainability and reducing carbon footprints in urban areas is also driving demand for smart parking solutions that optimize traffic flow and reduce idling times.
Key Players Shaping the Parking Meters Market
- Flowbird
- POM
- T2 Systems
- Hectronic
- MacKay Meters
- METRIC Group
- IPS Group
- Viatron
- IEM
- Ventek International
- CivicSmart
- Parking BOXX
- LocoMobi
- Horoad Electronic
- Kinouwell Tech
Notable Milestones in Parking Meters Sector
- 2020: Widespread adoption of contactless payment options due to public health concerns.
- 2021: Increased integration of AI for predictive parking analytics and traffic flow optimization.
- 2022: Launch of comprehensive smart city parking management platforms by several key players.
- 2023: Significant growth in the deployment of solar-powered and energy-efficient parking meters.
- 2024: Expansion of integrated EV charging and parking solutions in major urban centers.
In-Depth Parking Meters Market Outlook
The future of the parking meters market is exceptionally bright, characterized by continued technological integration and strategic market expansion. Growth accelerators, including the pervasive adoption of IoT and AI, alongside strategic collaborations, will fuel sustained expansion. Emerging opportunities in integrated smart city infrastructure, EV charging, and data-driven urban planning present vast untapped potential. The industry is projected to experience significant growth, driven by an unwavering demand for efficient, convenient, and sustainable urban mobility solutions. Stakeholders can anticipate a dynamic market with continuous innovation, leading to more connected and intelligent parking experiences.
Parking Meters Segmentation
-
1. Application
- 1.1. Government Institutions
- 1.2. Hospitals
- 1.3. Parks
- 1.4. Transit Systems
- 1.5. Malls & Stadiums
- 1.6. Others
-
2. Type
- 2.1. Parking Meter (Single Space)
- 2.2. Parking Kiosks (Multi Space)
Parking Meters Segmentation By Geography
-
1. North America
- 1.1. United States
- 1.2. Canada
- 1.3. Mexico
-
2. South America
- 2.1. Brazil
- 2.2. Argentina
- 2.3. Rest of South America
-
3. Europe
- 3.1. United Kingdom
- 3.2. Germany
- 3.3. France
- 3.4. Italy
- 3.5. Spain
- 3.6. Russia
- 3.7. Benelux
- 3.8. Nordics
- 3.9. Rest of Europe
-
4. Middle East & Africa
- 4.1. Turkey
- 4.2. Israel
- 4.3. GCC
- 4.4. North Africa
- 4.5. South Africa
- 4.6. Rest of Middle East & Africa
-
5. Asia Pacific
- 5.1. China
- 5.2. India
- 5.3. Japan
- 5.4. South Korea
- 5.5. ASEAN
- 5.6. Oceania
- 5.7. Rest of Asia Pacific

Parking Meters REPORT HIGHLIGHTS
| Aspects | Details |
|---|---|
| Study Period | 2019-2033 |
| Base Year | 2024 |
| Estimated Year | 2025 |
| Forecast Period | 2025-2033 |
| Historical Period | 2019-2024 |
| Growth Rate | CAGR of 6% from 2019-2033 |
| Segmentation |
|
Table of Contents
- 1. Introduction
- 1.1. Research Scope
- 1.2. Market Segmentation
- 1.3. Research Methodology
- 1.4. Definitions and Assumptions
- 2. Executive Summary
- 2.1. Introduction
- 3. Market Dynamics
- 3.1. Introduction
- 3.2. Market Drivers
- 3.3. Market Restrains
- 3.4. Market Trends
- 4. Market Factor Analysis
- 4.1. Porters Five Forces
- 4.2. Supply/Value Chain
- 4.3. PESTEL analysis
- 4.4. Market Entropy
- 4.5. Patent/Trademark Analysis
- 5. Global Parking Meters Analysis, Insights and Forecast, 2019-2031
- 5.1. Market Analysis, Insights and Forecast - by Application
- 5.1.1. Government Institutions
- 5.1.2. Hospitals
- 5.1.3. Parks
- 5.1.4. Transit Systems
- 5.1.5. Malls & Stadiums
- 5.1.6. Others
- 5.2. Market Analysis, Insights and Forecast - by Type
- 5.2.1. Parking Meter (Single Space)
- 5.2.2. Parking Kiosks (Multi Space)
- 5.3. Market Analysis, Insights and Forecast - by Region
- 5.3.1. North America
- 5.3.2. South America
- 5.3.3. Europe
- 5.3.4. Middle East & Africa
- 5.3.5. Asia Pacific
- 5.1. Market Analysis, Insights and Forecast - by Application
- 6. North America Parking Meters Analysis, Insights and Forecast, 2019-2031
- 6.1. Market Analysis, Insights and Forecast - by Application
- 6.1.1. Government Institutions
- 6.1.2. Hospitals
- 6.1.3. Parks
- 6.1.4. Transit Systems
- 6.1.5. Malls & Stadiums
- 6.1.6. Others
- 6.2. Market Analysis, Insights and Forecast - by Type
- 6.2.1. Parking Meter (Single Space)
- 6.2.2. Parking Kiosks (Multi Space)
- 6.1. Market Analysis, Insights and Forecast - by Application
- 7. South America Parking Meters Analysis, Insights and Forecast, 2019-2031
- 7.1. Market Analysis, Insights and Forecast - by Application
- 7.1.1. Government Institutions
- 7.1.2. Hospitals
- 7.1.3. Parks
- 7.1.4. Transit Systems
- 7.1.5. Malls & Stadiums
- 7.1.6. Others
- 7.2. Market Analysis, Insights and Forecast - by Type
- 7.2.1. Parking Meter (Single Space)
- 7.2.2. Parking Kiosks (Multi Space)
- 7.1. Market Analysis, Insights and Forecast - by Application
- 8. Europe Parking Meters Analysis, Insights and Forecast, 2019-2031
- 8.1. Market Analysis, Insights and Forecast - by Application
- 8.1.1. Government Institutions
- 8.1.2. Hospitals
- 8.1.3. Parks
- 8.1.4. Transit Systems
- 8.1.5. Malls & Stadiums
- 8.1.6. Others
- 8.2. Market Analysis, Insights and Forecast - by Type
- 8.2.1. Parking Meter (Single Space)
- 8.2.2. Parking Kiosks (Multi Space)
- 8.1. Market Analysis, Insights and Forecast - by Application
- 9. Middle East & Africa Parking Meters Analysis, Insights and Forecast, 2019-2031
- 9.1. Market Analysis, Insights and Forecast - by Application
- 9.1.1. Government Institutions
- 9.1.2. Hospitals
- 9.1.3. Parks
- 9.1.4. Transit Systems
- 9.1.5. Malls & Stadiums
- 9.1.6. Others
- 9.2. Market Analysis, Insights and Forecast - by Type
- 9.2.1. Parking Meter (Single Space)
- 9.2.2. Parking Kiosks (Multi Space)
- 9.1. Market Analysis, Insights and Forecast - by Application
- 10. Asia Pacific Parking Meters Analysis, Insights and Forecast, 2019-2031
- 10.1. Market Analysis, Insights and Forecast - by Application
- 10.1.1. Government Institutions
- 10.1.2. Hospitals
- 10.1.3. Parks
- 10.1.4. Transit Systems
- 10.1.5. Malls & Stadiums
- 10.1.6. Others
- 10.2. Market Analysis, Insights and Forecast - by Type
- 10.2.1. Parking Meter (Single Space)
- 10.2.2. Parking Kiosks (Multi Space)
- 10.1. Market Analysis, Insights and Forecast - by Application
- 11. Competitive Analysis
- 11.1. Global Market Share Analysis 2024
- 11.2. Company Profiles
- 11.2.1 Flowbird
- 11.2.1.1. Overview
- 11.2.1.2. Products
- 11.2.1.3. SWOT Analysis
- 11.2.1.4. Recent Developments
- 11.2.1.5. Financials (Based on Availability)
- 11.2.2 POM
- 11.2.2.1. Overview
- 11.2.2.2. Products
- 11.2.2.3. SWOT Analysis
- 11.2.2.4. Recent Developments
- 11.2.2.5. Financials (Based on Availability)
- 11.2.3 T2 Systems
- 11.2.3.1. Overview
- 11.2.3.2. Products
- 11.2.3.3. SWOT Analysis
- 11.2.3.4. Recent Developments
- 11.2.3.5. Financials (Based on Availability)
- 11.2.4 Hectronic
- 11.2.4.1. Overview
- 11.2.4.2. Products
- 11.2.4.3. SWOT Analysis
- 11.2.4.4. Recent Developments
- 11.2.4.5. Financials (Based on Availability)
- 11.2.5 MacKay Meters
- 11.2.5.1. Overview
- 11.2.5.2. Products
- 11.2.5.3. SWOT Analysis
- 11.2.5.4. Recent Developments
- 11.2.5.5. Financials (Based on Availability)
- 11.2.6 METRIC Group
- 11.2.6.1. Overview
- 11.2.6.2. Products
- 11.2.6.3. SWOT Analysis
- 11.2.6.4. Recent Developments
- 11.2.6.5. Financials (Based on Availability)
- 11.2.7 IPS Group
- 11.2.7.1. Overview
- 11.2.7.2. Products
- 11.2.7.3. SWOT Analysis
- 11.2.7.4. Recent Developments
- 11.2.7.5. Financials (Based on Availability)
- 11.2.8 Viatron
- 11.2.8.1. Overview
- 11.2.8.2. Products
- 11.2.8.3. SWOT Analysis
- 11.2.8.4. Recent Developments
- 11.2.8.5. Financials (Based on Availability)
- 11.2.9 IEM
- 11.2.9.1. Overview
- 11.2.9.2. Products
- 11.2.9.3. SWOT Analysis
- 11.2.9.4. Recent Developments
- 11.2.9.5. Financials (Based on Availability)
- 11.2.10 Ventek International
- 11.2.10.1. Overview
- 11.2.10.2. Products
- 11.2.10.3. SWOT Analysis
- 11.2.10.4. Recent Developments
- 11.2.10.5. Financials (Based on Availability)
- 11.2.11 CivicSmart
- 11.2.11.1. Overview
- 11.2.11.2. Products
- 11.2.11.3. SWOT Analysis
- 11.2.11.4. Recent Developments
- 11.2.11.5. Financials (Based on Availability)
- 11.2.12 Parking BOXX
- 11.2.12.1. Overview
- 11.2.12.2. Products
- 11.2.12.3. SWOT Analysis
- 11.2.12.4. Recent Developments
- 11.2.12.5. Financials (Based on Availability)
- 11.2.13 LocoMobi
- 11.2.13.1. Overview
- 11.2.13.2. Products
- 11.2.13.3. SWOT Analysis
- 11.2.13.4. Recent Developments
- 11.2.13.5. Financials (Based on Availability)
- 11.2.14 Horoad Electronic
- 11.2.14.1. Overview
- 11.2.14.2. Products
- 11.2.14.3. SWOT Analysis
- 11.2.14.4. Recent Developments
- 11.2.14.5. Financials (Based on Availability)
- 11.2.15 Kinouwell Tech
- 11.2.15.1. Overview
- 11.2.15.2. Products
- 11.2.15.3. SWOT Analysis
- 11.2.15.4. Recent Developments
- 11.2.15.5. Financials (Based on Availability)
- 11.2.1 Flowbird
List of Figures
- Figure 1: Global Parking Meters Revenue Breakdown (million, %) by Region 2024 & 2032
- Figure 2: North America Parking Meters Revenue (million), by Application 2024 & 2032
- Figure 3: North America Parking Meters Revenue Share (%), by Application 2024 & 2032
- Figure 4: North America Parking Meters Revenue (million), by Type 2024 & 2032
- Figure 5: North America Parking Meters Revenue Share (%), by Type 2024 & 2032
- Figure 6: North America Parking Meters Revenue (million), by Country 2024 & 2032
- Figure 7: North America Parking Meters Revenue Share (%), by Country 2024 & 2032
- Figure 8: South America Parking Meters Revenue (million), by Application 2024 & 2032
- Figure 9: South America Parking Meters Revenue Share (%), by Application 2024 & 2032
- Figure 10: South America Parking Meters Revenue (million), by Type 2024 & 2032
- Figure 11: South America Parking Meters Revenue Share (%), by Type 2024 & 2032
- Figure 12: South America Parking Meters Revenue (million), by Country 2024 & 2032
- Figure 13: South America Parking Meters Revenue Share (%), by Country 2024 & 2032
- Figure 14: Europe Parking Meters Revenue (million), by Application 2024 & 2032
- Figure 15: Europe Parking Meters Revenue Share (%), by Application 2024 & 2032
- Figure 16: Europe Parking Meters Revenue (million), by Type 2024 & 2032
- Figure 17: Europe Parking Meters Revenue Share (%), by Type 2024 & 2032
- Figure 18: Europe Parking Meters Revenue (million), by Country 2024 & 2032
- Figure 19: Europe Parking Meters Revenue Share (%), by Country 2024 & 2032
- Figure 20: Middle East & Africa Parking Meters Revenue (million), by Application 2024 & 2032
- Figure 21: Middle East & Africa Parking Meters Revenue Share (%), by Application 2024 & 2032
- Figure 22: Middle East & Africa Parking Meters Revenue (million), by Type 2024 & 2032
- Figure 23: Middle East & Africa Parking Meters Revenue Share (%), by Type 2024 & 2032
- Figure 24: Middle East & Africa Parking Meters Revenue (million), by Country 2024 & 2032
- Figure 25: Middle East & Africa Parking Meters Revenue Share (%), by Country 2024 & 2032
- Figure 26: Asia Pacific Parking Meters Revenue (million), by Application 2024 & 2032
- Figure 27: Asia Pacific Parking Meters Revenue Share (%), by Application 2024 & 2032
- Figure 28: Asia Pacific Parking Meters Revenue (million), by Type 2024 & 2032
- Figure 29: Asia Pacific Parking Meters Revenue Share (%), by Type 2024 & 2032
- Figure 30: Asia Pacific Parking Meters Revenue (million), by Country 2024 & 2032
- Figure 31: Asia Pacific Parking Meters Revenue Share (%), by Country 2024 & 2032
List of Tables
- Table 1: Global Parking Meters Revenue million Forecast, by Region 2019 & 2032
- Table 2: Global Parking Meters Revenue million Forecast, by Application 2019 & 2032
- Table 3: Global Parking Meters Revenue million Forecast, by Type 2019 & 2032
- Table 4: Global Parking Meters Revenue million Forecast, by Region 2019 & 2032
- Table 5: Global Parking Meters Revenue million Forecast, by Application 2019 & 2032
- Table 6: Global Parking Meters Revenue million Forecast, by Type 2019 & 2032
- Table 7: Global Parking Meters Revenue million Forecast, by Country 2019 & 2032
- Table 8: United States Parking Meters Revenue (million) Forecast, by Application 2019 & 2032
- Table 9: Canada Parking Meters Revenue (million) Forecast, by Application 2019 & 2032
- Table 10: Mexico Parking Meters Revenue (million) Forecast, by Application 2019 & 2032
- Table 11: Global Parking Meters Revenue million Forecast, by Application 2019 & 2032
- Table 12: Global Parking Meters Revenue million Forecast, by Type 2019 & 2032
- Table 13: Global Parking Meters Revenue million Forecast, by Country 2019 & 2032
- Table 14: Brazil Parking Meters Revenue (million) Forecast, by Application 2019 & 2032
- Table 15: Argentina Parking Meters Revenue (million) Forecast, by Application 2019 & 2032
- Table 16: Rest of South America Parking Meters Revenue (million) Forecast, by Application 2019 & 2032
- Table 17: Global Parking Meters Revenue million Forecast, by Application 2019 & 2032
- Table 18: Global Parking Meters Revenue million Forecast, by Type 2019 & 2032
- Table 19: Global Parking Meters Revenue million Forecast, by Country 2019 & 2032
- Table 20: United Kingdom Parking Meters Revenue (million) Forecast, by Application 2019 & 2032
- Table 21: Germany Parking Meters Revenue (million) Forecast, by Application 2019 & 2032
- Table 22: France Parking Meters Revenue (million) Forecast, by Application 2019 & 2032
- Table 23: Italy Parking Meters Revenue (million) Forecast, by Application 2019 & 2032
- Table 24: Spain Parking Meters Revenue (million) Forecast, by Application 2019 & 2032
- Table 25: Russia Parking Meters Revenue (million) Forecast, by Application 2019 & 2032
- Table 26: Benelux Parking Meters Revenue (million) Forecast, by Application 2019 & 2032
- Table 27: Nordics Parking Meters Revenue (million) Forecast, by Application 2019 & 2032
- Table 28: Rest of Europe Parking Meters Revenue (million) Forecast, by Application 2019 & 2032
- Table 29: Global Parking Meters Revenue million Forecast, by Application 2019 & 2032
- Table 30: Global Parking Meters Revenue million Forecast, by Type 2019 & 2032
- Table 31: Global Parking Meters Revenue million Forecast, by Country 2019 & 2032
- Table 32: Turkey Parking Meters Revenue (million) Forecast, by Application 2019 & 2032
- Table 33: Israel Parking Meters Revenue (million) Forecast, by Application 2019 & 2032
- Table 34: GCC Parking Meters Revenue (million) Forecast, by Application 2019 & 2032
- Table 35: North Africa Parking Meters Revenue (million) Forecast, by Application 2019 & 2032
- Table 36: South Africa Parking Meters Revenue (million) Forecast, by Application 2019 & 2032
- Table 37: Rest of Middle East & Africa Parking Meters Revenue (million) Forecast, by Application 2019 & 2032
- Table 38: Global Parking Meters Revenue million Forecast, by Application 2019 & 2032
- Table 39: Global Parking Meters Revenue million Forecast, by Type 2019 & 2032
- Table 40: Global Parking Meters Revenue million Forecast, by Country 2019 & 2032
- Table 41: China Parking Meters Revenue (million) Forecast, by Application 2019 & 2032
- Table 42: India Parking Meters Revenue (million) Forecast, by Application 2019 & 2032
- Table 43: Japan Parking Meters Revenue (million) Forecast, by Application 2019 & 2032
- Table 44: South Korea Parking Meters Revenue (million) Forecast, by Application 2019 & 2032
- Table 45: ASEAN Parking Meters Revenue (million) Forecast, by Application 2019 & 2032
- Table 46: Oceania Parking Meters Revenue (million) Forecast, by Application 2019 & 2032
- Table 47: Rest of Asia Pacific Parking Meters Revenue (million) Forecast, by Application 2019 & 2032
Frequently Asked Questions
1. What is the projected Compound Annual Growth Rate (CAGR) of the Parking Meters?
The projected CAGR is approximately 6%.
2. Which companies are prominent players in the Parking Meters?
Key companies in the market include Flowbird, POM, T2 Systems, Hectronic, MacKay Meters, METRIC Group, IPS Group, Viatron, IEM, Ventek International, CivicSmart, Parking BOXX, LocoMobi, Horoad Electronic, Kinouwell Tech.
3. What are the main segments of the Parking Meters?
The market segments include Application, Type.
4. Can you provide details about the market size?
The market size is estimated to be USD 9187 million as of 2022.
5. What are some drivers contributing to market growth?
N/A
6. What are the notable trends driving market growth?
N/A
7. Are there any restraints impacting market growth?
N/A
8. Can you provide examples of recent developments in the market?
N/A
9. What pricing options are available for accessing the report?
Pricing options include single-user, multi-user, and enterprise licenses priced at USD 2900.00, USD 4350.00, and USD 5800.00 respectively.
10. Is the market size provided in terms of value or volume?
The market size is provided in terms of value, measured in million.
11. Are there any specific market keywords associated with the report?
Yes, the market keyword associated with the report is "Parking Meters," which aids in identifying and referencing the specific market segment covered.
12. How do I determine which pricing option suits my needs best?
The pricing options vary based on user requirements and access needs. Individual users may opt for single-user licenses, while businesses requiring broader access may choose multi-user or enterprise licenses for cost-effective access to the report.
13. Are there any additional resources or data provided in the Parking Meters report?
While the report offers comprehensive insights, it's advisable to review the specific contents or supplementary materials provided to ascertain if additional resources or data are available.
14. How can I stay updated on further developments or reports in the Parking Meters?
To stay informed about further developments, trends, and reports in the Parking Meters, consider subscribing to industry newsletters, following relevant companies and organizations, or regularly checking reputable industry news sources and publications.
Methodology
Step 1 - Identification of Relevant Samples Size from Population Database


Step 2 - Approaches for Defining Global Market Size (Value, Volume* & Price*)

Note*: In applicable scenarios
Step 3 - Data Sources
Primary Research
- Web Analytics
- Survey Reports
- Research Institute
- Latest Research Reports
- Opinion Leaders
Secondary Research
- Annual Reports
- White Paper
- Latest Press Release
- Industry Association
- Paid Database
- Investor Presentations

Step 4 - Data Triangulation
Involves using different sources of information in order to increase the validity of a study
These sources are likely to be stakeholders in a program - participants, other researchers, program staff, other community members, and so on.
Then we put all data in single framework & apply various statistical tools to find out the dynamic on the market.
During the analysis stage, feedback from the stakeholder groups would be compared to determine areas of agreement as well as areas of divergence


