

Key Insights
The Indian commercial vehicle industry is projected to experience substantial growth, fueled by strong economic expansion and rising demand across diverse sectors. The market is estimated at $50.58 billion with a Compound Annual Growth Rate (CAGR) of 5.24%. This dynamism is attributed to significant infrastructure investments, the booming e-commerce sector's demand for efficient logistics, and government initiatives supporting domestic manufacturing and sustainable mobility. The increasing adoption of Electric Vehicles (EVs) and Hybrid Electric Vehicles (HEVs) is a key trend, aligning with environmental objectives and offering long-term operational cost advantages. Furthermore, expanding fleet requirements for both heavy-duty trucks and light commercial vehicles are driving consistent demand.
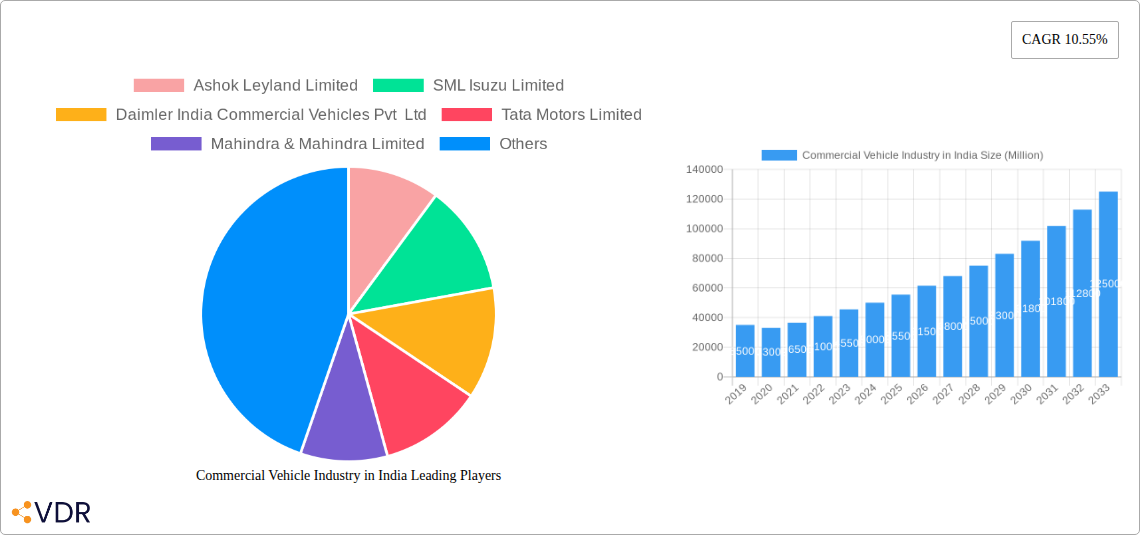
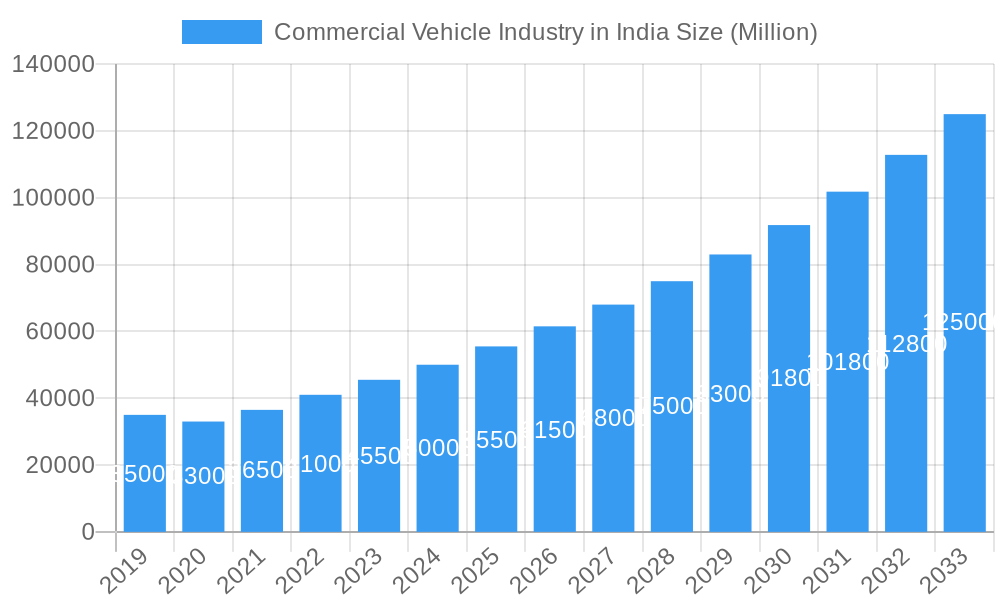
Commercial Vehicle Industry in India Market Size (In Billion)
Key market restraints include volatile fuel prices, the initial capital outlay for advanced technologies like EVs, and evolving regulatory frameworks requiring continuous adaptation. Despite these hurdles, the industry is actively innovating through technological advancements and strategic collaborations. Leading manufacturers are investing significantly in research and development for electric and alternative fuel powertrains. The market is segmented by vehicle type, with a notable focus on both heavy-duty trucks and light commercial vehicles to meet varied logistical needs. Geographically, the Asia Pacific region, especially India, is a critical market, anticipated to lead sales due to its rapidly expanding economy and large consumer base. This analysis covers the period from 2019 to 2033, with the 2024 base year and a forecast through 2033, providing a comprehensive long-term outlook.
Commercial Vehicle Industry in India Company Market Share
Commercial Vehicle Industry in India: Market Dynamics, Growth Trends, and Future Outlook (2019-2033)
Gain a comprehensive understanding of the rapidly evolving Indian Commercial Vehicle (CV) market. This in-depth report, covering the period from 2019 to 2033 with a base and estimated year of 2025, provides critical insights into market dynamics, growth trends, dominant segments, product landscape, key players, and future opportunities. Analyze the impact of new technologies, regulatory frameworks, and shifting consumer preferences on the Indian CV market, including light commercial vehicles (LCVs), heavy-duty trucks, and buses. Discover critical data on market size evolution, adoption rates, and the burgeoning electric commercial vehicle (e-CV) segment.
This report is an essential resource for manufacturers, suppliers, investors, and policymakers looking to navigate the dynamic India automotive industry and capitalize on the immense potential within the commercial vehicle sector. With a focus on India's truck market, bus market, and the rise of electric trucks India and electric buses India, this analysis offers actionable intelligence for strategic decision-making.
Commercial Vehicle Industry in India Market Dynamics & Structure
The Indian Commercial Vehicle industry exhibits a moderately concentrated market structure, with a few dominant players controlling a significant share. Technological innovation is a primary driver, fueled by increasing demand for fuel efficiency, reduced emissions, and enhanced connectivity. Regulatory frameworks, such as stricter emission norms and government initiatives promoting electric mobility, are continuously reshaping the market landscape. Competitive product substitutes are emerging, particularly in the form of electric and hybrid powertrains, posing a challenge to traditional Internal Combustion Engine (ICE) vehicles. End-user demographics are shifting, with a growing demand for customized solutions and advanced features from logistics companies, fleet operators, and small and medium enterprises (SMEs). Mergers & Acquisitions (M&A) trends, while not as rampant as in some mature markets, are observed as companies seek to expand their product portfolios, gain market access, and achieve economies of scale.
- Market Concentration: Dominated by key manufacturers like Tata Motors Limited and Mahindra & Mahindra Limited.
- Technological Innovation Drivers: Focus on electrification, telematics, autonomous driving features, and fuel-efficient ICE technologies.
- Regulatory Frameworks: Bharat Stage VI (BS-VI) emission standards, Production Linked Incentive (PLI) schemes for the automotive sector, and government mandates for electric vehicle adoption.
- Competitive Product Substitutes: Increasing penetration of electric buses, light commercial vans, and plans for electric heavy-duty trucks.
- End-User Demographics: Growing preference for payload optimization, driver comfort, safety features, and fleet management solutions.
- M&A Trends: Strategic partnerships and joint ventures to leverage technological expertise and expand market reach.
Commercial Vehicle Industry in India Growth Trends & Insights
The Indian Commercial Vehicle market is poised for robust growth, driven by a confluence of factors including economic expansion, infrastructure development, and evolving logistics needs. The market size is projected to witness a significant upward trajectory over the forecast period (2025-2033), with a Compound Annual Growth Rate (CAGR) expected to be substantial. Adoption rates for advanced vehicle technologies are accelerating, particularly for electric and hybrid powertrains, influenced by government incentives and a growing environmental consciousness. Technological disruptions, such as the integration of Artificial Intelligence (AI) for route optimization and predictive maintenance, are enhancing operational efficiency for fleet operators. Consumer behavior is shifting towards a greater emphasis on total cost of ownership (TCO), vehicle uptime, and sustainability. The historical period (2019-2024) has seen steady recovery and adaptation to new emission norms, setting a strong foundation for future expansion. The Indian truck market and India bus market are key contributors to this growth, with significant demand emanating from the e-commerce, retail, and construction sectors. The market penetration of electric commercial vehicles in India is expected to surge, transforming the propulsion type landscape.
Dominant Regions, Countries, or Segments in Commercial Vehicle Industry in India
The Indian Commercial Vehicle industry is primarily driven by the Heavy-duty Commercial Trucks segment, accounting for a significant portion of the market share due to the burgeoning logistics and infrastructure development needs of the country. This dominance is further amplified by the continuous demand for transporting raw materials, finished goods, and construction materials across vast distances. The Buses segment also plays a crucial role, with growing demand from public transportation authorities and private operators seeking to upgrade their fleets for improved passenger comfort and efficiency.
- Heavy-duty Commercial Trucks: This segment's dominance is propelled by robust economic activity, government investments in infrastructure projects like highways and expressways, and the expansion of the e-commerce sector, which necessitates efficient long-haul transportation. Market share for heavy-duty trucks is estimated to be around 60% of the total CV market.
- Buses: The increasing urbanization, focus on public transportation, and the deployment of electric buses under government schemes are key growth drivers. Orders for both intercity and intra-city buses are substantial, contributing significantly to the overall CV volume.
- Light Commercial Pick-up Trucks: These vehicles are vital for last-mile delivery and cater to the needs of small businesses and entrepreneurs, exhibiting steady growth fueled by the retail sector and the rise of small and medium enterprises (SMEs).
- Light Commercial Vans: Similar to pick-up trucks, light commercial vans are crucial for urban logistics and last-mile distribution, experiencing a surge in demand due to the e-commerce boom.
- Propulsion Type: ICE(Diesel, CNG): While ICE (Internal Combustion Engine) vehicles, particularly diesel and CNG, continue to dominate the current market due to established infrastructure and lower upfront costs, the landscape is rapidly shifting.
- Propulsion Type: Hybrid and Electric Vehicles: The Hybrid and Electric Vehicles segment, encompassing BEV (Battery Electric Vehicle), FCEV (Fuel Cell Electric Vehicle), HEV (Hybrid Electric Vehicle), and PHEV (Plug-in Hybrid Electric Vehicle), is the fastest-growing. Government incentives, environmental regulations, and declining battery costs are accelerating the adoption of electric trucks and electric buses. The growth potential for electric CVs is immense, with projections indicating a significant market share by 2033.
Commercial Vehicle Industry in India Product Landscape
The Indian Commercial Vehicle industry is witnessing a wave of product innovations focused on enhancing fuel efficiency, safety, and sustainability. Manufacturers are increasingly integrating advanced telematics and connectivity features, enabling real-time vehicle tracking, performance monitoring, and predictive maintenance. The emphasis is on developing vehicles that offer a lower total cost of ownership (TCO) through improved fuel economy and reduced downtime. For electric vehicles, advancements in battery technology, charging infrastructure, and powertrain efficiency are crucial differentiators. Unique selling propositions revolve around rugged designs for diverse Indian road conditions, enhanced driver comfort features, and the development of specialized vehicles for niche applications such as refrigeration or waste management.
Key Drivers, Barriers & Challenges in Commercial Vehicle Industry in India
Key Drivers:
- Economic Growth and Infrastructure Development: Robust GDP growth and government investment in roads, ports, and logistics infrastructure stimulate demand for commercial vehicles.
- E-commerce and Retail Expansion: The burgeoning e-commerce sector necessitates a larger and more efficient fleet for last-mile delivery and intercity logistics.
- Government Initiatives and Policy Support: Favorable policies, subsidies for electric vehicles, and stricter emission norms (e.g., BS-VI) are driving technological adoption and fleet modernization.
- Technological Advancements: Development of fuel-efficient engines, electric powertrains, and telematics solutions improve operational efficiency and reduce costs.
Key Barriers & Challenges:
- High Upfront Cost of Electric Vehicles: Despite incentives, the initial purchase price of electric commercial vehicles remains a significant barrier for many fleet operators.
- Inadequate Charging Infrastructure: The limited availability of fast-charging stations, especially in semi-urban and rural areas, hinders the widespread adoption of EVs.
- Supply Chain Disruptions: Global and domestic supply chain issues, particularly for critical components like semiconductors and batteries, can impact production volumes and timelines.
- Fluctuating Fuel Prices: Volatility in diesel and gasoline prices can impact operational costs for ICE vehicles, affecting fleet profitability.
- Skilled Workforce Shortage: A lack of trained personnel for the maintenance and repair of advanced and electric vehicle technologies poses a challenge.
Emerging Opportunities in Commercial Vehicle Industry in India
Emerging opportunities in the Indian CV market lie in the rapid expansion of the electric commercial vehicle (e-CV) segment, driven by government targets and increasing corporate sustainability goals. Untapped markets exist in specialized logistics solutions for perishable goods and temperature-sensitive cargo, requiring refrigerated commercial vehicles. The growth of the ride-sharing and rental market for commercial vehicles also presents new application avenues. Furthermore, the development of integrated fleet management solutions, leveraging IoT and AI, offers significant potential for enhancing operational efficiency and reducing TCO for fleet operators. The increasing focus on last-mile delivery solutions within urban centers also presents a strong opportunity for light commercial vans and electric three-wheelers.
Growth Accelerators in the Commercial Vehicle Industry in India Industry
Key growth accelerators for the Indian Commercial Vehicle industry include breakthroughs in battery technology that promise longer range and faster charging for electric vehicles. Strategic partnerships between vehicle manufacturers, component suppliers, and technology providers are crucial for co-developing innovative solutions and expanding market reach. Market expansion strategies, such as introducing new vehicle models tailored to specific regional needs and offering flexible financing options, will further boost sales. The increasing adoption of connected vehicle technologies and data analytics will unlock new revenue streams and improve fleet management capabilities, acting as significant growth catalysts.
Key Players Shaping the Commercial Vehicle Industry in India Market
- Ashok Leyland Limited
- SML Isuzu Limited
- Daimler India Commercial Vehicles Pvt Ltd
- Tata Motors Limited
- Mahindra & Mahindra Limited
- Eicher Motors Ltd
- VE Commercial Vehicles Limited
- Asia Motor Works Limited
- Force Motors Ltd
- Volvo Buses India Private Limited
Notable Milestones in Commercial Vehicle Industry in India Sector
- August 2023: Eicher Trucks and Buses, a division of VE Commercial Vehicles Ltd, announced a partnership with Amazon to electrify the middle-mile and last-mile delivery processes for the e-commerce giant in India. This collaboration signals a significant step towards the widespread adoption of electric trucks in India.
- August 2023: Ve Commercial Vehicles Limited announced an order for 550 Intercity Buses from Vijayan Travels and VT, worth INR 5 billion. The order comprises 500 Eicher Intercity 13.5m AC and non-AC sleeper coaches and 50 Volvo 9600 luxury sleeper coaches, highlighting strong demand in the premium bus segment.
- April 2023: Tata Elxsi signed a Memorandum of Understanding (MoU) with the Indian Institute of Technology, Guwahati (IIT-G) to jointly work on developing and commercializing state-of-the-art solutions for the electric mobility market. This partnership aims to foster innovation in electric vehicle technology and accelerate its adoption in India.
In-Depth Commercial Vehicle Industry in India Market Outlook
The Indian Commercial Vehicle market outlook is exceptionally positive, driven by a strong confluence of economic growth, government support for electrification, and evolving logistics demands. The accelerated adoption of electric commercial vehicles is poised to be a primary growth engine, transforming the India CV market landscape. Strategic partnerships and continued technological innovation in battery technology, charging infrastructure, and vehicle efficiency will further fuel this transition. The increasing demand for specialized commercial vehicles and integrated fleet management solutions presents significant untapped potential. By focusing on sustainability, operational efficiency, and customer-centric product development, stakeholders can effectively capitalize on the substantial growth opportunities anticipated in the coming years, solidifying India's position as a global leader in the commercial vehicle sector.
Commercial Vehicle Industry in India Segmentation
-
1. Vehicle Body Type
- 1.1. Buses
- 1.2. Heavy-duty Commercial Trucks
- 1.3. Light Commercial Pick-up Trucks
- 1.4. Light Commercial Vans
-
2. Propulsion Type
-
2.1. Hybrid and Electric Vehicles
-
2.1.1. By Fuel Category
- 2.1.1.1. BEV
- 2.1.1.2. FCEV
- 2.1.1.3. HEV
- 2.1.1.4. PHEV
-
2.1.1. By Fuel Category
-
2.2. ICE
- 2.2.1. CNG
- 2.2.2. Diesel
- 2.2.3. Gasoline
- 2.2.4. LPG
-
2.1. Hybrid and Electric Vehicles
Commercial Vehicle Industry in India Segmentation By Geography
-
1. North America
- 1.1. United States
- 1.2. Canada
- 1.3. Mexico
-
2. South America
- 2.1. Brazil
- 2.2. Argentina
- 2.3. Rest of South America
-
3. Europe
- 3.1. United Kingdom
- 3.2. Germany
- 3.3. France
- 3.4. Italy
- 3.5. Spain
- 3.6. Russia
- 3.7. Benelux
- 3.8. Nordics
- 3.9. Rest of Europe
-
4. Middle East & Africa
- 4.1. Turkey
- 4.2. Israel
- 4.3. GCC
- 4.4. North Africa
- 4.5. South Africa
- 4.6. Rest of Middle East & Africa
-
5. Asia Pacific
- 5.1. China
- 5.2. India
- 5.3. Japan
- 5.4. South Korea
- 5.5. ASEAN
- 5.6. Oceania
- 5.7. Rest of Asia Pacific
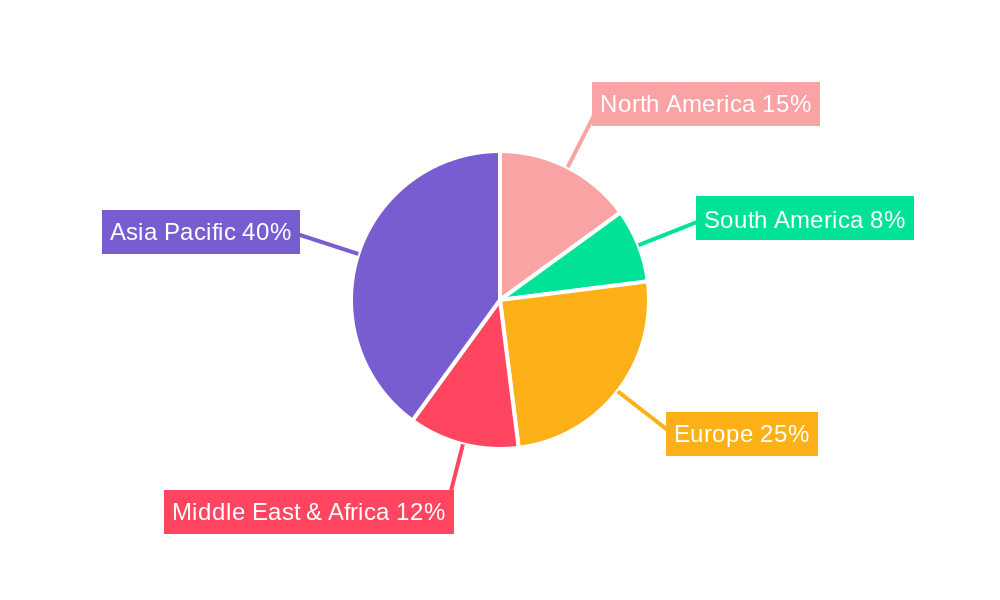
Commercial Vehicle Industry in India Regional Market Share
Geographic Coverage of Commercial Vehicle Industry in India
Commercial Vehicle Industry in India REPORT HIGHLIGHTS
| Aspects | Details |
|---|---|
| Study Period | 2020-2034 |
| Base Year | 2025 |
| Estimated Year | 2026 |
| Forecast Period | 2026-2034 |
| Historical Period | 2020-2025 |
| Growth Rate | CAGR of 5.24% from 2020-2034 |
| Segmentation |
|
Table of Contents
- 1. Introduction
- 1.1. Research Scope
- 1.2. Market Segmentation
- 1.3. Research Objective
- 1.4. Definitions and Assumptions
- 2. Executive Summary
- 2.1. Market Snapshot
- 3. Market Dynamics
- 3.1. Market Drivers
- 3.2. Market Restrains
- 3.3. Market Trends
- 3.4. Market Opportunities
- 4. Market Factor Analysis
- 4.1. Porters Five Forces
- 4.1.1. Bargaining Power of Suppliers
- 4.1.2. Bargaining Power of Buyers
- 4.1.3. Threat of New Entrants
- 4.1.4. Threat of Substitutes
- 4.1.5. Competitive Rivalry
- 4.2. PESTEL analysis
- 4.3. BCG Analysis
- 4.3.1. Stars (High Growth, High Market Share)
- 4.3.2. Cash Cows (Low Growth, High Market Share)
- 4.3.3. Question Mark (High Growth, Low Market Share)
- 4.3.4. Dogs (Low Growth, Low Market Share)
- 4.4. Ansoff Matrix Analysis
- 4.5. Supply Chain Analysis
- 4.6. Regulatory Landscape
- 4.7. Current Market Potential and Opportunity Assessment (TAM–SAM–SOM Framework)
- 4.8. VDR Analyst Note
- 4.1. Porters Five Forces
- 5. Market Analysis, Insights and Forecast 2021-2033
- 5.1. Market Analysis, Insights and Forecast - by Vehicle Body Type
- 5.1.1. Buses
- 5.1.2. Heavy-duty Commercial Trucks
- 5.1.3. Light Commercial Pick-up Trucks
- 5.1.4. Light Commercial Vans
- 5.2. Market Analysis, Insights and Forecast - by Propulsion Type
- 5.2.1. Hybrid and Electric Vehicles
- 5.2.1.1. By Fuel Category
- 5.2.1.1.1. BEV
- 5.2.1.1.2. FCEV
- 5.2.1.1.3. HEV
- 5.2.1.1.4. PHEV
- 5.2.1.1. By Fuel Category
- 5.2.2. ICE
- 5.2.2.1. CNG
- 5.2.2.2. Diesel
- 5.2.2.3. Gasoline
- 5.2.2.4. LPG
- 5.2.1. Hybrid and Electric Vehicles
- 5.3. Market Analysis, Insights and Forecast - by Region
- 5.3.1. North America
- 5.3.2. South America
- 5.3.3. Europe
- 5.3.4. Middle East & Africa
- 5.3.5. Asia Pacific
- 5.1. Market Analysis, Insights and Forecast - by Vehicle Body Type
- 6. Global Commercial Vehicle Industry in India Analysis, Insights and Forecast, 2021-2033
- 6.1. Market Analysis, Insights and Forecast - by Vehicle Body Type
- 6.1.1. Buses
- 6.1.2. Heavy-duty Commercial Trucks
- 6.1.3. Light Commercial Pick-up Trucks
- 6.1.4. Light Commercial Vans
- 6.2. Market Analysis, Insights and Forecast - by Propulsion Type
- 6.2.1. Hybrid and Electric Vehicles
- 6.2.1.1. By Fuel Category
- 6.2.1.1.1. BEV
- 6.2.1.1.2. FCEV
- 6.2.1.1.3. HEV
- 6.2.1.1.4. PHEV
- 6.2.1.1. By Fuel Category
- 6.2.2. ICE
- 6.2.2.1. CNG
- 6.2.2.2. Diesel
- 6.2.2.3. Gasoline
- 6.2.2.4. LPG
- 6.2.1. Hybrid and Electric Vehicles
- 6.1. Market Analysis, Insights and Forecast - by Vehicle Body Type
- 7. North America Commercial Vehicle Industry in India Analysis, Insights and Forecast, 2021-2033
- 7.1. Market Analysis, Insights and Forecast - by Vehicle Body Type
- 7.1.1. Buses
- 7.1.2. Heavy-duty Commercial Trucks
- 7.1.3. Light Commercial Pick-up Trucks
- 7.1.4. Light Commercial Vans
- 7.2. Market Analysis, Insights and Forecast - by Propulsion Type
- 7.2.1. Hybrid and Electric Vehicles
- 7.2.1.1. By Fuel Category
- 7.2.1.1.1. BEV
- 7.2.1.1.2. FCEV
- 7.2.1.1.3. HEV
- 7.2.1.1.4. PHEV
- 7.2.1.1. By Fuel Category
- 7.2.2. ICE
- 7.2.2.1. CNG
- 7.2.2.2. Diesel
- 7.2.2.3. Gasoline
- 7.2.2.4. LPG
- 7.2.1. Hybrid and Electric Vehicles
- 7.1. Market Analysis, Insights and Forecast - by Vehicle Body Type
- 8. South America Commercial Vehicle Industry in India Analysis, Insights and Forecast, 2021-2033
- 8.1. Market Analysis, Insights and Forecast - by Vehicle Body Type
- 8.1.1. Buses
- 8.1.2. Heavy-duty Commercial Trucks
- 8.1.3. Light Commercial Pick-up Trucks
- 8.1.4. Light Commercial Vans
- 8.2. Market Analysis, Insights and Forecast - by Propulsion Type
- 8.2.1. Hybrid and Electric Vehicles
- 8.2.1.1. By Fuel Category
- 8.2.1.1.1. BEV
- 8.2.1.1.2. FCEV
- 8.2.1.1.3. HEV
- 8.2.1.1.4. PHEV
- 8.2.1.1. By Fuel Category
- 8.2.2. ICE
- 8.2.2.1. CNG
- 8.2.2.2. Diesel
- 8.2.2.3. Gasoline
- 8.2.2.4. LPG
- 8.2.1. Hybrid and Electric Vehicles
- 8.1. Market Analysis, Insights and Forecast - by Vehicle Body Type
- 9. Europe Commercial Vehicle Industry in India Analysis, Insights and Forecast, 2021-2033
- 9.1. Market Analysis, Insights and Forecast - by Vehicle Body Type
- 9.1.1. Buses
- 9.1.2. Heavy-duty Commercial Trucks
- 9.1.3. Light Commercial Pick-up Trucks
- 9.1.4. Light Commercial Vans
- 9.2. Market Analysis, Insights and Forecast - by Propulsion Type
- 9.2.1. Hybrid and Electric Vehicles
- 9.2.1.1. By Fuel Category
- 9.2.1.1.1. BEV
- 9.2.1.1.2. FCEV
- 9.2.1.1.3. HEV
- 9.2.1.1.4. PHEV
- 9.2.1.1. By Fuel Category
- 9.2.2. ICE
- 9.2.2.1. CNG
- 9.2.2.2. Diesel
- 9.2.2.3. Gasoline
- 9.2.2.4. LPG
- 9.2.1. Hybrid and Electric Vehicles
- 9.1. Market Analysis, Insights and Forecast - by Vehicle Body Type
- 10. Middle East & Africa Commercial Vehicle Industry in India Analysis, Insights and Forecast, 2021-2033
- 10.1. Market Analysis, Insights and Forecast - by Vehicle Body Type
- 10.1.1. Buses
- 10.1.2. Heavy-duty Commercial Trucks
- 10.1.3. Light Commercial Pick-up Trucks
- 10.1.4. Light Commercial Vans
- 10.2. Market Analysis, Insights and Forecast - by Propulsion Type
- 10.2.1. Hybrid and Electric Vehicles
- 10.2.1.1. By Fuel Category
- 10.2.1.1.1. BEV
- 10.2.1.1.2. FCEV
- 10.2.1.1.3. HEV
- 10.2.1.1.4. PHEV
- 10.2.1.1. By Fuel Category
- 10.2.2. ICE
- 10.2.2.1. CNG
- 10.2.2.2. Diesel
- 10.2.2.3. Gasoline
- 10.2.2.4. LPG
- 10.2.1. Hybrid and Electric Vehicles
- 10.1. Market Analysis, Insights and Forecast - by Vehicle Body Type
- 11. Asia Pacific Commercial Vehicle Industry in India Analysis, Insights and Forecast, 2021-2033
- 11.1. Market Analysis, Insights and Forecast - by Vehicle Body Type
- 11.1.1. Buses
- 11.1.2. Heavy-duty Commercial Trucks
- 11.1.3. Light Commercial Pick-up Trucks
- 11.1.4. Light Commercial Vans
- 11.2. Market Analysis, Insights and Forecast - by Propulsion Type
- 11.2.1. Hybrid and Electric Vehicles
- 11.2.1.1. By Fuel Category
- 11.2.1.1.1. BEV
- 11.2.1.1.2. FCEV
- 11.2.1.1.3. HEV
- 11.2.1.1.4. PHEV
- 11.2.1.1. By Fuel Category
- 11.2.2. ICE
- 11.2.2.1. CNG
- 11.2.2.2. Diesel
- 11.2.2.3. Gasoline
- 11.2.2.4. LPG
- 11.2.1. Hybrid and Electric Vehicles
- 11.1. Market Analysis, Insights and Forecast - by Vehicle Body Type
- 12. Competitive Analysis
- 12.1. Company Profiles
- 12.1.1 Ashok Leyland Limited
- 12.1.1.1. Company Overview
- 12.1.1.2. Products
- 12.1.1.3. Company Financials
- 12.1.1.4. SWOT Analysis
- 12.1.2 SML Isuzu Limited
- 12.1.2.1. Company Overview
- 12.1.2.2. Products
- 12.1.2.3. Company Financials
- 12.1.2.4. SWOT Analysis
- 12.1.3 Daimler India Commercial Vehicles Pvt Ltd
- 12.1.3.1. Company Overview
- 12.1.3.2. Products
- 12.1.3.3. Company Financials
- 12.1.3.4. SWOT Analysis
- 12.1.4 Tata Motors Limited
- 12.1.4.1. Company Overview
- 12.1.4.2. Products
- 12.1.4.3. Company Financials
- 12.1.4.4. SWOT Analysis
- 12.1.5 Mahindra & Mahindra Limited
- 12.1.5.1. Company Overview
- 12.1.5.2. Products
- 12.1.5.3. Company Financials
- 12.1.5.4. SWOT Analysis
- 12.1.6 Eicher Motors Ltd
- 12.1.6.1. Company Overview
- 12.1.6.2. Products
- 12.1.6.3. Company Financials
- 12.1.6.4. SWOT Analysis
- 12.1.7 VE Commercial Vehicles Limited
- 12.1.7.1. Company Overview
- 12.1.7.2. Products
- 12.1.7.3. Company Financials
- 12.1.7.4. SWOT Analysis
- 12.1.8 Asia Motor Works Limited
- 12.1.8.1. Company Overview
- 12.1.8.2. Products
- 12.1.8.3. Company Financials
- 12.1.8.4. SWOT Analysis
- 12.1.9 Force Motors Ltd
- 12.1.9.1. Company Overview
- 12.1.9.2. Products
- 12.1.9.3. Company Financials
- 12.1.9.4. SWOT Analysis
- 12.1.10 Volvo Buses India Private Limite
- 12.1.10.1. Company Overview
- 12.1.10.2. Products
- 12.1.10.3. Company Financials
- 12.1.10.4. SWOT Analysis
- 12.1.1 Ashok Leyland Limited
- 12.2. Market Entropy
- 12.2.1 Company's Key Areas Served
- 12.2.2 Recent Developments
- 12.3. Company Market Share Analysis 2025
- 12.3.1 Top 5 Companies Market Share Analysis
- 12.3.2 Top 3 Companies Market Share Analysis
- 12.4. List of Potential Customers
- 13. Research Methodology
List of Figures
- Figure 1: Global Commercial Vehicle Industry in India Revenue Breakdown (billion, %) by Region 2025 & 2033
- Figure 2: North America Commercial Vehicle Industry in India Revenue (billion), by Vehicle Body Type 2025 & 2033
- Figure 3: North America Commercial Vehicle Industry in India Revenue Share (%), by Vehicle Body Type 2025 & 2033
- Figure 4: North America Commercial Vehicle Industry in India Revenue (billion), by Propulsion Type 2025 & 2033
- Figure 5: North America Commercial Vehicle Industry in India Revenue Share (%), by Propulsion Type 2025 & 2033
- Figure 6: North America Commercial Vehicle Industry in India Revenue (billion), by Country 2025 & 2033
- Figure 7: North America Commercial Vehicle Industry in India Revenue Share (%), by Country 2025 & 2033
- Figure 8: South America Commercial Vehicle Industry in India Revenue (billion), by Vehicle Body Type 2025 & 2033
- Figure 9: South America Commercial Vehicle Industry in India Revenue Share (%), by Vehicle Body Type 2025 & 2033
- Figure 10: South America Commercial Vehicle Industry in India Revenue (billion), by Propulsion Type 2025 & 2033
- Figure 11: South America Commercial Vehicle Industry in India Revenue Share (%), by Propulsion Type 2025 & 2033
- Figure 12: South America Commercial Vehicle Industry in India Revenue (billion), by Country 2025 & 2033
- Figure 13: South America Commercial Vehicle Industry in India Revenue Share (%), by Country 2025 & 2033
- Figure 14: Europe Commercial Vehicle Industry in India Revenue (billion), by Vehicle Body Type 2025 & 2033
- Figure 15: Europe Commercial Vehicle Industry in India Revenue Share (%), by Vehicle Body Type 2025 & 2033
- Figure 16: Europe Commercial Vehicle Industry in India Revenue (billion), by Propulsion Type 2025 & 2033
- Figure 17: Europe Commercial Vehicle Industry in India Revenue Share (%), by Propulsion Type 2025 & 2033
- Figure 18: Europe Commercial Vehicle Industry in India Revenue (billion), by Country 2025 & 2033
- Figure 19: Europe Commercial Vehicle Industry in India Revenue Share (%), by Country 2025 & 2033
- Figure 20: Middle East & Africa Commercial Vehicle Industry in India Revenue (billion), by Vehicle Body Type 2025 & 2033
- Figure 21: Middle East & Africa Commercial Vehicle Industry in India Revenue Share (%), by Vehicle Body Type 2025 & 2033
- Figure 22: Middle East & Africa Commercial Vehicle Industry in India Revenue (billion), by Propulsion Type 2025 & 2033
- Figure 23: Middle East & Africa Commercial Vehicle Industry in India Revenue Share (%), by Propulsion Type 2025 & 2033
- Figure 24: Middle East & Africa Commercial Vehicle Industry in India Revenue (billion), by Country 2025 & 2033
- Figure 25: Middle East & Africa Commercial Vehicle Industry in India Revenue Share (%), by Country 2025 & 2033
- Figure 26: Asia Pacific Commercial Vehicle Industry in India Revenue (billion), by Vehicle Body Type 2025 & 2033
- Figure 27: Asia Pacific Commercial Vehicle Industry in India Revenue Share (%), by Vehicle Body Type 2025 & 2033
- Figure 28: Asia Pacific Commercial Vehicle Industry in India Revenue (billion), by Propulsion Type 2025 & 2033
- Figure 29: Asia Pacific Commercial Vehicle Industry in India Revenue Share (%), by Propulsion Type 2025 & 2033
- Figure 30: Asia Pacific Commercial Vehicle Industry in India Revenue (billion), by Country 2025 & 2033
- Figure 31: Asia Pacific Commercial Vehicle Industry in India Revenue Share (%), by Country 2025 & 2033
List of Tables
- Table 1: Global Commercial Vehicle Industry in India Revenue billion Forecast, by Vehicle Body Type 2020 & 2033
- Table 2: Global Commercial Vehicle Industry in India Revenue billion Forecast, by Propulsion Type 2020 & 2033
- Table 3: Global Commercial Vehicle Industry in India Revenue billion Forecast, by Region 2020 & 2033
- Table 4: Global Commercial Vehicle Industry in India Revenue billion Forecast, by Vehicle Body Type 2020 & 2033
- Table 5: Global Commercial Vehicle Industry in India Revenue billion Forecast, by Propulsion Type 2020 & 2033
- Table 6: Global Commercial Vehicle Industry in India Revenue billion Forecast, by Country 2020 & 2033
- Table 7: United States Commercial Vehicle Industry in India Revenue (billion) Forecast, by Application 2020 & 2033
- Table 8: Canada Commercial Vehicle Industry in India Revenue (billion) Forecast, by Application 2020 & 2033
- Table 9: Mexico Commercial Vehicle Industry in India Revenue (billion) Forecast, by Application 2020 & 2033
- Table 10: Global Commercial Vehicle Industry in India Revenue billion Forecast, by Vehicle Body Type 2020 & 2033
- Table 11: Global Commercial Vehicle Industry in India Revenue billion Forecast, by Propulsion Type 2020 & 2033
- Table 12: Global Commercial Vehicle Industry in India Revenue billion Forecast, by Country 2020 & 2033
- Table 13: Brazil Commercial Vehicle Industry in India Revenue (billion) Forecast, by Application 2020 & 2033
- Table 14: Argentina Commercial Vehicle Industry in India Revenue (billion) Forecast, by Application 2020 & 2033
- Table 15: Rest of South America Commercial Vehicle Industry in India Revenue (billion) Forecast, by Application 2020 & 2033
- Table 16: Global Commercial Vehicle Industry in India Revenue billion Forecast, by Vehicle Body Type 2020 & 2033
- Table 17: Global Commercial Vehicle Industry in India Revenue billion Forecast, by Propulsion Type 2020 & 2033
- Table 18: Global Commercial Vehicle Industry in India Revenue billion Forecast, by Country 2020 & 2033
- Table 19: United Kingdom Commercial Vehicle Industry in India Revenue (billion) Forecast, by Application 2020 & 2033
- Table 20: Germany Commercial Vehicle Industry in India Revenue (billion) Forecast, by Application 2020 & 2033
- Table 21: France Commercial Vehicle Industry in India Revenue (billion) Forecast, by Application 2020 & 2033
- Table 22: Italy Commercial Vehicle Industry in India Revenue (billion) Forecast, by Application 2020 & 2033
- Table 23: Spain Commercial Vehicle Industry in India Revenue (billion) Forecast, by Application 2020 & 2033
- Table 24: Russia Commercial Vehicle Industry in India Revenue (billion) Forecast, by Application 2020 & 2033
- Table 25: Benelux Commercial Vehicle Industry in India Revenue (billion) Forecast, by Application 2020 & 2033
- Table 26: Nordics Commercial Vehicle Industry in India Revenue (billion) Forecast, by Application 2020 & 2033
- Table 27: Rest of Europe Commercial Vehicle Industry in India Revenue (billion) Forecast, by Application 2020 & 2033
- Table 28: Global Commercial Vehicle Industry in India Revenue billion Forecast, by Vehicle Body Type 2020 & 2033
- Table 29: Global Commercial Vehicle Industry in India Revenue billion Forecast, by Propulsion Type 2020 & 2033
- Table 30: Global Commercial Vehicle Industry in India Revenue billion Forecast, by Country 2020 & 2033
- Table 31: Turkey Commercial Vehicle Industry in India Revenue (billion) Forecast, by Application 2020 & 2033
- Table 32: Israel Commercial Vehicle Industry in India Revenue (billion) Forecast, by Application 2020 & 2033
- Table 33: GCC Commercial Vehicle Industry in India Revenue (billion) Forecast, by Application 2020 & 2033
- Table 34: North Africa Commercial Vehicle Industry in India Revenue (billion) Forecast, by Application 2020 & 2033
- Table 35: South Africa Commercial Vehicle Industry in India Revenue (billion) Forecast, by Application 2020 & 2033
- Table 36: Rest of Middle East & Africa Commercial Vehicle Industry in India Revenue (billion) Forecast, by Application 2020 & 2033
- Table 37: Global Commercial Vehicle Industry in India Revenue billion Forecast, by Vehicle Body Type 2020 & 2033
- Table 38: Global Commercial Vehicle Industry in India Revenue billion Forecast, by Propulsion Type 2020 & 2033
- Table 39: Global Commercial Vehicle Industry in India Revenue billion Forecast, by Country 2020 & 2033
- Table 40: China Commercial Vehicle Industry in India Revenue (billion) Forecast, by Application 2020 & 2033
- Table 41: India Commercial Vehicle Industry in India Revenue (billion) Forecast, by Application 2020 & 2033
- Table 42: Japan Commercial Vehicle Industry in India Revenue (billion) Forecast, by Application 2020 & 2033
- Table 43: South Korea Commercial Vehicle Industry in India Revenue (billion) Forecast, by Application 2020 & 2033
- Table 44: ASEAN Commercial Vehicle Industry in India Revenue (billion) Forecast, by Application 2020 & 2033
- Table 45: Oceania Commercial Vehicle Industry in India Revenue (billion) Forecast, by Application 2020 & 2033
- Table 46: Rest of Asia Pacific Commercial Vehicle Industry in India Revenue (billion) Forecast, by Application 2020 & 2033
Frequently Asked Questions
1. What is the projected Compound Annual Growth Rate (CAGR) of the Commercial Vehicle Industry in India?
The projected CAGR is approximately 5.24%.
2. Which companies are prominent players in the Commercial Vehicle Industry in India?
Key companies in the market include Ashok Leyland Limited, SML Isuzu Limited, Daimler India Commercial Vehicles Pvt Ltd, Tata Motors Limited, Mahindra & Mahindra Limited, Eicher Motors Ltd, VE Commercial Vehicles Limited, Asia Motor Works Limited, Force Motors Ltd, Volvo Buses India Private Limite.
3. What are the main segments of the Commercial Vehicle Industry in India?
The market segments include Vehicle Body Type, Propulsion Type.
4. Can you provide details about the market size?
The market size is estimated to be USD 50.58 billion as of 2022.
5. What are some drivers contributing to market growth?
Growing Travel and Tourism Industry is Driving the Car Rental Market.
6. What are the notable trends driving market growth?
OTHER KEY INDUSTRY TRENDS COVERED IN THE REPORT.
7. Are there any restraints impacting market growth?
Increasing Popularity of Ride-Sharing Services Pose Challenges for the Conventional Car Rental Market.
8. Can you provide examples of recent developments in the market?
August 2023: Eicher Trucks and Buses, a division of VE Commercial Vehicles Ltd has announced a partnership with Amazon to electrify the middle-mile and last-mile delivery processes for the e-commerce giant in India.August 2023: Ve Commercial Vehicles Limited announced that it has received an order for 550 Intercity Buses from Vijayan Travels and VT, worth INR 5 billion. The order includes 500 Eicher Intercity 13.5m AC and non AC sleeper coaches and 50 Volvo 9600 luxury sleeper coaches.April 2023: Tata Elxsi signed a Memorandum of Understanding (MoU) with the Indian Institute of Technology, Guwahati (IIT-G) to jointly work on developing and commercializing state-of-the-art solutions for the electric mobility market.
9. What pricing options are available for accessing the report?
Pricing options include single-user, multi-user, and enterprise licenses priced at USD 3800, USD 4500, and USD 5800 respectively.
10. Is the market size provided in terms of value or volume?
The market size is provided in terms of value, measured in billion.
11. Are there any specific market keywords associated with the report?
Yes, the market keyword associated with the report is "Commercial Vehicle Industry in India," which aids in identifying and referencing the specific market segment covered.
12. How do I determine which pricing option suits my needs best?
The pricing options vary based on user requirements and access needs. Individual users may opt for single-user licenses, while businesses requiring broader access may choose multi-user or enterprise licenses for cost-effective access to the report.
13. Are there any additional resources or data provided in the Commercial Vehicle Industry in India report?
While the report offers comprehensive insights, it's advisable to review the specific contents or supplementary materials provided to ascertain if additional resources or data are available.
14. How can I stay updated on further developments or reports in the Commercial Vehicle Industry in India?
To stay informed about further developments, trends, and reports in the Commercial Vehicle Industry in India, consider subscribing to industry newsletters, following relevant companies and organizations, or regularly checking reputable industry news sources and publications.
Methodology
Step 1 - Identification of Relevant Samples Size from Population Database


Step 2 - Approaches for Defining Global Market Size (Value, Volume* & Price*)

Note*: In applicable scenarios
Step 3 - Data Sources
Primary Research
- Web Analytics
- Survey Reports
- Research Institute
- Latest Research Reports
- Opinion Leaders
Secondary Research
- Annual Reports
- White Paper
- Latest Press Release
- Industry Association
- Paid Database
- Investor Presentations

Step 4 - Data Triangulation
Involves using different sources of information in order to increase the validity of a study
These sources are likely to be stakeholders in a program - participants, other researchers, program staff, other community members, and so on.
Then we put all data in single framework & apply various statistical tools to find out the dynamic on the market.
During the analysis stage, feedback from the stakeholder groups would be compared to determine areas of agreement as well as areas of divergence