

Key Insights
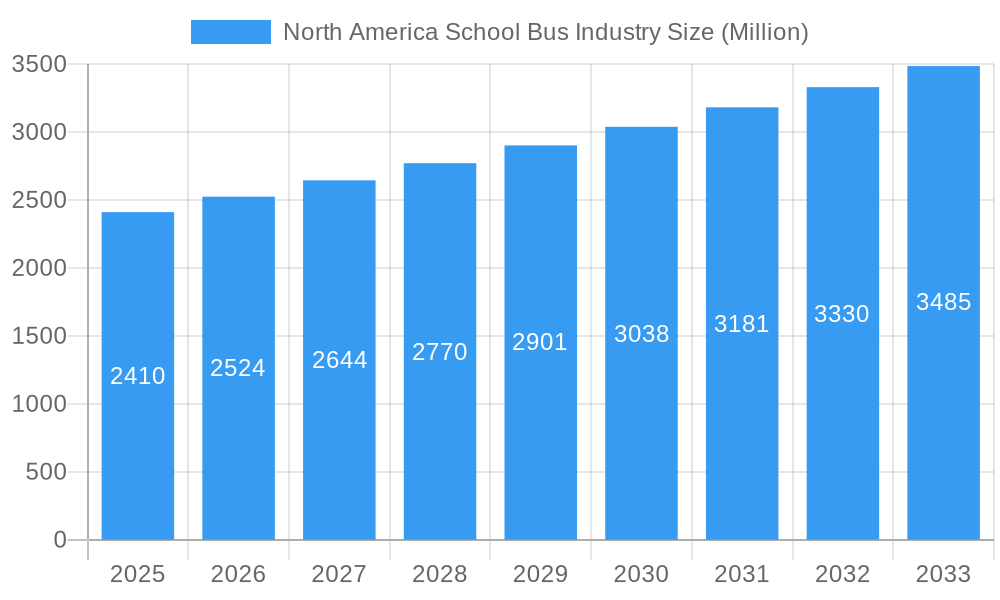
The North American school bus market is poised for substantial growth, projected to reach a valuation of $2.41 billion, expanding at a Compound Annual Growth Rate (CAGR) exceeding 4.74% throughout the forecast period of 2025-2033. This robust expansion is primarily fueled by a growing emphasis on student safety and an increasing demand for modern, efficient transportation solutions across the continent. The transition towards cleaner energy sources is a significant driver, with electric powertrains gaining considerable traction as school districts and governments prioritize environmental sustainability and reduced operating costs. Furthermore, evolving regulations mandating enhanced safety features and accessibility in school buses contribute to market dynamism. The market also benefits from ongoing fleet modernization initiatives, as aging vehicles are systematically replaced with newer, technologically advanced models that offer improved fuel efficiency and passenger comfort.
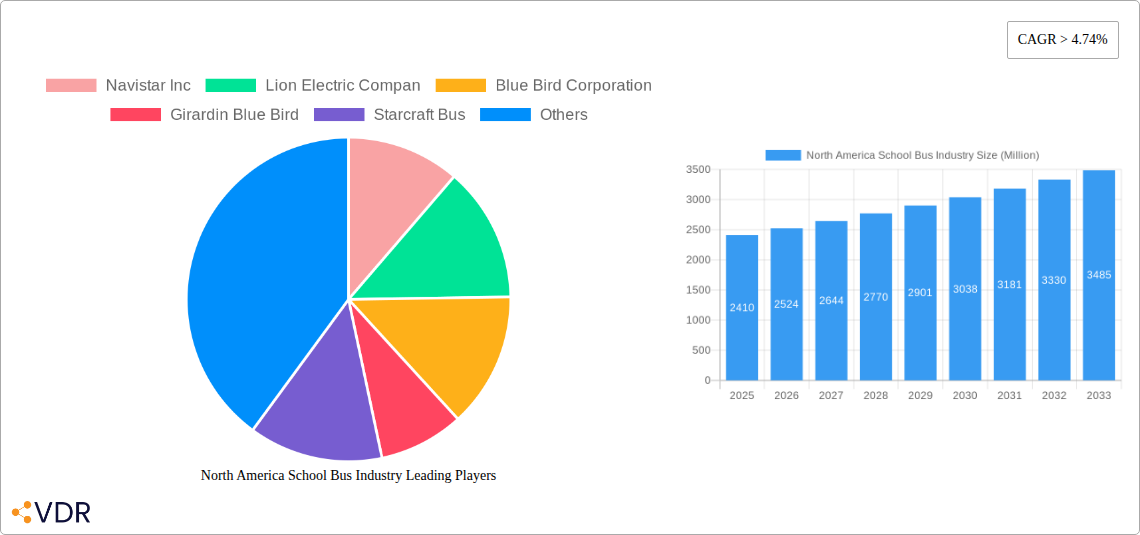
North America School Bus Industry Market Size (In Billion)
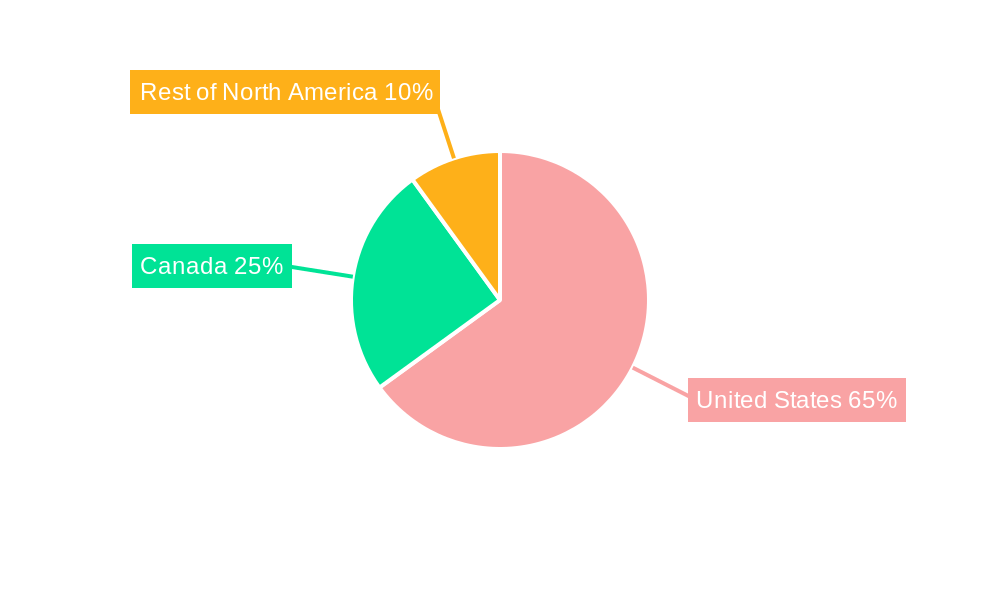
The market segmentation reveals a dynamic landscape influenced by technological advancements and diverse operational needs. While traditional Internal Combustion Engine (ICE) buses continue to hold a significant share, the rapid adoption of electric buses underscores a powerful trend towards electrification, driven by government incentives and a growing awareness of the long-term economic and environmental benefits. Type C and Type D buses represent the dominant categories, catering to different passenger capacities and operational requirements, with a steady demand for both. Geographically, the United States, Canada, and the Rest of North America all present substantial opportunities, with the United States leading in terms of market size due to its extensive school transportation network. Key players such as Navistar Inc., Lion Electric Company, and Blue Bird Corporation are at the forefront of innovation, actively developing and deploying advanced school bus solutions that address the evolving needs of educational institutions and transportation authorities.
North America School Bus Industry Company Market Share
This in-depth report provides a definitive analysis of the North America School Bus Industry, encompassing market dynamics, growth trends, regional dominance, product landscape, key drivers, challenges, emerging opportunities, and player strategies. With a comprehensive study period from 2019 to 2033, and a base year of 2025, this report leverages robust data and expert insights to deliver actionable intelligence for stakeholders. Explore the evolution of the market, from its historical trajectory to its projected future, with a keen focus on the burgeoning electric school bus segment and its transformative impact. This report is designed for industry professionals seeking a detailed understanding of the parent market and its crucial child segments.
North America School Bus Industry Market Dynamics & Structure
The North America School Bus Industry is characterized by a moderate market concentration, with a few prominent manufacturers holding significant market share, while a robust ecosystem of smaller players caters to niche demands. Technological innovation, particularly the rapid advancement and adoption of electric powertrains, is a primary driver of market evolution. Stringent regulatory frameworks, including emissions standards and safety mandates, continue to shape product development and operational practices. Competitive product substitutes, such as passenger vans and other forms of public transportation, exist but face limitations in catering to the specific needs of student transportation. End-user demographics, primarily school districts and private transportation providers, are increasingly influenced by budgetary constraints, environmental consciousness, and the pursuit of operational efficiency. Mergers and acquisitions (M&A) activity is on the rise as larger players seek to expand their product portfolios, technological capabilities, and market reach, particularly in the electric vehicle space. Barriers to innovation often stem from high upfront costs associated with new technologies, lengthy product development cycles, and the need for extensive testing and validation to meet safety standards.
- Market Concentration: Dominated by a handful of key manufacturers, with a notable rise in specialized electric bus producers.
- Technological Innovation: Electric powertrains, advanced safety features, and telematics are key innovation drivers.
- Regulatory Frameworks: Emissions standards (e.g., EPA regulations) and safety certifications (e.g., FMVSS) are critical.
- Competitive Substitutes: While present, face limitations in scale and specialized features for school transportation.
- End-User Demographics: School districts and private fleet operators are the primary consumers, with growing demand for sustainable and cost-effective solutions.
- M&A Trends: Increasing consolidation to leverage economies of scale and acquire technological expertise, especially in the EV sector.
- Innovation Barriers: High R&D costs, lengthy certification processes, and infrastructure development challenges for EVs.
North America School Bus Industry Growth Trends & Insights
The North America School Bus Industry is poised for significant growth, driven by a confluence of factors including increasing student enrollment, fleet modernization initiatives, and a strong governmental and public push towards sustainability. The market size evolution is notably influenced by the accelerating adoption of electric school buses, which, despite higher initial costs, offer substantial long-term savings on fuel and maintenance, alongside significant environmental benefits. Technological disruptions are primarily centered around electrification, with advancements in battery technology, charging infrastructure, and vehicle performance continually enhancing the viability of zero-emission school buses. Consumer behavior shifts are evident as school districts and fleet managers prioritize total cost of ownership, environmental impact, and the safety and comfort of students. The market penetration of electric school buses is steadily increasing, moving from pilot programs to large-scale fleet deployments across the United States and Canada. The Compound Annual Growth Rate (CAGR) for the overall market is projected to be robust, with the electric segment experiencing a significantly higher growth trajectory. This evolution reflects a fundamental shift in procurement priorities and a proactive approach to addressing climate change and improving air quality in school communities.
- Market Size Evolution: Steady growth in the traditional IC engine segment, with exponential expansion in the electric school bus market.
- Adoption Rates: Increasing penetration of electric school buses, driven by incentives, mandates, and proven operational efficiency.
- Technological Disruptions: Electrification is the paramount disruption, with ongoing improvements in battery range, charging speed, and vehicle integration.
- Consumer Behavior Shifts: Growing preference for sustainable transportation, reduced operating costs, and enhanced student well-being.
- Market Penetration: Electric school buses are transitioning from niche applications to mainstream fleet components in many regions.
- CAGR: Projected to be positive across the forecast period, with the electric segment outperforming the overall market.
Dominant Regions, Countries, or Segments in North America School Bus Industry
The United States unequivocally dominates the North America School Bus Industry, accounting for the largest share of market value and volume. This dominance is attributed to its vast geographical expanse, substantial student population, and extensive network of school districts actively engaged in fleet management and procurement. Within the United States, key states with robust school bus fleets and proactive electrification initiatives, such as California, New York, and Texas, are significant growth hubs. Canada represents a significant, albeit smaller, market segment, with provinces like Ontario and Quebec demonstrating a growing commitment to transitioning to electric school buses.
In terms of powertrain, the IC Engine segment still holds the largest market share due to the established infrastructure and lower upfront cost of traditional diesel and gasoline buses. However, the Electric powertrain segment is the most dynamic and fastest-growing, driven by favorable government policies, environmental mandates, and declining battery costs. The demand for electric school buses is rapidly increasing, signaling a major shift in the industry's technological landscape.
Considering bus types, Type C buses, the ubiquitous conventional school bus, continue to be the most prevalent type due to their versatility and cost-effectiveness for a wide range of student transportation needs. Type D buses, characterized by their flat-nosed design and often larger capacity, also hold a substantial market share, particularly for longer routes and larger school districts. "Other Types," which include smaller buses and specialized transport vehicles, represent a smaller but growing segment catering to specific educational or accessibility requirements. The dominance of the United States in the market is fueled by economic policies that support school funding, infrastructure development for charging stations, and a strong public consensus on the importance of safe and reliable student transportation.
- Dominant Geography: United States, due to its large student population and active procurement cycles.
- Key US States: California, New York, and Texas lead in adoption rates and fleet size.
- Dominant Powertrain (Current): IC Engine (Diesel, Gasoline), due to established infrastructure and cost.
- Fastest-Growing Powertrain: Electric, propelled by environmental mandates and incentives.
- Dominant Bus Type: Type C, for its widespread applicability and cost-efficiency.
- Key Drivers (United States): Federal and state incentives for EV adoption, EPA emissions regulations, school district modernization programs.
- Key Drivers (Canada): Provincial sustainability targets, increasing focus on zero-emission public transit.
North America School Bus Industry Product Landscape
The North America School Bus Industry is witnessing significant product innovation, primarily focused on enhancing safety, efficiency, and environmental sustainability. Electric powertrains are at the forefront, with manufacturers developing buses offering extended ranges, faster charging capabilities, and reduced maintenance requirements. Advanced battery management systems and optimized thermal controls are crucial for ensuring performance in diverse climatic conditions across North America. Integrated telematics systems provide real-time data on vehicle performance, driver behavior, and route optimization, further enhancing operational efficiency. Safety features are continuously being upgraded, including enhanced collision avoidance systems, improved visibility for drivers, and robust structural integrity. The unique selling propositions of modern school buses lie in their ability to meet stringent safety standards while offering reduced operational costs and a minimized environmental footprint, particularly with the advent of zero-emission vehicles. Technological advancements are making electric school buses increasingly competitive and practical for widespread adoption.
Key Drivers, Barriers & Challenges in North America School Bus Industry
Key Drivers:
- Governmental Incentives and Regulations: Federal and state grants, tax credits, and emissions mandates are accelerating the adoption of electric school buses.
- Environmental Concerns and Sustainability Goals: Increasing pressure to reduce carbon emissions and improve air quality around schools.
- Total Cost of Ownership (TCO) Benefits: Long-term savings on fuel and maintenance for electric vehicles are becoming increasingly attractive.
- Fleet Modernization and Replacement Cycles: Aging fleets necessitate new purchases, providing opportunities for technology upgrades.
- Technological Advancements: Improved battery technology, charging infrastructure, and vehicle efficiency are making electric buses more viable.
Barriers & Challenges:
- High Upfront Cost of Electric Buses: The initial purchase price of electric school buses remains a significant barrier for many school districts.
- Charging Infrastructure Development: The availability and accessibility of adequate charging infrastructure, especially in rural areas, is a critical challenge.
- Range Anxiety and Charging Time: Concerns about battery range limitations and the time required for charging can impact operational planning.
- Supply Chain Disruptions: Global supply chain issues can affect the availability of components, particularly for batteries and semiconductors.
- Skilled Workforce for Maintenance and Repair: A shortage of trained technicians for electric vehicle maintenance can pose operational challenges.
- Limited Availability of Certain Bus Types/Features: Specific configurations or advanced features may not be readily available from all manufacturers.
Emerging Opportunities in North America School Bus Industry
Emerging opportunities in the North America School Bus Industry are primarily driven by the accelerating transition to electrification and the growing demand for innovative transportation solutions. The expansion of "Electrification-as-a-Service" (EaaS) models presents a significant opportunity for providers to offer comprehensive packages including vehicles, charging infrastructure, and maintenance, thereby reducing the upfront financial burden on school districts. Untapped markets in remote and rural areas are becoming increasingly accessible with advancements in battery technology and charging solutions. Furthermore, the integration of smart technologies, such as bidirectional charging (Vehicle-to-Grid - V2G), offers the potential for school buses to become mobile energy storage units, contributing to grid stability and generating revenue for districts. Evolving consumer preferences for cleaner and quieter transportation are also creating demand for specialized bus designs and features that enhance student experience and community well-being.
Growth Accelerators in the North America School Bus Industry Industry
The growth of the North America School Bus Industry is being significantly accelerated by strategic partnerships between manufacturers, charging infrastructure providers, and fleet operators. The continuous innovation in battery technology, leading to increased range, faster charging, and longer lifespan, is a critical catalyst. Government policies, including substantial federal and state funding for electric school bus deployments and the establishment of ambitious zero-emission targets, are powerful growth accelerators. Furthermore, the development of robust charging infrastructure networks, supported by public and private investment, is crucial for enabling widespread adoption. Market expansion strategies by key players, focusing on increasing production capacity and optimizing supply chains, will further drive growth. The increasing awareness and demand for sustainable transportation solutions from parents and communities are also playing a vital role in pushing the industry forward.
Key Players Shaping the North America School Bus Industry Market
- Navistar Inc
- Lion Electric Company
- Blue Bird Corporation
- Girardin Blue Bird
- Starcraft Bus
- Trans Tech
- Collins Bus Corporation
- Daimler AG (Thomas Built Buses)
Notable Milestones in North America School Bus Industry Sector
- October 2023: Blue Bird achieved a milestone by delivering its 1,500th electric, zero-emission school bus to Modesto City Schools in California. The company also inaugurated its Electric Vehicle (EV) Build-up Center in Georgia, aiming to boost its long-term production capacity to 5,000 electric school buses annually.
- November 2023: The Lion Electric Company disclosed the acquisition of a provisional purchase order for 50 LionC all-electric school buses from Highland Electric Fleets.
- November 2022: Lion Electric Co. announced the production of its first zero-emission LionC school bus in its Joliet, Illinois, factory.
- October 2022: Thomas Built Buses (TBB) delivered its 200th Proterra Powered Saf-T-Liner C2 Jouley battery-electric school bus to Monroe County Public Schools (MCCSC) in Indiana.
- March 2022: Thomas Built Buses and Highland Electric Fleets announced an expansion of their partnership to accelerate the adoption of electric school buses.
In-Depth North America School Bus Industry Market Outlook
The North America School Bus Industry is on an upward trajectory, propelled by the undeniable shift towards electrification and a growing emphasis on sustainability. The market outlook is characterized by robust growth in the electric school bus segment, driven by supportive government policies, technological advancements, and increasing awareness of environmental benefits. The total cost of ownership for electric buses is becoming increasingly favorable, making them an attractive long-term investment for school districts. Strategic partnerships and expanding production capacities by key manufacturers will further fuel this growth. Opportunities abound in the development of charging infrastructure, the adoption of innovative service models like EaaS, and the integration of smart technologies for enhanced operational efficiency. The future of the North America school bus market is undeniably electric, promising cleaner air and more sustainable transportation for students across the continent.
North America School Bus Industry Segmentation
-
1. Powertrain
- 1.1. IC Engine
- 1.2. Electric
-
2. Bus Type
- 2.1. Type C
- 2.2. Type D
- 2.3. Other Types
-
3. Geography
- 3.1. United States
- 3.2. Canada
- 3.3. Rest of North America
North America School Bus Industry Segmentation By Geography
- 1. United States
- 2. Canada
- 3. Rest of North America
North America School Bus Industry Regional Market Share
Geographic Coverage of North America School Bus Industry
North America School Bus Industry REPORT HIGHLIGHTS
| Aspects | Details |
|---|---|
| Study Period | 2020-2034 |
| Base Year | 2025 |
| Estimated Year | 2026 |
| Forecast Period | 2026-2034 |
| Historical Period | 2020-2025 |
| Growth Rate | CAGR of > 4.74% from 2020-2034 |
| Segmentation |
|
Table of Contents
- 1. Introduction
- 1.1. Research Scope
- 1.2. Market Segmentation
- 1.3. Research Objective
- 1.4. Definitions and Assumptions
- 2. Executive Summary
- 2.1. Market Snapshot
- 3. Market Dynamics
- 3.1. Market Drivers
- 3.2. Market Restrains
- 3.3. Market Trends
- 3.4. Market Opportunities
- 4. Market Factor Analysis
- 4.1. Porters Five Forces
- 4.1.1. Bargaining Power of Suppliers
- 4.1.2. Bargaining Power of Buyers
- 4.1.3. Threat of New Entrants
- 4.1.4. Threat of Substitutes
- 4.1.5. Competitive Rivalry
- 4.2. PESTEL analysis
- 4.3. BCG Analysis
- 4.3.1. Stars (High Growth, High Market Share)
- 4.3.2. Cash Cows (Low Growth, High Market Share)
- 4.3.3. Question Mark (High Growth, Low Market Share)
- 4.3.4. Dogs (Low Growth, Low Market Share)
- 4.4. Ansoff Matrix Analysis
- 4.5. Supply Chain Analysis
- 4.6. Regulatory Landscape
- 4.7. Current Market Potential and Opportunity Assessment (TAM–SAM–SOM Framework)
- 4.8. VDR Analyst Note
- 4.1. Porters Five Forces
- 5. Market Analysis, Insights and Forecast 2021-2033
- 5.1. Market Analysis, Insights and Forecast - by Powertrain
- 5.1.1. IC Engine
- 5.1.2. Electric
- 5.2. Market Analysis, Insights and Forecast - by Bus Type
- 5.2.1. Type C
- 5.2.2. Type D
- 5.2.3. Other Types
- 5.3. Market Analysis, Insights and Forecast - by Geography
- 5.3.1. United States
- 5.3.2. Canada
- 5.3.3. Rest of North America
- 5.4. Market Analysis, Insights and Forecast - by Region
- 5.4.1. United States
- 5.4.2. Canada
- 5.4.3. Rest of North America
- 5.1. Market Analysis, Insights and Forecast - by Powertrain
- 6. North America School Bus Industry Analysis, Insights and Forecast, 2021-2033
- 6.1. Market Analysis, Insights and Forecast - by Powertrain
- 6.1.1. IC Engine
- 6.1.2. Electric
- 6.2. Market Analysis, Insights and Forecast - by Bus Type
- 6.2.1. Type C
- 6.2.2. Type D
- 6.2.3. Other Types
- 6.3. Market Analysis, Insights and Forecast - by Geography
- 6.3.1. United States
- 6.3.2. Canada
- 6.3.3. Rest of North America
- 6.1. Market Analysis, Insights and Forecast - by Powertrain
- 7. United States North America School Bus Industry Analysis, Insights and Forecast, 2021-2033
- 7.1. Market Analysis, Insights and Forecast - by Powertrain
- 7.1.1. IC Engine
- 7.1.2. Electric
- 7.2. Market Analysis, Insights and Forecast - by Bus Type
- 7.2.1. Type C
- 7.2.2. Type D
- 7.2.3. Other Types
- 7.3. Market Analysis, Insights and Forecast - by Geography
- 7.3.1. United States
- 7.3.2. Canada
- 7.3.3. Rest of North America
- 7.1. Market Analysis, Insights and Forecast - by Powertrain
- 8. Canada North America School Bus Industry Analysis, Insights and Forecast, 2021-2033
- 8.1. Market Analysis, Insights and Forecast - by Powertrain
- 8.1.1. IC Engine
- 8.1.2. Electric
- 8.2. Market Analysis, Insights and Forecast - by Bus Type
- 8.2.1. Type C
- 8.2.2. Type D
- 8.2.3. Other Types
- 8.3. Market Analysis, Insights and Forecast - by Geography
- 8.3.1. United States
- 8.3.2. Canada
- 8.3.3. Rest of North America
- 8.1. Market Analysis, Insights and Forecast - by Powertrain
- 9. Rest of North America North America School Bus Industry Analysis, Insights and Forecast, 2021-2033
- 9.1. Market Analysis, Insights and Forecast - by Powertrain
- 9.1.1. IC Engine
- 9.1.2. Electric
- 9.2. Market Analysis, Insights and Forecast - by Bus Type
- 9.2.1. Type C
- 9.2.2. Type D
- 9.2.3. Other Types
- 9.3. Market Analysis, Insights and Forecast - by Geography
- 9.3.1. United States
- 9.3.2. Canada
- 9.3.3. Rest of North America
- 9.1. Market Analysis, Insights and Forecast - by Powertrain
- 10. Competitive Analysis
- 10.1. Company Profiles
- 10.1.1 Navistar Inc
- 10.1.1.1. Company Overview
- 10.1.1.2. Products
- 10.1.1.3. Company Financials
- 10.1.1.4. SWOT Analysis
- 10.1.2 Lion Electric Compan
- 10.1.2.1. Company Overview
- 10.1.2.2. Products
- 10.1.2.3. Company Financials
- 10.1.2.4. SWOT Analysis
- 10.1.3 Blue Bird Corporation
- 10.1.3.1. Company Overview
- 10.1.3.2. Products
- 10.1.3.3. Company Financials
- 10.1.3.4. SWOT Analysis
- 10.1.4 Girardin Blue Bird
- 10.1.4.1. Company Overview
- 10.1.4.2. Products
- 10.1.4.3. Company Financials
- 10.1.4.4. SWOT Analysis
- 10.1.5 Starcraft Bus
- 10.1.5.1. Company Overview
- 10.1.5.2. Products
- 10.1.5.3. Company Financials
- 10.1.5.4. SWOT Analysis
- 10.1.6 Trans Tech
- 10.1.6.1. Company Overview
- 10.1.6.2. Products
- 10.1.6.3. Company Financials
- 10.1.6.4. SWOT Analysis
- 10.1.7 Collins Bus Corporation
- 10.1.7.1. Company Overview
- 10.1.7.2. Products
- 10.1.7.3. Company Financials
- 10.1.7.4. SWOT Analysis
- 10.1.8 Daimler AG (Thomas Built Buses)
- 10.1.8.1. Company Overview
- 10.1.8.2. Products
- 10.1.8.3. Company Financials
- 10.1.8.4. SWOT Analysis
- 10.1.1 Navistar Inc
- 10.2. Market Entropy
- 10.2.1 Company's Key Areas Served
- 10.2.2 Recent Developments
- 10.3. Company Market Share Analysis 2025
- 10.3.1 Top 5 Companies Market Share Analysis
- 10.3.2 Top 3 Companies Market Share Analysis
- 10.4. List of Potential Customers
- 11. Research Methodology
List of Figures
- Figure 1: North America School Bus Industry Revenue Breakdown (Million, %) by Product 2025 & 2033
- Figure 2: North America School Bus Industry Share (%) by Company 2025
List of Tables
- Table 1: North America School Bus Industry Revenue Million Forecast, by Powertrain 2020 & 2033
- Table 2: North America School Bus Industry Revenue Million Forecast, by Bus Type 2020 & 2033
- Table 3: North America School Bus Industry Revenue Million Forecast, by Geography 2020 & 2033
- Table 4: North America School Bus Industry Revenue Million Forecast, by Region 2020 & 2033
- Table 5: North America School Bus Industry Revenue Million Forecast, by Powertrain 2020 & 2033
- Table 6: North America School Bus Industry Revenue Million Forecast, by Bus Type 2020 & 2033
- Table 7: North America School Bus Industry Revenue Million Forecast, by Geography 2020 & 2033
- Table 8: North America School Bus Industry Revenue Million Forecast, by Country 2020 & 2033
- Table 9: North America School Bus Industry Revenue Million Forecast, by Powertrain 2020 & 2033
- Table 10: North America School Bus Industry Revenue Million Forecast, by Bus Type 2020 & 2033
- Table 11: North America School Bus Industry Revenue Million Forecast, by Geography 2020 & 2033
- Table 12: North America School Bus Industry Revenue Million Forecast, by Country 2020 & 2033
- Table 13: North America School Bus Industry Revenue Million Forecast, by Powertrain 2020 & 2033
- Table 14: North America School Bus Industry Revenue Million Forecast, by Bus Type 2020 & 2033
- Table 15: North America School Bus Industry Revenue Million Forecast, by Geography 2020 & 2033
- Table 16: North America School Bus Industry Revenue Million Forecast, by Country 2020 & 2033
Frequently Asked Questions
1. What is the projected Compound Annual Growth Rate (CAGR) of the North America School Bus Industry?
The projected CAGR is approximately > 4.74%.
2. Which companies are prominent players in the North America School Bus Industry?
Key companies in the market include Navistar Inc, Lion Electric Compan, Blue Bird Corporation, Girardin Blue Bird, Starcraft Bus, Trans Tech, Collins Bus Corporation, Daimler AG (Thomas Built Buses).
3. What are the main segments of the North America School Bus Industry?
The market segments include Powertrain, Bus Type, Geography.
4. Can you provide details about the market size?
The market size is estimated to be USD 2.41 Million as of 2022.
5. What are some drivers contributing to market growth?
Increasing Demand For Electric School Buses.
6. What are the notable trends driving market growth?
The Industry’s Shift Toward the Adoption of Electric School Buses.
7. Are there any restraints impacting market growth?
Uncertainty of The Global Pandemic.
8. Can you provide examples of recent developments in the market?
October 2023: Blue Bird achieved a milestone by delivering its 1,500th electric, zero-emission school bus to Modesto City Schools in California. Recently, the company marked the inauguration of its Electric Vehicle (EV) Build-up Center in Georgia, aiming to boost its long-term production capacity to 5,000 electric school buses annually. This expansion underscores Blue Bird's commitment to advancing zero-emission school buses.
9. What pricing options are available for accessing the report?
Pricing options include single-user, multi-user, and enterprise licenses priced at USD 4750, USD 5250, and USD 8750 respectively.
10. Is the market size provided in terms of value or volume?
The market size is provided in terms of value, measured in Million.
11. Are there any specific market keywords associated with the report?
Yes, the market keyword associated with the report is "North America School Bus Industry," which aids in identifying and referencing the specific market segment covered.
12. How do I determine which pricing option suits my needs best?
The pricing options vary based on user requirements and access needs. Individual users may opt for single-user licenses, while businesses requiring broader access may choose multi-user or enterprise licenses for cost-effective access to the report.
13. Are there any additional resources or data provided in the North America School Bus Industry report?
While the report offers comprehensive insights, it's advisable to review the specific contents or supplementary materials provided to ascertain if additional resources or data are available.
14. How can I stay updated on further developments or reports in the North America School Bus Industry?
To stay informed about further developments, trends, and reports in the North America School Bus Industry, consider subscribing to industry newsletters, following relevant companies and organizations, or regularly checking reputable industry news sources and publications.
Methodology
Step 1 - Identification of Relevant Samples Size from Population Database


Step 2 - Approaches for Defining Global Market Size (Value, Volume* & Price*)

Note*: In applicable scenarios
Step 3 - Data Sources
Primary Research
- Web Analytics
- Survey Reports
- Research Institute
- Latest Research Reports
- Opinion Leaders
Secondary Research
- Annual Reports
- White Paper
- Latest Press Release
- Industry Association
- Paid Database
- Investor Presentations

Step 4 - Data Triangulation
Involves using different sources of information in order to increase the validity of a study
These sources are likely to be stakeholders in a program - participants, other researchers, program staff, other community members, and so on.
Then we put all data in single framework & apply various statistical tools to find out the dynamic on the market.
During the analysis stage, feedback from the stakeholder groups would be compared to determine areas of agreement as well as areas of divergence