

Key Insights
The global bus market is projected for significant expansion, forecasted to reach USD 268.68 billion by 2025, demonstrating a robust Compound Annual Growth Rate (CAGR) of 7%. This growth is underpinned by a global transition towards sustainable transportation and increasing urbanization, demanding efficient public transit. Favorable government policies, including emission regulations and incentives for eco-friendly bus technologies, are accelerating the adoption of electric and hybrid buses. Innovations in battery technology, charging infrastructure, and vehicle performance are enhancing the viability of these sustainable options for fleet operators. Growing environmental consciousness and the pursuit of cost-effective operational expenses are also key drivers.
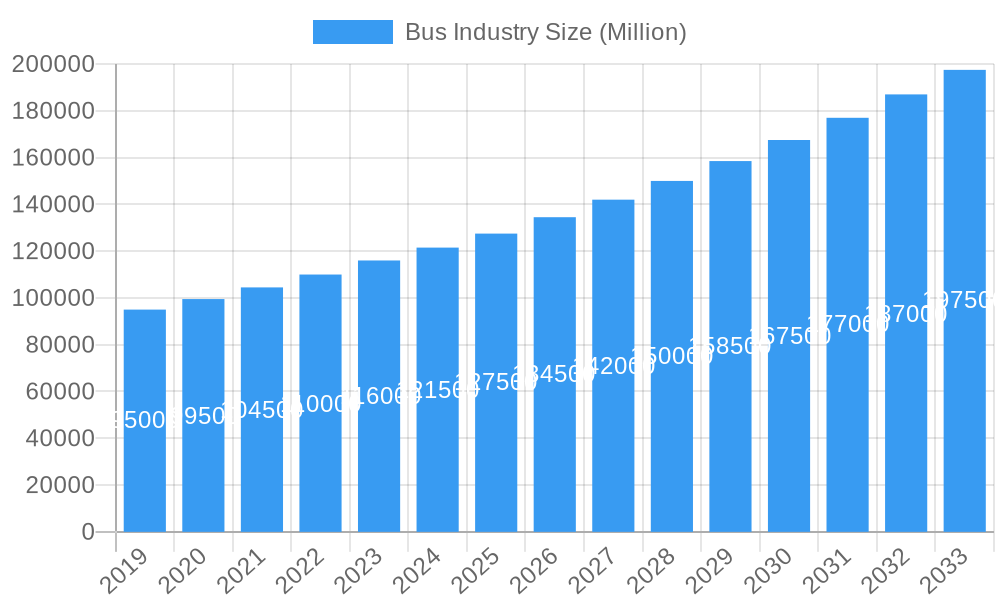
Bus Industry Market Size (In Billion)
The market is experiencing a pronounced shift towards electric and hybrid propulsion systems, displacing traditional internal combustion engine (ICE) buses. Battery Electric Vehicles (BEVs) and Plug-in Hybrid Electric Vehicles (PHEVs) are leading this transformation due to their zero-emission capabilities and reduced operating costs. While initial purchase costs and charging infrastructure development present challenges, ongoing R&D, supportive government initiatives, and evolving consumer preferences are mitigating these factors. Leading market participants are actively innovating and broadening their product offerings to meet the escalating demand for advanced, sustainable bus solutions globally.
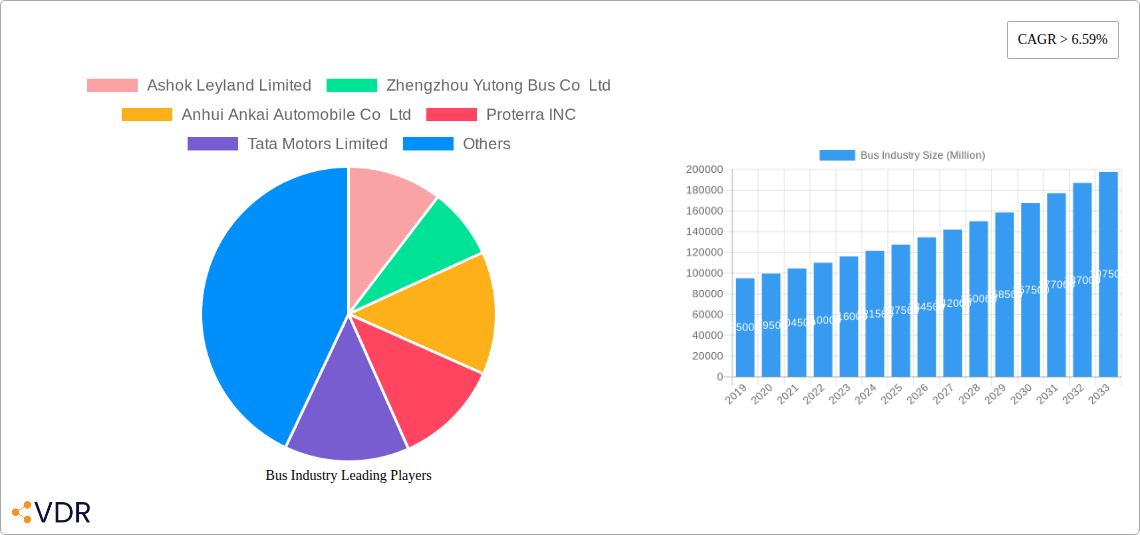
Bus Industry Company Market Share
Unveiling the Future of Urban Mobility: A Comprehensive Bus Industry Market Report (2019-2033)
This in-depth report offers a definitive analysis of the global Bus Industry, meticulously forecasting market evolution from 2019 to 2033, with a base and estimated year of 2025 and a detailed forecast period of 2025–2033. Explore the intricate dynamics of this rapidly transforming sector, driven by technological advancements in electric buses, hybrid buses, and alternative fuel vehicles, alongside the enduring presence of internal combustion engine (ICE) buses. We delve into both the parent bus market and its critical child markets, providing a holistic view of opportunities and challenges. All quantitative data is presented in Million Units for clarity and industry relevance.
Bus Industry Market Dynamics & Structure
The global Bus Industry is characterized by a dynamic interplay of technological innovation, stringent regulatory frameworks, and evolving end-user demands, particularly for sustainable transportation solutions. Market concentration is shifting, with a notable rise in the influence of electric bus manufacturers and companies pioneering battery electric vehicle (BEV) technology. Key drivers include government incentives for zero-emission buses, stricter emissions standards, and increasing public awareness of environmental concerns. Competitive product substitutes are emerging, ranging from ride-sharing services and micromobility options to fully autonomous shuttle systems, challenging traditional bus operations in certain segments. End-user demographics are increasingly urbanized, demanding efficient, reliable, and eco-friendly public transit. Merger and acquisition (M&A) trends reflect this transformation, with significant activity focused on securing advanced battery technology, charging infrastructure, and autonomous driving capabilities.
- Market Concentration Shift: Increasing dominance of specialized electric bus manufacturers like BYD and Yutong.
- Technological Innovation Drivers: Advancements in battery technology (higher energy density, faster charging), powertrain efficiency, and smart city integration for fleet management.
- Regulatory Frameworks: Government mandates for low-emission zones and zero-emission bus procurement are critical growth catalysts.
- Competitive Product Substitutes: Emerging mobility-as-a-service (MaaS) platforms and on-demand transit solutions.
- End-User Demographics: Growing demand for comfortable, connected, and environmentally conscious public transport in urban centers.
- M&A Trends: Focus on acquiring battery technology firms and autonomous driving solution providers. For instance, X M&A deals were observed in the historical period, indicating a robust consolidation trend.
Bus Industry Growth Trends & Insights
The Bus Industry is poised for significant expansion, fueled by an accelerating transition towards sustainable mobility. The market size evolution is projected to witness robust growth throughout the forecast period, driven by increasing adoption rates of electric buses and other eco-friendly bus variants. Technological disruptions, such as advancements in solid-state batteries and hydrogen fuel cell technology for fuel cell electric vehicles (FCEV), are expected to further revolutionize the sector. Consumer behavior shifts are also playing a crucial role, with a growing preference for public transportation that aligns with environmental values and offers a superior passenger experience. The hybrid electric vehicle (HEV) and plug-in hybrid electric vehicle (PHEV) segments will continue to serve as important transitional technologies, bridging the gap between traditional ICE buses and fully electric solutions.
The global bus market is projected to expand at a Compound Annual Growth Rate (CAGR) of XX% from 2025 to 2033, reaching an estimated market size of $XXX Billion in 2033. This growth is underpinned by substantial investments in public transportation infrastructure and the decarbonization targets set by governments worldwide. The penetration of electric buses is expected to surge, with market share projected to increase from XX% in 2025 to over XX% by 2033. Key growth drivers include decreasing battery costs, supportive government subsidies, and the increasing operational cost savings associated with electric powertrains compared to ICE alternatives. Furthermore, the development of smart charging infrastructure and grid integration solutions will be pivotal in supporting the widespread deployment of electric buses. The demand for specialized buses, such as those used in airport operations (apron buses) and for intercity travel, will also contribute to market growth, with a growing emphasis on comfort, connectivity, and sustainability.
- Market Size Evolution: Projected significant growth from an estimated $XXX Billion in 2025 to $XXX Billion by 2033.
- Adoption Rates: Accelerating adoption of electric buses (BEV, HEV, PHEV) and increasing interest in FCEVs.
- Technological Disruptions: Innovations in battery chemistry, vehicle-to-grid (V2G) technology, and autonomous driving systems.
- Consumer Behavior Shifts: Growing preference for sustainable, safe, and technologically advanced public transportation.
- CAGR: Expected CAGR of XX% during the forecast period.
- Market Penetration: Electric bus market penetration to exceed XX% by 2033.
Dominant Regions, Countries, or Segments in Bus Industry
The global Bus Industry's growth trajectory is unevenly distributed, with certain regions and segments exhibiting exceptional dynamism. Asia Pacific stands out as the dominant region, driven by rapid urbanization, substantial government investments in public transportation infrastructure, and a strong manufacturing base for electric buses. China, in particular, is a leading force, not only in terms of production volume but also in the widespread adoption of zero-emission buses. The country's ambitious targets for electric vehicle penetration and its supportive policies have propelled its dominance in the BEV bus segment.
The Propulsion Type segment of Hybrid and Electric Vehicles is unequivocally driving market growth, with a clear lead in adoption and innovation. Within this category, Battery Electric Vehicles (BEV) are emerging as the frontrunners, owing to continuous improvements in battery technology, decreasing costs, and extensive government support. The ICE segment, while still significant, is gradually ceding market share to cleaner alternatives, especially in developed markets.
Dominant Region: Asia Pacific, led by China, is the largest market for buses, especially electric buses.
- Key Drivers: Aggressive government targets for zero-emission transportation, significant urban population growth, and extensive public transport network expansion.
- Market Share: China accounts for over XX% of global electric bus sales.
- Growth Potential: Continued investment in smart city initiatives and sustainable mobility solutions.
Dominant Segment: Hybrid and Electric Vehicles segment, particularly Battery Electric Vehicles (BEV).
- Key Drivers: Declining battery costs, favorable regulatory incentives (tax credits, subsidies), and growing corporate sustainability initiatives.
- Market Share: BEVs are projected to capture XX% of the new bus market by 2033.
- Growth Potential: Innovations in charging infrastructure, battery longevity, and vehicle-to-grid (V2G) integration.
Emerging Segment: Fuel Cell Electric Vehicles (FCEV) show significant promise, particularly for long-haul and heavy-duty applications, with increasing R&D investments and pilot projects.
- Key Drivers: Potential for faster refueling times compared to BEVs and longer range capabilities.
- Growth Potential: Development of robust hydrogen infrastructure and cost reduction in fuel cell technology.
Bus Industry Product Landscape
The Bus Industry product landscape is being redefined by a relentless pursuit of efficiency, sustainability, and passenger comfort. Innovations in electric bus technology are at the forefront, featuring advanced battery management systems for extended range and faster charging capabilities. Manufacturers are also integrating cutting-edge infotainment systems, Wi-Fi connectivity, and advanced climate control to enhance the passenger experience. Hybrid buses continue to evolve, offering a seamless blend of electric and ICE power for optimized fuel efficiency. The emergence of specialized vehicles, such as hydrogen fuel cell buses, signifies a push towards even cleaner and more sustainable long-term solutions. Performance metrics such as energy consumption per kilometer, charging times, and operational range are key differentiators in this competitive market.
- Product Innovations: Extended range electric buses, rapid charging solutions, lightweight composite materials for improved efficiency.
- Applications: Urban transit, intercity coaches, airport shuttle buses, school buses, and specialized fleet operations.
- Performance Metrics: Focus on energy efficiency (kWh/km), battery lifespan, charging speed (minutes to XX% charge), and operational uptime.
- Unique Selling Propositions: Eco-friendliness, reduced noise pollution, lower operating costs for electric variants, and enhanced passenger amenities.
Key Drivers, Barriers & Challenges in Bus Industry
The Bus Industry's growth is propelled by several key drivers and simultaneously faces significant barriers and challenges.
Key Drivers:
- Environmental Regulations and Government Policies: Mandates for zero-emission buses and subsidies for electric vehicles are primary accelerators.
- Technological Advancements: Improvements in battery technology, charging infrastructure, and vehicle efficiency are making electric buses more viable.
- Rising Fuel Prices: Volatility in traditional fuel costs encourages the adoption of more economical alternatives like electric buses.
- Urbanization and Public Transport Demand: Growing urban populations necessitate efficient and sustainable public transportation solutions.
- Corporate Sustainability Goals: Companies are increasingly investing in eco-friendly fleets to meet ESG targets.
Barriers & Challenges:
- High Upfront Cost of Electric Buses: The initial purchase price of electric buses remains higher than ICE counterparts, although TCO is often lower.
- Charging Infrastructure Development: The availability and speed of charging infrastructure are critical for widespread adoption, especially for large fleets.
- Range Anxiety and Charging Time: Concerns about the operational range of electric buses and the time required for charging can limit deployment in certain routes.
- Battery Lifespan and Replacement Costs: The long-term cost of battery replacement and degradation impacts the total cost of ownership.
- Supply Chain Disruptions: The availability of key components, particularly semiconductors and battery materials, can impact production volumes. The impact of supply chain disruptions has resulted in an estimated production delay of XX% for certain electric bus models.
- Grid Capacity and Stability: The increased demand from widespread EV charging can strain local power grids, requiring significant upgrades.
Emerging Opportunities in Bus Industry
The Bus Industry is ripe with emerging opportunities, particularly for companies that can innovate and adapt to the evolving mobility landscape. The expansion of zero-emission bus networks in developing economies presents a significant untapped market. Opportunities also lie in developing integrated mobility solutions that combine bus services with other transportation modes, leveraging smart technology and data analytics for optimized route planning and passenger flow. The growing demand for specialized services, such as autonomous shuttle buses for campuses or last-mile connectivity, and the increasing interest in retrofitting older ICE buses with electric powertrains (e-conversion) also represent promising avenues for growth.
- Untapped Markets: Expansion of electric bus fleets in emerging economies in Africa and South America.
- Innovative Applications: Development of autonomous shuttle buses for micro-mobility and specialized transit.
- Evolving Consumer Preferences: Demand for personalized and on-demand transit services integrated with traditional bus routes.
- Retrofitting Services: Offering electric powertrain conversion for existing ICE buses.
Growth Accelerators in the Bus Industry Industry
Several key catalysts are poised to accelerate long-term growth within the Bus Industry. Technological breakthroughs in battery energy density and charging speed will significantly enhance the practicality and affordability of electric buses. Strategic partnerships between bus manufacturers, battery suppliers, charging infrastructure providers, and energy companies are crucial for creating comprehensive ecosystems that support widespread adoption. Furthermore, market expansion strategies that focus on emerging economies, coupled with supportive government policies and incentives, will unlock substantial growth potential. The increasing focus on fleet electrification by public transit authorities and private operators alike serves as a powerful market accelerator.
- Technological Breakthroughs: Advancements in solid-state batteries, hydrogen fuel cell technology, and V2G capabilities.
- Strategic Partnerships: Collaboration between OEMs, battery manufacturers, charging solution providers, and energy utilities.
- Market Expansion Strategies: Targeting new geographic regions and developing tailored solutions for diverse mobility needs.
- Fleet Electrification Mandates: Increasingly stringent regulations and voluntary commitments from large fleet operators.
Key Players Shaping the Bus Industry Market
- Ashok Leyland Limited
- Zhengzhou Yutong Bus Co Ltd
- Anhui Ankai Automobile Co Ltd
- Proterra INC
- Tata Motors Limited
- Daimler Truck Holding AG
- Volvo Group
- NFI Group Inc
- King Long United Automotive Industry Co Ltd
- Byd Auto Industry Company Limited
- Zhongtong Bus Holding Co Ltd
Notable Milestones in Bus Industry Sector
- September 2023: Volvo Energy signed a letter of intent with Connected Energy, aiming to jointly develop battery energy storage systems (BESS), signaling a move towards integrated energy solutions for electric fleets.
- September 2023: Yutong announced the successful shipping of 87 apron buses to Saudi Arabia, marking the largest batch of apron buses exported from China and highlighting the growing global demand for specialized transit vehicles.
- September 2023: Daimler Trucks & Buses US, PACCAR, and Accelera by Cummins announced a partnership to localize battery cell production in the U.S., a significant step towards securing the supply chain for electric trucks and buses in North America.
In-Depth Bus Industry Market Outlook
The future of the Bus Industry is undeniably electric and intelligent. Growth accelerators like ongoing advancements in battery technology and the establishment of robust charging infrastructure will propel the market forward. Strategic alliances between key industry players, such as the collaboration between Volvo Energy and Connected Energy, will foster integrated solutions for a sustainable future. The increasing number of government initiatives and incentives worldwide, coupled with the growing demand for eco-friendly public transportation, will continue to drive the adoption of zero-emission buses. The market outlook is exceptionally positive, with significant opportunities for innovation in autonomous driving, vehicle-to-grid integration, and the development of smart city transit solutions, ensuring a cleaner and more efficient urban mobility landscape.
Bus Industry Segmentation
-
1. Propulsion Type
-
1.1. Hybrid and Electric Vehicles
-
1.1.1. By Fuel Category
- 1.1.1.1. BEV
- 1.1.1.2. FCEV
- 1.1.1.3. HEV
- 1.1.1.4. PHEV
-
1.1.1. By Fuel Category
- 1.2. ICE
-
1.1. Hybrid and Electric Vehicles
Bus Industry Segmentation By Geography
-
1. North America
- 1.1. United States
- 1.2. Canada
- 1.3. Mexico
-
2. South America
- 2.1. Brazil
- 2.2. Argentina
- 2.3. Rest of South America
-
3. Europe
- 3.1. United Kingdom
- 3.2. Germany
- 3.3. France
- 3.4. Italy
- 3.5. Spain
- 3.6. Russia
- 3.7. Benelux
- 3.8. Nordics
- 3.9. Rest of Europe
-
4. Middle East & Africa
- 4.1. Turkey
- 4.2. Israel
- 4.3. GCC
- 4.4. North Africa
- 4.5. South Africa
- 4.6. Rest of Middle East & Africa
-
5. Asia Pacific
- 5.1. China
- 5.2. India
- 5.3. Japan
- 5.4. South Korea
- 5.5. ASEAN
- 5.6. Oceania
- 5.7. Rest of Asia Pacific
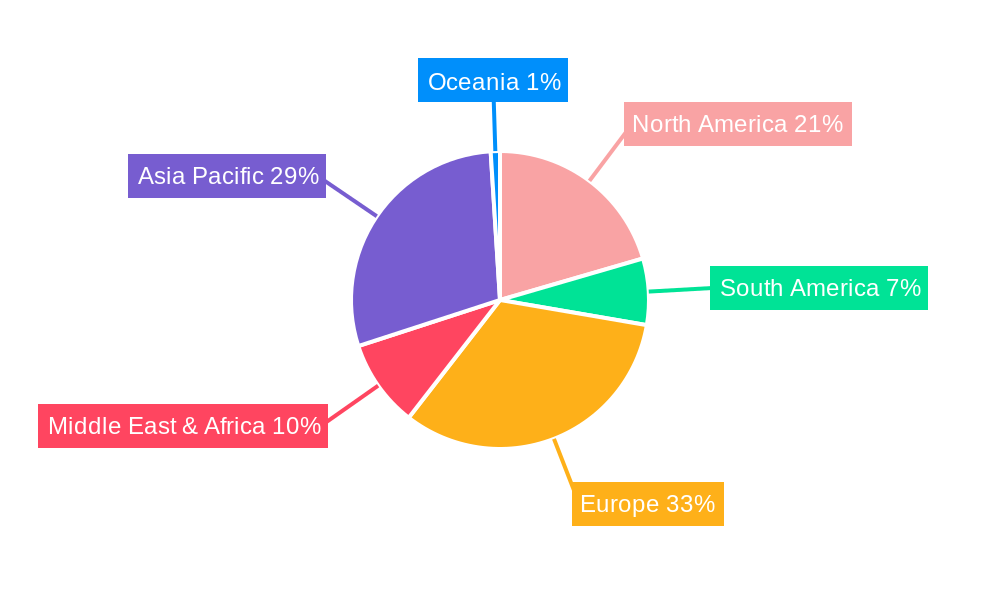
Bus Industry Regional Market Share
Geographic Coverage of Bus Industry
Bus Industry REPORT HIGHLIGHTS
| Aspects | Details |
|---|---|
| Study Period | 2020-2034 |
| Base Year | 2025 |
| Estimated Year | 2026 |
| Forecast Period | 2026-2034 |
| Historical Period | 2020-2025 |
| Growth Rate | CAGR of 7% from 2020-2034 |
| Segmentation |
|
Table of Contents
- 1. Introduction
- 1.1. Research Scope
- 1.2. Market Segmentation
- 1.3. Research Objective
- 1.4. Definitions and Assumptions
- 2. Executive Summary
- 2.1. Market Snapshot
- 3. Market Dynamics
- 3.1. Market Drivers
- 3.2. Market Restrains
- 3.3. Market Trends
- 3.4. Market Opportunities
- 4. Market Factor Analysis
- 4.1. Porters Five Forces
- 4.1.1. Bargaining Power of Suppliers
- 4.1.2. Bargaining Power of Buyers
- 4.1.3. Threat of New Entrants
- 4.1.4. Threat of Substitutes
- 4.1.5. Competitive Rivalry
- 4.2. PESTEL analysis
- 4.3. BCG Analysis
- 4.3.1. Stars (High Growth, High Market Share)
- 4.3.2. Cash Cows (Low Growth, High Market Share)
- 4.3.3. Question Mark (High Growth, Low Market Share)
- 4.3.4. Dogs (Low Growth, Low Market Share)
- 4.4. Ansoff Matrix Analysis
- 4.5. Supply Chain Analysis
- 4.6. Regulatory Landscape
- 4.7. Current Market Potential and Opportunity Assessment (TAM–SAM–SOM Framework)
- 4.8. VDR Analyst Note
- 4.1. Porters Five Forces
- 5. Market Analysis, Insights and Forecast 2021-2033
- 5.1. Market Analysis, Insights and Forecast - by Propulsion Type
- 5.1.1. Hybrid and Electric Vehicles
- 5.1.1.1. By Fuel Category
- 5.1.1.1.1. BEV
- 5.1.1.1.2. FCEV
- 5.1.1.1.3. HEV
- 5.1.1.1.4. PHEV
- 5.1.1.1. By Fuel Category
- 5.1.2. ICE
- 5.1.1. Hybrid and Electric Vehicles
- 5.2. Market Analysis, Insights and Forecast - by Region
- 5.2.1. North America
- 5.2.2. South America
- 5.2.3. Europe
- 5.2.4. Middle East & Africa
- 5.2.5. Asia Pacific
- 5.1. Market Analysis, Insights and Forecast - by Propulsion Type
- 6. Global Bus Industry Analysis, Insights and Forecast, 2021-2033
- 6.1. Market Analysis, Insights and Forecast - by Propulsion Type
- 6.1.1. Hybrid and Electric Vehicles
- 6.1.1.1. By Fuel Category
- 6.1.1.1.1. BEV
- 6.1.1.1.2. FCEV
- 6.1.1.1.3. HEV
- 6.1.1.1.4. PHEV
- 6.1.1.1. By Fuel Category
- 6.1.2. ICE
- 6.1.1. Hybrid and Electric Vehicles
- 6.1. Market Analysis, Insights and Forecast - by Propulsion Type
- 7. North America Bus Industry Analysis, Insights and Forecast, 2021-2033
- 7.1. Market Analysis, Insights and Forecast - by Propulsion Type
- 7.1.1. Hybrid and Electric Vehicles
- 7.1.1.1. By Fuel Category
- 7.1.1.1.1. BEV
- 7.1.1.1.2. FCEV
- 7.1.1.1.3. HEV
- 7.1.1.1.4. PHEV
- 7.1.1.1. By Fuel Category
- 7.1.2. ICE
- 7.1.1. Hybrid and Electric Vehicles
- 7.1. Market Analysis, Insights and Forecast - by Propulsion Type
- 8. South America Bus Industry Analysis, Insights and Forecast, 2021-2033
- 8.1. Market Analysis, Insights and Forecast - by Propulsion Type
- 8.1.1. Hybrid and Electric Vehicles
- 8.1.1.1. By Fuel Category
- 8.1.1.1.1. BEV
- 8.1.1.1.2. FCEV
- 8.1.1.1.3. HEV
- 8.1.1.1.4. PHEV
- 8.1.1.1. By Fuel Category
- 8.1.2. ICE
- 8.1.1. Hybrid and Electric Vehicles
- 8.1. Market Analysis, Insights and Forecast - by Propulsion Type
- 9. Europe Bus Industry Analysis, Insights and Forecast, 2021-2033
- 9.1. Market Analysis, Insights and Forecast - by Propulsion Type
- 9.1.1. Hybrid and Electric Vehicles
- 9.1.1.1. By Fuel Category
- 9.1.1.1.1. BEV
- 9.1.1.1.2. FCEV
- 9.1.1.1.3. HEV
- 9.1.1.1.4. PHEV
- 9.1.1.1. By Fuel Category
- 9.1.2. ICE
- 9.1.1. Hybrid and Electric Vehicles
- 9.1. Market Analysis, Insights and Forecast - by Propulsion Type
- 10. Middle East & Africa Bus Industry Analysis, Insights and Forecast, 2021-2033
- 10.1. Market Analysis, Insights and Forecast - by Propulsion Type
- 10.1.1. Hybrid and Electric Vehicles
- 10.1.1.1. By Fuel Category
- 10.1.1.1.1. BEV
- 10.1.1.1.2. FCEV
- 10.1.1.1.3. HEV
- 10.1.1.1.4. PHEV
- 10.1.1.1. By Fuel Category
- 10.1.2. ICE
- 10.1.1. Hybrid and Electric Vehicles
- 10.1. Market Analysis, Insights and Forecast - by Propulsion Type
- 11. Asia Pacific Bus Industry Analysis, Insights and Forecast, 2021-2033
- 11.1. Market Analysis, Insights and Forecast - by Propulsion Type
- 11.1.1. Hybrid and Electric Vehicles
- 11.1.1.1. By Fuel Category
- 11.1.1.1.1. BEV
- 11.1.1.1.2. FCEV
- 11.1.1.1.3. HEV
- 11.1.1.1.4. PHEV
- 11.1.1.1. By Fuel Category
- 11.1.2. ICE
- 11.1.1. Hybrid and Electric Vehicles
- 11.1. Market Analysis, Insights and Forecast - by Propulsion Type
- 12. Competitive Analysis
- 12.1. Company Profiles
- 12.1.1 Ashok Leyland Limited
- 12.1.1.1. Company Overview
- 12.1.1.2. Products
- 12.1.1.3. Company Financials
- 12.1.1.4. SWOT Analysis
- 12.1.2 Zhengzhou Yutong Bus Co Ltd
- 12.1.2.1. Company Overview
- 12.1.2.2. Products
- 12.1.2.3. Company Financials
- 12.1.2.4. SWOT Analysis
- 12.1.3 Anhui Ankai Automobile Co Ltd
- 12.1.3.1. Company Overview
- 12.1.3.2. Products
- 12.1.3.3. Company Financials
- 12.1.3.4. SWOT Analysis
- 12.1.4 Proterra INC
- 12.1.4.1. Company Overview
- 12.1.4.2. Products
- 12.1.4.3. Company Financials
- 12.1.4.4. SWOT Analysis
- 12.1.5 Tata Motors Limited
- 12.1.5.1. Company Overview
- 12.1.5.2. Products
- 12.1.5.3. Company Financials
- 12.1.5.4. SWOT Analysis
- 12.1.6 Daimler Truck Holding AG
- 12.1.6.1. Company Overview
- 12.1.6.2. Products
- 12.1.6.3. Company Financials
- 12.1.6.4. SWOT Analysis
- 12.1.7 Volvo Group
- 12.1.7.1. Company Overview
- 12.1.7.2. Products
- 12.1.7.3. Company Financials
- 12.1.7.4. SWOT Analysis
- 12.1.8 NFI Group Inc
- 12.1.8.1. Company Overview
- 12.1.8.2. Products
- 12.1.8.3. Company Financials
- 12.1.8.4. SWOT Analysis
- 12.1.9 King Long United Automotive Industry Co Ltd
- 12.1.9.1. Company Overview
- 12.1.9.2. Products
- 12.1.9.3. Company Financials
- 12.1.9.4. SWOT Analysis
- 12.1.10 Byd Auto Industry Company Limited
- 12.1.10.1. Company Overview
- 12.1.10.2. Products
- 12.1.10.3. Company Financials
- 12.1.10.4. SWOT Analysis
- 12.1.11 Zhongtong Bus Holding Co Ltd
- 12.1.11.1. Company Overview
- 12.1.11.2. Products
- 12.1.11.3. Company Financials
- 12.1.11.4. SWOT Analysis
- 12.1.1 Ashok Leyland Limited
- 12.2. Market Entropy
- 12.2.1 Company's Key Areas Served
- 12.2.2 Recent Developments
- 12.3. Company Market Share Analysis 2025
- 12.3.1 Top 5 Companies Market Share Analysis
- 12.3.2 Top 3 Companies Market Share Analysis
- 12.4. List of Potential Customers
- 13. Research Methodology
List of Figures
- Figure 1: Global Bus Industry Revenue Breakdown (billion, %) by Region 2025 & 2033
- Figure 2: North America Bus Industry Revenue (billion), by Propulsion Type 2025 & 2033
- Figure 3: North America Bus Industry Revenue Share (%), by Propulsion Type 2025 & 2033
- Figure 4: North America Bus Industry Revenue (billion), by Country 2025 & 2033
- Figure 5: North America Bus Industry Revenue Share (%), by Country 2025 & 2033
- Figure 6: South America Bus Industry Revenue (billion), by Propulsion Type 2025 & 2033
- Figure 7: South America Bus Industry Revenue Share (%), by Propulsion Type 2025 & 2033
- Figure 8: South America Bus Industry Revenue (billion), by Country 2025 & 2033
- Figure 9: South America Bus Industry Revenue Share (%), by Country 2025 & 2033
- Figure 10: Europe Bus Industry Revenue (billion), by Propulsion Type 2025 & 2033
- Figure 11: Europe Bus Industry Revenue Share (%), by Propulsion Type 2025 & 2033
- Figure 12: Europe Bus Industry Revenue (billion), by Country 2025 & 2033
- Figure 13: Europe Bus Industry Revenue Share (%), by Country 2025 & 2033
- Figure 14: Middle East & Africa Bus Industry Revenue (billion), by Propulsion Type 2025 & 2033
- Figure 15: Middle East & Africa Bus Industry Revenue Share (%), by Propulsion Type 2025 & 2033
- Figure 16: Middle East & Africa Bus Industry Revenue (billion), by Country 2025 & 2033
- Figure 17: Middle East & Africa Bus Industry Revenue Share (%), by Country 2025 & 2033
- Figure 18: Asia Pacific Bus Industry Revenue (billion), by Propulsion Type 2025 & 2033
- Figure 19: Asia Pacific Bus Industry Revenue Share (%), by Propulsion Type 2025 & 2033
- Figure 20: Asia Pacific Bus Industry Revenue (billion), by Country 2025 & 2033
- Figure 21: Asia Pacific Bus Industry Revenue Share (%), by Country 2025 & 2033
List of Tables
- Table 1: Global Bus Industry Revenue billion Forecast, by Propulsion Type 2020 & 2033
- Table 2: Global Bus Industry Revenue billion Forecast, by Region 2020 & 2033
- Table 3: Global Bus Industry Revenue billion Forecast, by Propulsion Type 2020 & 2033
- Table 4: Global Bus Industry Revenue billion Forecast, by Country 2020 & 2033
- Table 5: United States Bus Industry Revenue (billion) Forecast, by Application 2020 & 2033
- Table 6: Canada Bus Industry Revenue (billion) Forecast, by Application 2020 & 2033
- Table 7: Mexico Bus Industry Revenue (billion) Forecast, by Application 2020 & 2033
- Table 8: Global Bus Industry Revenue billion Forecast, by Propulsion Type 2020 & 2033
- Table 9: Global Bus Industry Revenue billion Forecast, by Country 2020 & 2033
- Table 10: Brazil Bus Industry Revenue (billion) Forecast, by Application 2020 & 2033
- Table 11: Argentina Bus Industry Revenue (billion) Forecast, by Application 2020 & 2033
- Table 12: Rest of South America Bus Industry Revenue (billion) Forecast, by Application 2020 & 2033
- Table 13: Global Bus Industry Revenue billion Forecast, by Propulsion Type 2020 & 2033
- Table 14: Global Bus Industry Revenue billion Forecast, by Country 2020 & 2033
- Table 15: United Kingdom Bus Industry Revenue (billion) Forecast, by Application 2020 & 2033
- Table 16: Germany Bus Industry Revenue (billion) Forecast, by Application 2020 & 2033
- Table 17: France Bus Industry Revenue (billion) Forecast, by Application 2020 & 2033
- Table 18: Italy Bus Industry Revenue (billion) Forecast, by Application 2020 & 2033
- Table 19: Spain Bus Industry Revenue (billion) Forecast, by Application 2020 & 2033
- Table 20: Russia Bus Industry Revenue (billion) Forecast, by Application 2020 & 2033
- Table 21: Benelux Bus Industry Revenue (billion) Forecast, by Application 2020 & 2033
- Table 22: Nordics Bus Industry Revenue (billion) Forecast, by Application 2020 & 2033
- Table 23: Rest of Europe Bus Industry Revenue (billion) Forecast, by Application 2020 & 2033
- Table 24: Global Bus Industry Revenue billion Forecast, by Propulsion Type 2020 & 2033
- Table 25: Global Bus Industry Revenue billion Forecast, by Country 2020 & 2033
- Table 26: Turkey Bus Industry Revenue (billion) Forecast, by Application 2020 & 2033
- Table 27: Israel Bus Industry Revenue (billion) Forecast, by Application 2020 & 2033
- Table 28: GCC Bus Industry Revenue (billion) Forecast, by Application 2020 & 2033
- Table 29: North Africa Bus Industry Revenue (billion) Forecast, by Application 2020 & 2033
- Table 30: South Africa Bus Industry Revenue (billion) Forecast, by Application 2020 & 2033
- Table 31: Rest of Middle East & Africa Bus Industry Revenue (billion) Forecast, by Application 2020 & 2033
- Table 32: Global Bus Industry Revenue billion Forecast, by Propulsion Type 2020 & 2033
- Table 33: Global Bus Industry Revenue billion Forecast, by Country 2020 & 2033
- Table 34: China Bus Industry Revenue (billion) Forecast, by Application 2020 & 2033
- Table 35: India Bus Industry Revenue (billion) Forecast, by Application 2020 & 2033
- Table 36: Japan Bus Industry Revenue (billion) Forecast, by Application 2020 & 2033
- Table 37: South Korea Bus Industry Revenue (billion) Forecast, by Application 2020 & 2033
- Table 38: ASEAN Bus Industry Revenue (billion) Forecast, by Application 2020 & 2033
- Table 39: Oceania Bus Industry Revenue (billion) Forecast, by Application 2020 & 2033
- Table 40: Rest of Asia Pacific Bus Industry Revenue (billion) Forecast, by Application 2020 & 2033
Frequently Asked Questions
1. What is the projected Compound Annual Growth Rate (CAGR) of the Bus Industry?
The projected CAGR is approximately 7%.
2. Which companies are prominent players in the Bus Industry?
Key companies in the market include Ashok Leyland Limited, Zhengzhou Yutong Bus Co Ltd, Anhui Ankai Automobile Co Ltd, Proterra INC, Tata Motors Limited, Daimler Truck Holding AG, Volvo Group, NFI Group Inc, King Long United Automotive Industry Co Ltd, Byd Auto Industry Company Limited, Zhongtong Bus Holding Co Ltd.
3. What are the main segments of the Bus Industry?
The market segments include Propulsion Type.
4. Can you provide details about the market size?
The market size is estimated to be USD 268.68 billion as of 2022.
5. What are some drivers contributing to market growth?
Increasing Air Pollution Awareness and Health Concern is Driving the Demand.
6. What are the notable trends driving market growth?
OTHER KEY INDUSTRY TRENDS COVERED IN THE REPORT.
7. Are there any restraints impacting market growth?
High Cost of Installation Related to Industrial Robots.
8. Can you provide examples of recent developments in the market?
September 2023: Volvo Energy signed a letter of intent with Connected Energy with the ambition to jointly develop a battery energy storage system (BESS).September 2023: Yutong announced that it held a shipping ceremony for 87 apron buses exported from China to Saudi Arabia in the Yutong New Energy Plant. It is the largest batch of apron buses exported from China.September 2023: Daimler Trucks & Buses US, PACCAR, and Accelera by Cummins, the zero-emissions business unit of Cummins Inc., announced they are partnering to localize battery cell production in the U.S.
9. What pricing options are available for accessing the report?
Pricing options include single-user, multi-user, and enterprise licenses priced at USD 3800, USD 4500, and USD 5800 respectively.
10. Is the market size provided in terms of value or volume?
The market size is provided in terms of value, measured in billion.
11. Are there any specific market keywords associated with the report?
Yes, the market keyword associated with the report is "Bus Industry," which aids in identifying and referencing the specific market segment covered.
12. How do I determine which pricing option suits my needs best?
The pricing options vary based on user requirements and access needs. Individual users may opt for single-user licenses, while businesses requiring broader access may choose multi-user or enterprise licenses for cost-effective access to the report.
13. Are there any additional resources or data provided in the Bus Industry report?
While the report offers comprehensive insights, it's advisable to review the specific contents or supplementary materials provided to ascertain if additional resources or data are available.
14. How can I stay updated on further developments or reports in the Bus Industry?
To stay informed about further developments, trends, and reports in the Bus Industry, consider subscribing to industry newsletters, following relevant companies and organizations, or regularly checking reputable industry news sources and publications.
Methodology
Step 1 - Identification of Relevant Samples Size from Population Database


Step 2 - Approaches for Defining Global Market Size (Value, Volume* & Price*)

Note*: In applicable scenarios
Step 3 - Data Sources
Primary Research
- Web Analytics
- Survey Reports
- Research Institute
- Latest Research Reports
- Opinion Leaders
Secondary Research
- Annual Reports
- White Paper
- Latest Press Release
- Industry Association
- Paid Database
- Investor Presentations

Step 4 - Data Triangulation
Involves using different sources of information in order to increase the validity of a study
These sources are likely to be stakeholders in a program - participants, other researchers, program staff, other community members, and so on.
Then we put all data in single framework & apply various statistical tools to find out the dynamic on the market.
During the analysis stage, feedback from the stakeholder groups would be compared to determine areas of agreement as well as areas of divergence