

Key Insights
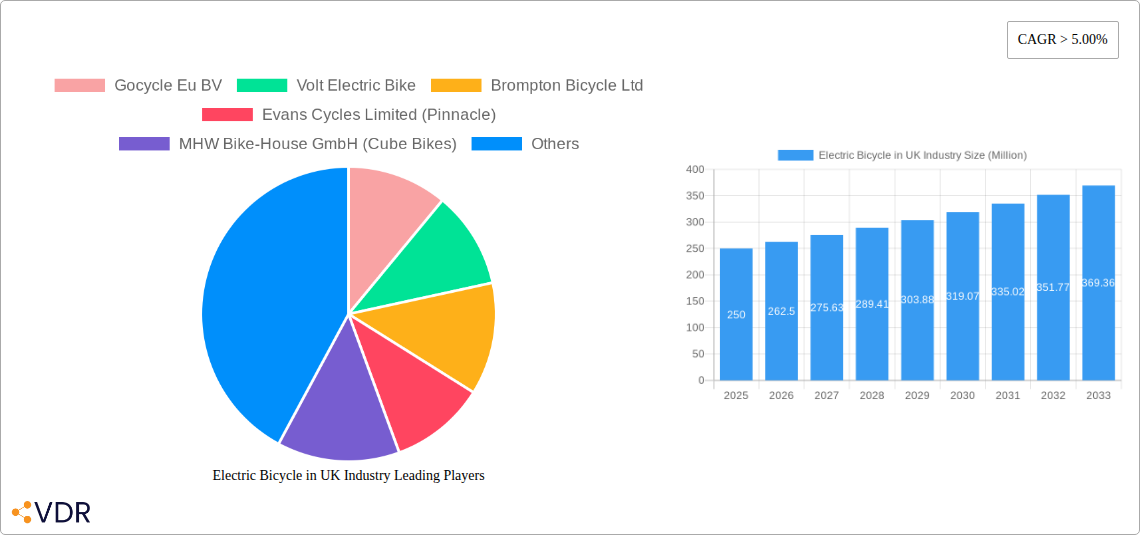
The UK electric bicycle market is experiencing significant expansion, propelled by heightened environmental consciousness, government incentives for sustainable transport, and the growing appeal of e-bikes for commuting and leisure. The market is projected for a Compound Annual Growth Rate (CAGR) of 8%. This growth is attributed to factors such as increasing battery affordability and performance, a wider variety of e-bike designs, and a rising preference for eco-friendly transportation, especially among younger demographics. Key industry players are actively innovating, fostering a competitive landscape and diverse consumer options. Lithium-ion battery-powered e-bikes are anticipated to lead the market due to their superior performance, with growth expected across all application types, particularly in urban and last-mile delivery solutions.
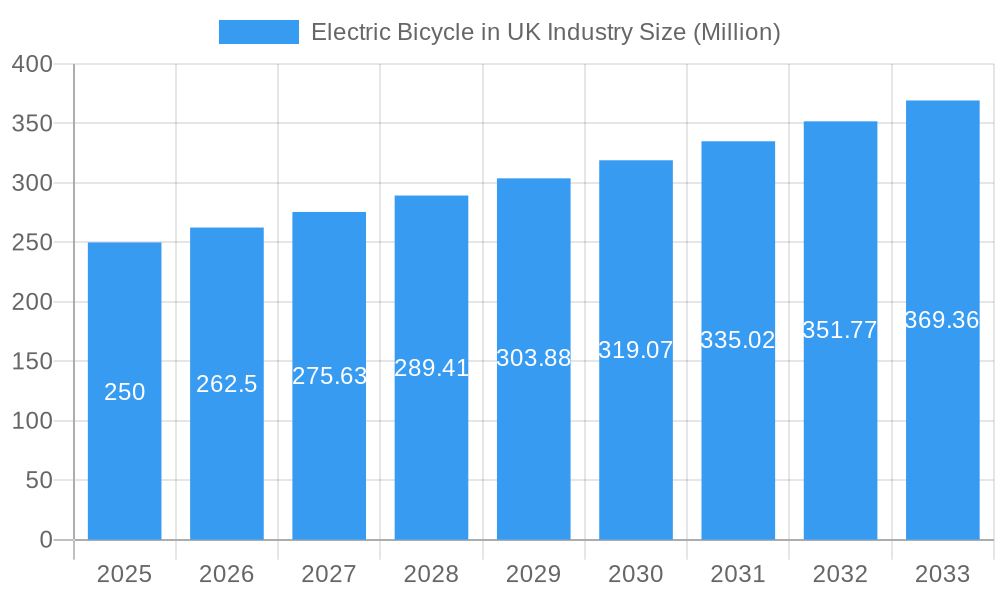
Electric Bicycle in UK Industry Market Size (In Million)
The UK's strategic economic position supports market potential, with government efforts to reduce carbon emissions further stimulating demand. While initial e-bike costs and potential supply chain issues present challenges, the market's trajectory remains highly promising. Substantial growth is anticipated across all segments, driven by urbanization and the increasing need for efficient last-mile solutions. Continued advancement in battery technology, expanded charging infrastructure, and supportive government policies will be crucial for sustained success.
Electric Bicycle in UK Industry Company Market Share
The UK electric bicycle market is expected to reach 305.88 million by 2025, with a CAGR of 8% from the base year 2025.
Electric Bicycle in UK Industry: A Comprehensive Market Report (2019-2033)
This comprehensive report provides an in-depth analysis of the UK electric bicycle market, covering market dynamics, growth trends, key players, and future outlook. The study period spans from 2019 to 2033, with a base year of 2025 and a forecast period from 2025 to 2033. This report is essential for industry professionals, investors, and anyone seeking to understand this rapidly evolving market. It leverages extensive data analysis to provide actionable insights for strategic decision-making.
Electric Bicycle in UK Industry Market Dynamics & Structure
The UK electric bicycle market exhibits a dynamic interplay of factors shaping its structure and growth. Market concentration is moderate, with a mix of established players like Brompton Bicycle Ltd and emerging brands. Technological innovation, particularly in battery technology and motor efficiency, is a key driver. Stringent regulatory frameworks regarding safety and emissions influence market dynamics. Competitive substitutes, such as traditional bicycles and other forms of micro-mobility, exert pressure. End-user demographics are shifting towards a wider range of ages and income levels. M&A activity remains relatively low (xx deals in the historical period), yet consolidation is expected to increase with market maturation.
- Market Concentration: Moderate, with no single dominant player commanding a significant majority.
- Technological Innovation: Focus on improved battery life, lightweight designs, and integrated technologies.
- Regulatory Frameworks: Safety standards and emission regulations impact product design and market access.
- Competitive Substitutes: Traditional bicycles, e-scooters, and other personal transport options.
- End-User Demographics: Expanding beyond core demographics to include older adults and families.
- M&A Activity: Low historically (xx deals 2019-2024), projected increase to xx deals by 2033.
Electric Bicycle in UK Industry Growth Trends & Insights
The UK electric bicycle market has witnessed substantial growth throughout the historical period (2019-2024), exhibiting a CAGR of xx%. This growth is propelled by increasing environmental awareness, government incentives promoting sustainable transportation, and improvements in e-bike technology leading to enhanced performance and affordability. Market penetration stands at xx% in 2025, projected to reach xx% by 2033. Consumer behavior is shifting towards practicality and convenience, with e-bikes increasingly viewed as viable alternatives to cars for short-distance commutes. Technological disruptions such as advancements in battery technology and smart connectivity are further stimulating market expansion.
Dominant Regions, Countries, or Segments in Electric Bicycle in UK Industry
The city/urban segment dominates the UK electric bicycle market, accounting for xx% of total sales in 2025. This is primarily due to the suitability of e-bikes for navigating congested urban areas and the growing popularity of cycling as a mode of commuting. The Lithium-ion battery segment holds the largest market share (xx%) within the battery type segment owing to its superior energy density and lifespan compared to other battery types. The Pedal-Assisted propulsion type leads in the market, capturing xx% share due to its balanced performance and extended range.
- City/Urban Segment Dominance: Driven by suitability for urban commutes and rising popularity of cycling.
- Lithium-ion Battery Predominance: Superior energy density and lifespan compared to lead-acid alternatives.
- Pedal-Assisted Propulsion Type Leadership: Offers a balance of performance and range, preferred by a wider user base.
- Regional Variations: London and other major cities exhibit higher adoption rates due to better infrastructure and government incentives.
Electric Bicycle in UK Industry Product Landscape
The UK electric bicycle market showcases a diverse range of products catering to varying needs and preferences. Innovation is focused on enhancing battery life, integrating smart technology, and improving overall ride comfort and safety. Manufacturers are emphasizing lighter weight frames, improved motor efficiency, and advanced display systems to improve the user experience. Key differentiators include sophisticated suspension systems, integrated lighting, and innovative designs. The adoption of smart connectivity and GPS tracking features is also increasing.
Key Drivers, Barriers & Challenges in Electric Bicycle in UK Industry
Key Drivers:
- Government incentives and subsidies are boosting adoption rates.
- Growing environmental awareness is promoting sustainable transportation.
- Technological advancements are enhancing e-bike performance and affordability.
- Improved cycling infrastructure is making e-bike commuting safer and more convenient.
Key Challenges and Restraints:
- High initial purchase costs compared to traditional bicycles.
- Range anxiety related to battery life remains a concern for some consumers.
- Lack of charging infrastructure in certain areas poses a limitation.
- Competition from other micro-mobility solutions (e.g., e-scooters).
Emerging Opportunities in Electric Bicycle in UK Industry
- Growing demand for cargo e-bikes for delivery services and family use.
- Expansion into niche segments, such as e-bikes for specific activities (e.g., off-road).
- Increasing integration of smart technologies and connectivity features.
- Development of subscription models and rental programs to enhance accessibility.
Growth Accelerators in the Electric Bicycle in UK Industry Industry
The long-term growth of the UK electric bicycle market is fueled by continuous technological advancements, strategic partnerships between manufacturers and infrastructure providers, and expansion into new geographic markets and user segments. Governments will play a pivotal role in accelerating growth by providing ongoing support.
Key Players Shaping the Electric Bicycle in UK Industry Market
- Gocycle Eu BV
- Volt Electric Bike
- Brompton Bicycle Ltd
- Evans Cycles Limited (Pinnacle)
- MHW Bike-House GmbH (Cube Bikes)
- Raleigh Bicycle Company
- Tandem Group Cycles (Falcon Cycles)
- Giant Manufacturing Co Ltd
- POWABYKE UK LIMITED (Powabyke)
- Trek Bicycle Corporation
- Tandem Group Cycles (DAWES)
Notable Milestones in Electric Bicycle in UK Industry Sector
- November 2022: The Tandem Group opens an eMobility sales and demo showroom in Birmingham.
- November 2022: Giant unveils the Stormguard E+ full-suspension e-bike.
- December 2022: Volt Bikes and City AM collaborate on an ESG-focused project.
In-Depth Electric Bicycle in UK Industry Market Outlook
The UK electric bicycle market is poised for sustained growth over the forecast period (2025-2033), driven by technological innovations, supportive government policies, and evolving consumer preferences. Strategic partnerships, focused marketing initiatives, and diversification into new segments will be crucial for market players. The market's long-term potential is significant, with opportunities for both established and new entrants to capture market share.
Electric Bicycle in UK Industry Segmentation
-
1. Propulsion Type
- 1.1. Pedal Assisted
- 1.2. Speed Pedelec
- 1.3. Throttle Assisted
-
2. Application Type
- 2.1. Cargo/Utility
- 2.2. City/Urban
- 2.3. Trekking
-
3. Battery Type
- 3.1. Lead Acid Battery
- 3.2. Lithium-ion Battery
- 3.3. Others
Electric Bicycle in UK Industry Segmentation By Geography
-
1. North America
- 1.1. United States
- 1.2. Canada
- 1.3. Mexico
-
2. South America
- 2.1. Brazil
- 2.2. Argentina
- 2.3. Rest of South America
-
3. Europe
- 3.1. United Kingdom
- 3.2. Germany
- 3.3. France
- 3.4. Italy
- 3.5. Spain
- 3.6. Russia
- 3.7. Benelux
- 3.8. Nordics
- 3.9. Rest of Europe
-
4. Middle East & Africa
- 4.1. Turkey
- 4.2. Israel
- 4.3. GCC
- 4.4. North Africa
- 4.5. South Africa
- 4.6. Rest of Middle East & Africa
-
5. Asia Pacific
- 5.1. China
- 5.2. India
- 5.3. Japan
- 5.4. South Korea
- 5.5. ASEAN
- 5.6. Oceania
- 5.7. Rest of Asia Pacific
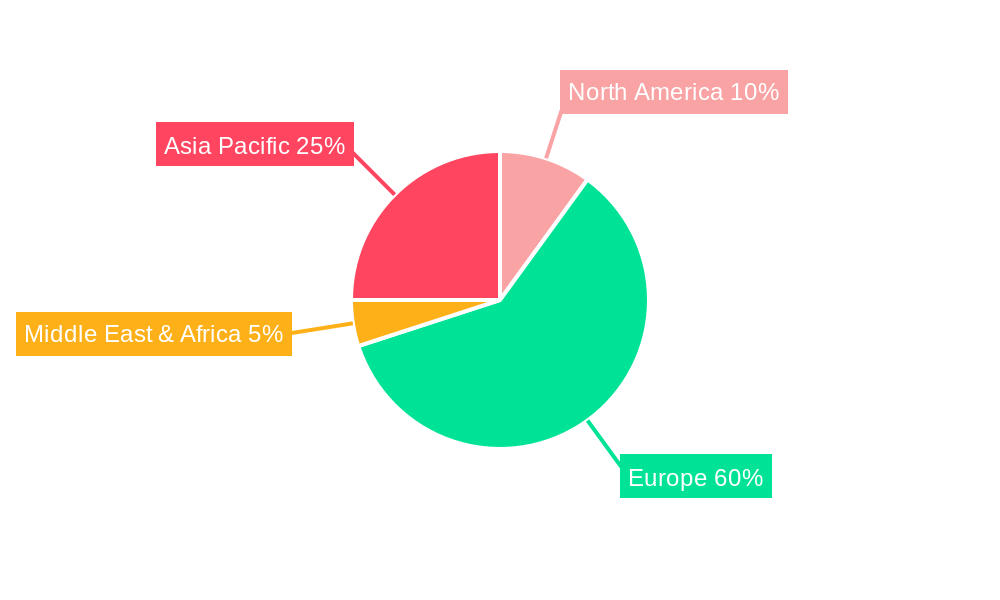
Electric Bicycle in UK Industry Regional Market Share
Geographic Coverage of Electric Bicycle in UK Industry
Electric Bicycle in UK Industry REPORT HIGHLIGHTS
| Aspects | Details |
|---|---|
| Study Period | 2020-2034 |
| Base Year | 2025 |
| Estimated Year | 2026 |
| Forecast Period | 2026-2034 |
| Historical Period | 2020-2025 |
| Growth Rate | CAGR of 8% from 2020-2034 |
| Segmentation |
|
Table of Contents
- 1. Introduction
- 1.1. Research Scope
- 1.2. Market Segmentation
- 1.3. Research Objective
- 1.4. Definitions and Assumptions
- 2. Executive Summary
- 2.1. Market Snapshot
- 3. Market Dynamics
- 3.1. Market Drivers
- 3.2. Market Restrains
- 3.3. Market Trends
- 3.4. Market Opportunities
- 4. Market Factor Analysis
- 4.1. Porters Five Forces
- 4.1.1. Bargaining Power of Suppliers
- 4.1.2. Bargaining Power of Buyers
- 4.1.3. Threat of New Entrants
- 4.1.4. Threat of Substitutes
- 4.1.5. Competitive Rivalry
- 4.2. PESTEL analysis
- 4.3. BCG Analysis
- 4.3.1. Stars (High Growth, High Market Share)
- 4.3.2. Cash Cows (Low Growth, High Market Share)
- 4.3.3. Question Mark (High Growth, Low Market Share)
- 4.3.4. Dogs (Low Growth, Low Market Share)
- 4.4. Ansoff Matrix Analysis
- 4.5. Supply Chain Analysis
- 4.6. Regulatory Landscape
- 4.7. Current Market Potential and Opportunity Assessment (TAM–SAM–SOM Framework)
- 4.8. VDR Analyst Note
- 4.1. Porters Five Forces
- 5. Market Analysis, Insights and Forecast 2021-2033
- 5.1. Market Analysis, Insights and Forecast - by Propulsion Type
- 5.1.1. Pedal Assisted
- 5.1.2. Speed Pedelec
- 5.1.3. Throttle Assisted
- 5.2. Market Analysis, Insights and Forecast - by Application Type
- 5.2.1. Cargo/Utility
- 5.2.2. City/Urban
- 5.2.3. Trekking
- 5.3. Market Analysis, Insights and Forecast - by Battery Type
- 5.3.1. Lead Acid Battery
- 5.3.2. Lithium-ion Battery
- 5.3.3. Others
- 5.4. Market Analysis, Insights and Forecast - by Region
- 5.4.1. North America
- 5.4.2. South America
- 5.4.3. Europe
- 5.4.4. Middle East & Africa
- 5.4.5. Asia Pacific
- 5.1. Market Analysis, Insights and Forecast - by Propulsion Type
- 6. Global Electric Bicycle in UK Industry Analysis, Insights and Forecast, 2021-2033
- 6.1. Market Analysis, Insights and Forecast - by Propulsion Type
- 6.1.1. Pedal Assisted
- 6.1.2. Speed Pedelec
- 6.1.3. Throttle Assisted
- 6.2. Market Analysis, Insights and Forecast - by Application Type
- 6.2.1. Cargo/Utility
- 6.2.2. City/Urban
- 6.2.3. Trekking
- 6.3. Market Analysis, Insights and Forecast - by Battery Type
- 6.3.1. Lead Acid Battery
- 6.3.2. Lithium-ion Battery
- 6.3.3. Others
- 6.1. Market Analysis, Insights and Forecast - by Propulsion Type
- 7. North America Electric Bicycle in UK Industry Analysis, Insights and Forecast, 2021-2033
- 7.1. Market Analysis, Insights and Forecast - by Propulsion Type
- 7.1.1. Pedal Assisted
- 7.1.2. Speed Pedelec
- 7.1.3. Throttle Assisted
- 7.2. Market Analysis, Insights and Forecast - by Application Type
- 7.2.1. Cargo/Utility
- 7.2.2. City/Urban
- 7.2.3. Trekking
- 7.3. Market Analysis, Insights and Forecast - by Battery Type
- 7.3.1. Lead Acid Battery
- 7.3.2. Lithium-ion Battery
- 7.3.3. Others
- 7.1. Market Analysis, Insights and Forecast - by Propulsion Type
- 8. South America Electric Bicycle in UK Industry Analysis, Insights and Forecast, 2021-2033
- 8.1. Market Analysis, Insights and Forecast - by Propulsion Type
- 8.1.1. Pedal Assisted
- 8.1.2. Speed Pedelec
- 8.1.3. Throttle Assisted
- 8.2. Market Analysis, Insights and Forecast - by Application Type
- 8.2.1. Cargo/Utility
- 8.2.2. City/Urban
- 8.2.3. Trekking
- 8.3. Market Analysis, Insights and Forecast - by Battery Type
- 8.3.1. Lead Acid Battery
- 8.3.2. Lithium-ion Battery
- 8.3.3. Others
- 8.1. Market Analysis, Insights and Forecast - by Propulsion Type
- 9. Europe Electric Bicycle in UK Industry Analysis, Insights and Forecast, 2021-2033
- 9.1. Market Analysis, Insights and Forecast - by Propulsion Type
- 9.1.1. Pedal Assisted
- 9.1.2. Speed Pedelec
- 9.1.3. Throttle Assisted
- 9.2. Market Analysis, Insights and Forecast - by Application Type
- 9.2.1. Cargo/Utility
- 9.2.2. City/Urban
- 9.2.3. Trekking
- 9.3. Market Analysis, Insights and Forecast - by Battery Type
- 9.3.1. Lead Acid Battery
- 9.3.2. Lithium-ion Battery
- 9.3.3. Others
- 9.1. Market Analysis, Insights and Forecast - by Propulsion Type
- 10. Middle East & Africa Electric Bicycle in UK Industry Analysis, Insights and Forecast, 2021-2033
- 10.1. Market Analysis, Insights and Forecast - by Propulsion Type
- 10.1.1. Pedal Assisted
- 10.1.2. Speed Pedelec
- 10.1.3. Throttle Assisted
- 10.2. Market Analysis, Insights and Forecast - by Application Type
- 10.2.1. Cargo/Utility
- 10.2.2. City/Urban
- 10.2.3. Trekking
- 10.3. Market Analysis, Insights and Forecast - by Battery Type
- 10.3.1. Lead Acid Battery
- 10.3.2. Lithium-ion Battery
- 10.3.3. Others
- 10.1. Market Analysis, Insights and Forecast - by Propulsion Type
- 11. Asia Pacific Electric Bicycle in UK Industry Analysis, Insights and Forecast, 2021-2033
- 11.1. Market Analysis, Insights and Forecast - by Propulsion Type
- 11.1.1. Pedal Assisted
- 11.1.2. Speed Pedelec
- 11.1.3. Throttle Assisted
- 11.2. Market Analysis, Insights and Forecast - by Application Type
- 11.2.1. Cargo/Utility
- 11.2.2. City/Urban
- 11.2.3. Trekking
- 11.3. Market Analysis, Insights and Forecast - by Battery Type
- 11.3.1. Lead Acid Battery
- 11.3.2. Lithium-ion Battery
- 11.3.3. Others
- 11.1. Market Analysis, Insights and Forecast - by Propulsion Type
- 12. Competitive Analysis
- 12.1. Company Profiles
- 12.1.1 Gocycle Eu BV
- 12.1.1.1. Company Overview
- 12.1.1.2. Products
- 12.1.1.3. Company Financials
- 12.1.1.4. SWOT Analysis
- 12.1.2 Volt Electric Bike
- 12.1.2.1. Company Overview
- 12.1.2.2. Products
- 12.1.2.3. Company Financials
- 12.1.2.4. SWOT Analysis
- 12.1.3 Brompton Bicycle Ltd
- 12.1.3.1. Company Overview
- 12.1.3.2. Products
- 12.1.3.3. Company Financials
- 12.1.3.4. SWOT Analysis
- 12.1.4 Evans Cycles Limited (Pinnacle)
- 12.1.4.1. Company Overview
- 12.1.4.2. Products
- 12.1.4.3. Company Financials
- 12.1.4.4. SWOT Analysis
- 12.1.5 MHW Bike-House GmbH (Cube Bikes)
- 12.1.5.1. Company Overview
- 12.1.5.2. Products
- 12.1.5.3. Company Financials
- 12.1.5.4. SWOT Analysis
- 12.1.6 Raleigh Bicycle Company
- 12.1.6.1. Company Overview
- 12.1.6.2. Products
- 12.1.6.3. Company Financials
- 12.1.6.4. SWOT Analysis
- 12.1.7 Tandem Group Cycles (Falcon Cycles)
- 12.1.7.1. Company Overview
- 12.1.7.2. Products
- 12.1.7.3. Company Financials
- 12.1.7.4. SWOT Analysis
- 12.1.8 Giant Manufacturing Co Ltd
- 12.1.8.1. Company Overview
- 12.1.8.2. Products
- 12.1.8.3. Company Financials
- 12.1.8.4. SWOT Analysis
- 12.1.9 POWABYKE UK LIMITED (Powabyke)
- 12.1.9.1. Company Overview
- 12.1.9.2. Products
- 12.1.9.3. Company Financials
- 12.1.9.4. SWOT Analysis
- 12.1.10 Trek Bicycle Corporation
- 12.1.10.1. Company Overview
- 12.1.10.2. Products
- 12.1.10.3. Company Financials
- 12.1.10.4. SWOT Analysis
- 12.1.11 Tandem Group Cycles (DAWES)
- 12.1.11.1. Company Overview
- 12.1.11.2. Products
- 12.1.11.3. Company Financials
- 12.1.11.4. SWOT Analysis
- 12.1.1 Gocycle Eu BV
- 12.2. Market Entropy
- 12.2.1 Company's Key Areas Served
- 12.2.2 Recent Developments
- 12.3. Company Market Share Analysis 2025
- 12.3.1 Top 5 Companies Market Share Analysis
- 12.3.2 Top 3 Companies Market Share Analysis
- 12.4. List of Potential Customers
- 13. Research Methodology
List of Figures
- Figure 1: Global Electric Bicycle in UK Industry Revenue Breakdown (million, %) by Region 2025 & 2033
- Figure 2: North America Electric Bicycle in UK Industry Revenue (million), by Propulsion Type 2025 & 2033
- Figure 3: North America Electric Bicycle in UK Industry Revenue Share (%), by Propulsion Type 2025 & 2033
- Figure 4: North America Electric Bicycle in UK Industry Revenue (million), by Application Type 2025 & 2033
- Figure 5: North America Electric Bicycle in UK Industry Revenue Share (%), by Application Type 2025 & 2033
- Figure 6: North America Electric Bicycle in UK Industry Revenue (million), by Battery Type 2025 & 2033
- Figure 7: North America Electric Bicycle in UK Industry Revenue Share (%), by Battery Type 2025 & 2033
- Figure 8: North America Electric Bicycle in UK Industry Revenue (million), by Country 2025 & 2033
- Figure 9: North America Electric Bicycle in UK Industry Revenue Share (%), by Country 2025 & 2033
- Figure 10: South America Electric Bicycle in UK Industry Revenue (million), by Propulsion Type 2025 & 2033
- Figure 11: South America Electric Bicycle in UK Industry Revenue Share (%), by Propulsion Type 2025 & 2033
- Figure 12: South America Electric Bicycle in UK Industry Revenue (million), by Application Type 2025 & 2033
- Figure 13: South America Electric Bicycle in UK Industry Revenue Share (%), by Application Type 2025 & 2033
- Figure 14: South America Electric Bicycle in UK Industry Revenue (million), by Battery Type 2025 & 2033
- Figure 15: South America Electric Bicycle in UK Industry Revenue Share (%), by Battery Type 2025 & 2033
- Figure 16: South America Electric Bicycle in UK Industry Revenue (million), by Country 2025 & 2033
- Figure 17: South America Electric Bicycle in UK Industry Revenue Share (%), by Country 2025 & 2033
- Figure 18: Europe Electric Bicycle in UK Industry Revenue (million), by Propulsion Type 2025 & 2033
- Figure 19: Europe Electric Bicycle in UK Industry Revenue Share (%), by Propulsion Type 2025 & 2033
- Figure 20: Europe Electric Bicycle in UK Industry Revenue (million), by Application Type 2025 & 2033
- Figure 21: Europe Electric Bicycle in UK Industry Revenue Share (%), by Application Type 2025 & 2033
- Figure 22: Europe Electric Bicycle in UK Industry Revenue (million), by Battery Type 2025 & 2033
- Figure 23: Europe Electric Bicycle in UK Industry Revenue Share (%), by Battery Type 2025 & 2033
- Figure 24: Europe Electric Bicycle in UK Industry Revenue (million), by Country 2025 & 2033
- Figure 25: Europe Electric Bicycle in UK Industry Revenue Share (%), by Country 2025 & 2033
- Figure 26: Middle East & Africa Electric Bicycle in UK Industry Revenue (million), by Propulsion Type 2025 & 2033
- Figure 27: Middle East & Africa Electric Bicycle in UK Industry Revenue Share (%), by Propulsion Type 2025 & 2033
- Figure 28: Middle East & Africa Electric Bicycle in UK Industry Revenue (million), by Application Type 2025 & 2033
- Figure 29: Middle East & Africa Electric Bicycle in UK Industry Revenue Share (%), by Application Type 2025 & 2033
- Figure 30: Middle East & Africa Electric Bicycle in UK Industry Revenue (million), by Battery Type 2025 & 2033
- Figure 31: Middle East & Africa Electric Bicycle in UK Industry Revenue Share (%), by Battery Type 2025 & 2033
- Figure 32: Middle East & Africa Electric Bicycle in UK Industry Revenue (million), by Country 2025 & 2033
- Figure 33: Middle East & Africa Electric Bicycle in UK Industry Revenue Share (%), by Country 2025 & 2033
- Figure 34: Asia Pacific Electric Bicycle in UK Industry Revenue (million), by Propulsion Type 2025 & 2033
- Figure 35: Asia Pacific Electric Bicycle in UK Industry Revenue Share (%), by Propulsion Type 2025 & 2033
- Figure 36: Asia Pacific Electric Bicycle in UK Industry Revenue (million), by Application Type 2025 & 2033
- Figure 37: Asia Pacific Electric Bicycle in UK Industry Revenue Share (%), by Application Type 2025 & 2033
- Figure 38: Asia Pacific Electric Bicycle in UK Industry Revenue (million), by Battery Type 2025 & 2033
- Figure 39: Asia Pacific Electric Bicycle in UK Industry Revenue Share (%), by Battery Type 2025 & 2033
- Figure 40: Asia Pacific Electric Bicycle in UK Industry Revenue (million), by Country 2025 & 2033
- Figure 41: Asia Pacific Electric Bicycle in UK Industry Revenue Share (%), by Country 2025 & 2033
List of Tables
- Table 1: Global Electric Bicycle in UK Industry Revenue million Forecast, by Propulsion Type 2020 & 2033
- Table 2: Global Electric Bicycle in UK Industry Revenue million Forecast, by Application Type 2020 & 2033
- Table 3: Global Electric Bicycle in UK Industry Revenue million Forecast, by Battery Type 2020 & 2033
- Table 4: Global Electric Bicycle in UK Industry Revenue million Forecast, by Region 2020 & 2033
- Table 5: Global Electric Bicycle in UK Industry Revenue million Forecast, by Propulsion Type 2020 & 2033
- Table 6: Global Electric Bicycle in UK Industry Revenue million Forecast, by Application Type 2020 & 2033
- Table 7: Global Electric Bicycle in UK Industry Revenue million Forecast, by Battery Type 2020 & 2033
- Table 8: Global Electric Bicycle in UK Industry Revenue million Forecast, by Country 2020 & 2033
- Table 9: United States Electric Bicycle in UK Industry Revenue (million) Forecast, by Application 2020 & 2033
- Table 10: Canada Electric Bicycle in UK Industry Revenue (million) Forecast, by Application 2020 & 2033
- Table 11: Mexico Electric Bicycle in UK Industry Revenue (million) Forecast, by Application 2020 & 2033
- Table 12: Global Electric Bicycle in UK Industry Revenue million Forecast, by Propulsion Type 2020 & 2033
- Table 13: Global Electric Bicycle in UK Industry Revenue million Forecast, by Application Type 2020 & 2033
- Table 14: Global Electric Bicycle in UK Industry Revenue million Forecast, by Battery Type 2020 & 2033
- Table 15: Global Electric Bicycle in UK Industry Revenue million Forecast, by Country 2020 & 2033
- Table 16: Brazil Electric Bicycle in UK Industry Revenue (million) Forecast, by Application 2020 & 2033
- Table 17: Argentina Electric Bicycle in UK Industry Revenue (million) Forecast, by Application 2020 & 2033
- Table 18: Rest of South America Electric Bicycle in UK Industry Revenue (million) Forecast, by Application 2020 & 2033
- Table 19: Global Electric Bicycle in UK Industry Revenue million Forecast, by Propulsion Type 2020 & 2033
- Table 20: Global Electric Bicycle in UK Industry Revenue million Forecast, by Application Type 2020 & 2033
- Table 21: Global Electric Bicycle in UK Industry Revenue million Forecast, by Battery Type 2020 & 2033
- Table 22: Global Electric Bicycle in UK Industry Revenue million Forecast, by Country 2020 & 2033
- Table 23: United Kingdom Electric Bicycle in UK Industry Revenue (million) Forecast, by Application 2020 & 2033
- Table 24: Germany Electric Bicycle in UK Industry Revenue (million) Forecast, by Application 2020 & 2033
- Table 25: France Electric Bicycle in UK Industry Revenue (million) Forecast, by Application 2020 & 2033
- Table 26: Italy Electric Bicycle in UK Industry Revenue (million) Forecast, by Application 2020 & 2033
- Table 27: Spain Electric Bicycle in UK Industry Revenue (million) Forecast, by Application 2020 & 2033
- Table 28: Russia Electric Bicycle in UK Industry Revenue (million) Forecast, by Application 2020 & 2033
- Table 29: Benelux Electric Bicycle in UK Industry Revenue (million) Forecast, by Application 2020 & 2033
- Table 30: Nordics Electric Bicycle in UK Industry Revenue (million) Forecast, by Application 2020 & 2033
- Table 31: Rest of Europe Electric Bicycle in UK Industry Revenue (million) Forecast, by Application 2020 & 2033
- Table 32: Global Electric Bicycle in UK Industry Revenue million Forecast, by Propulsion Type 2020 & 2033
- Table 33: Global Electric Bicycle in UK Industry Revenue million Forecast, by Application Type 2020 & 2033
- Table 34: Global Electric Bicycle in UK Industry Revenue million Forecast, by Battery Type 2020 & 2033
- Table 35: Global Electric Bicycle in UK Industry Revenue million Forecast, by Country 2020 & 2033
- Table 36: Turkey Electric Bicycle in UK Industry Revenue (million) Forecast, by Application 2020 & 2033
- Table 37: Israel Electric Bicycle in UK Industry Revenue (million) Forecast, by Application 2020 & 2033
- Table 38: GCC Electric Bicycle in UK Industry Revenue (million) Forecast, by Application 2020 & 2033
- Table 39: North Africa Electric Bicycle in UK Industry Revenue (million) Forecast, by Application 2020 & 2033
- Table 40: South Africa Electric Bicycle in UK Industry Revenue (million) Forecast, by Application 2020 & 2033
- Table 41: Rest of Middle East & Africa Electric Bicycle in UK Industry Revenue (million) Forecast, by Application 2020 & 2033
- Table 42: Global Electric Bicycle in UK Industry Revenue million Forecast, by Propulsion Type 2020 & 2033
- Table 43: Global Electric Bicycle in UK Industry Revenue million Forecast, by Application Type 2020 & 2033
- Table 44: Global Electric Bicycle in UK Industry Revenue million Forecast, by Battery Type 2020 & 2033
- Table 45: Global Electric Bicycle in UK Industry Revenue million Forecast, by Country 2020 & 2033
- Table 46: China Electric Bicycle in UK Industry Revenue (million) Forecast, by Application 2020 & 2033
- Table 47: India Electric Bicycle in UK Industry Revenue (million) Forecast, by Application 2020 & 2033
- Table 48: Japan Electric Bicycle in UK Industry Revenue (million) Forecast, by Application 2020 & 2033
- Table 49: South Korea Electric Bicycle in UK Industry Revenue (million) Forecast, by Application 2020 & 2033
- Table 50: ASEAN Electric Bicycle in UK Industry Revenue (million) Forecast, by Application 2020 & 2033
- Table 51: Oceania Electric Bicycle in UK Industry Revenue (million) Forecast, by Application 2020 & 2033
- Table 52: Rest of Asia Pacific Electric Bicycle in UK Industry Revenue (million) Forecast, by Application 2020 & 2033
Frequently Asked Questions
1. What is the projected Compound Annual Growth Rate (CAGR) of the Electric Bicycle in UK Industry?
The projected CAGR is approximately 8%.
2. Which companies are prominent players in the Electric Bicycle in UK Industry?
Key companies in the market include Gocycle Eu BV, Volt Electric Bike, Brompton Bicycle Ltd, Evans Cycles Limited (Pinnacle), MHW Bike-House GmbH (Cube Bikes), Raleigh Bicycle Company, Tandem Group Cycles (Falcon Cycles), Giant Manufacturing Co Ltd, POWABYKE UK LIMITED (Powabyke), Trek Bicycle Corporation, Tandem Group Cycles (DAWES).
3. What are the main segments of the Electric Bicycle in UK Industry?
The market segments include Propulsion Type, Application Type, Battery Type.
4. Can you provide details about the market size?
The market size is estimated to be USD 305.88 million as of 2022.
5. What are some drivers contributing to market growth?
The Growth of The Global Automotive Turbocharger Market.
6. What are the notable trends driving market growth?
OTHER KEY INDUSTRY TRENDS COVERED IN THE REPORT.
7. Are there any restraints impacting market growth?
Increasing Complexity of Modern Vehicles.
8. Can you provide examples of recent developments in the market?
December 2022: Volt Bikes and City AM collaborate for the Launch of an ESG-Focused Project. Impact AM is a brand-new division of City AM that specializes in environmental, social, and governance issues.November 2022: The Tandem Group opens eMobility sales and demo showroom, the Launched under the Electric Life banner the space will be found in Birmingham, located off the M6 in Castle Vale.November 2022: The Stormguard E+, a full-suspension e-bike, is unveiled by Giant. The bicycles will be available for purchase in Europe in 2023 and will cost 7,999 Euros for the E+1 and 6,499 Euros for the E+2.
9. What pricing options are available for accessing the report?
Pricing options include single-user, multi-user, and enterprise licenses priced at USD 3800, USD 4500, and USD 5800 respectively.
10. Is the market size provided in terms of value or volume?
The market size is provided in terms of value, measured in million.
11. Are there any specific market keywords associated with the report?
Yes, the market keyword associated with the report is "Electric Bicycle in UK Industry," which aids in identifying and referencing the specific market segment covered.
12. How do I determine which pricing option suits my needs best?
The pricing options vary based on user requirements and access needs. Individual users may opt for single-user licenses, while businesses requiring broader access may choose multi-user or enterprise licenses for cost-effective access to the report.
13. Are there any additional resources or data provided in the Electric Bicycle in UK Industry report?
While the report offers comprehensive insights, it's advisable to review the specific contents or supplementary materials provided to ascertain if additional resources or data are available.
14. How can I stay updated on further developments or reports in the Electric Bicycle in UK Industry?
To stay informed about further developments, trends, and reports in the Electric Bicycle in UK Industry, consider subscribing to industry newsletters, following relevant companies and organizations, or regularly checking reputable industry news sources and publications.
Methodology
Step 1 - Identification of Relevant Samples Size from Population Database


Step 2 - Approaches for Defining Global Market Size (Value, Volume* & Price*)

Note*: In applicable scenarios
Step 3 - Data Sources
Primary Research
- Web Analytics
- Survey Reports
- Research Institute
- Latest Research Reports
- Opinion Leaders
Secondary Research
- Annual Reports
- White Paper
- Latest Press Release
- Industry Association
- Paid Database
- Investor Presentations

Step 4 - Data Triangulation
Involves using different sources of information in order to increase the validity of a study
These sources are likely to be stakeholders in a program - participants, other researchers, program staff, other community members, and so on.
Then we put all data in single framework & apply various statistical tools to find out the dynamic on the market.
During the analysis stage, feedback from the stakeholder groups would be compared to determine areas of agreement as well as areas of divergence