
Key Insights
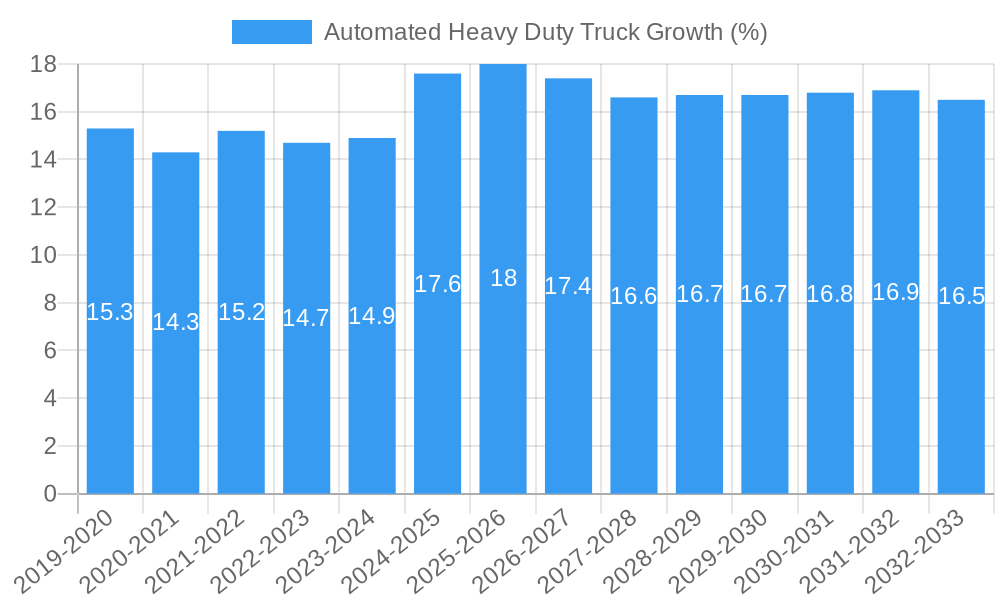
The Automated Heavy Duty Truck market is experiencing robust growth, projected to reach a substantial market size of approximately $25,000 million by 2025, with a remarkable Compound Annual Growth Rate (CAGR) of around 18% during the forecast period of 2025-2033. This significant expansion is primarily fueled by the relentless pursuit of enhanced operational efficiency, reduced labor costs, and improved safety standards within the transportation and logistics sectors. The integration of advanced technologies such as AI, machine learning, lidar, radar, and sophisticated sensor arrays are central to enabling autonomous capabilities in heavy-duty vehicles. Key applications like agriculture, where automated tractors and harvesters are revolutionizing farming practices, and the sprawling transportation and logistics industry, which stands to gain immensely from 24/7 operation and optimized routes, are the primary beneficiaries and growth engines of this burgeoning market. Furthermore, the increasing demand for last-mile delivery solutions and the potential to address driver shortages are further bolstering market adoption.
The market landscape for Automated Heavy Duty Trucks is characterized by intense innovation and strategic collaborations among leading automotive manufacturers, technology providers, and specialized autonomous driving solution developers. Major players like AB Volvo, Daimler AG, PACCAR Inc., and Caterpillar Inc. are heavily investing in R&D to develop and deploy their autonomous truck fleets, while technology giants such as NVIDIA, Intel, and Qualcomm are providing the essential computing power and connectivity solutions. While the potential for widespread adoption is immense, certain restraints persist, including stringent regulatory frameworks, the high initial cost of technology, and public perception regarding the safety and reliability of autonomous vehicles. Nevertheless, the ongoing advancements in sensor technology, artificial intelligence, and vehicle-to-everything (V2X) communication are steadily mitigating these challenges. The market is segmented by powertrain type, with diesel engines continuing to hold a significant share due to their established infrastructure and range capabilities, while electric and hybrid powertrains are gaining traction as sustainability initiatives become paramount. The forecast indicates a growing demand for electric and hybrid automated trucks in the coming years, driven by environmental regulations and corporate sustainability goals.
Comprehensive Report on the Automated Heavy Duty Truck Market: Navigating a Transformative Era (2019-2033)
This in-depth market report delivers an exhaustive analysis of the Automated Heavy Duty Truck market, encompassing a detailed examination of market dynamics, growth trajectories, regional dominance, product innovations, and key industry players. Spanning the historical period of 2019–2024, with a base year of 2025 and a forecast period extending to 2033, this report provides critical insights for stakeholders navigating the burgeoning landscape of autonomous trucking. We cover parent and child market segments, offering a holistic view of the industry's evolution and future potential. All quantitative data is presented in million units.
Automated Heavy Duty Truck Market Dynamics & Structure
The Automated Heavy Duty Truck market is characterized by a dynamic interplay of technological advancement, evolving regulatory frameworks, and strategic consolidation. Market concentration remains moderate, with key players actively investing in R&D to achieve SAE Level 4 and Level 5 autonomy. Technological innovation is primarily driven by advancements in artificial intelligence, sensor fusion, high-definition mapping, and robust V2X communication. Regulatory bodies are increasingly establishing guidelines for testing and deployment, creating a more predictable environment for growth. Competitive product substitutes, primarily conventional heavy-duty trucks, are gradually being challenged by the inherent efficiency and safety benefits of automated solutions. End-user demographics are expanding from early adopters in controlled environments like mines and ports to broader applications in long-haul transportation and logistics. Merger and acquisition (M&A) activity is a significant trend, as established automotive manufacturers and technology giants acquire specialized autonomous driving startups to accelerate market entry and acquire critical intellectual property.
- Technological Innovation Drivers: AI/ML for perception and decision-making, LiDAR, radar, cameras, GNSS, and inertial navigation systems, 5G and edge computing for real-time data processing, robust cybersecurity measures.
- Regulatory Frameworks: Emerging government initiatives for autonomous vehicle testing, safety standards development, and public road deployment protocols.
- End-User Demographics: Logistics companies, mining operations, agriculture, port authorities, construction firms, and parcel delivery services.
- M&A Trends: Strategic acquisitions of autonomous technology developers by traditional OEMs, partnerships between semiconductor companies and truck manufacturers.
Automated Heavy Duty Truck Growth Trends & Insights
The Automated Heavy Duty Truck market is poised for exponential growth, fueled by a confluence of technological breakthroughs, increasing operational efficiencies, and a growing demand for enhanced safety in transportation and logistics. Market size evolution will be marked by a steady upward trajectory, transitioning from nascent adoption in niche applications to widespread integration across various industries. Adoption rates are projected to accelerate as pilot programs demonstrate tangible benefits in terms of reduced operational costs, improved fuel efficiency, and minimized accident rates. Technological disruptions are centered around the maturation of advanced driver-assistance systems (ADAS) paving the way for full autonomy, alongside the development of sophisticated fleet management systems that can seamlessly integrate autonomous trucks. Consumer behavior shifts are evident in the growing acceptance by fleet operators of the long-term economic advantages offered by autonomous solutions, including reduced driver fatigue and the potential to operate vehicles around the clock.
The base year of 2025 is projected to see a global market size of approximately $22,500 million units, with an estimated compound annual growth rate (CAGR) of xx% from 2025 to 2033. This robust growth will be driven by significant investments in research and development, alongside increasing regulatory approvals for autonomous truck operations. The market penetration of Level 4 and Level 5 automated heavy-duty trucks is expected to rise from a minimal xx% in 2025 to an estimated xx% by 2033.
Key growth drivers include the persistent shortage of skilled truck drivers, which automated solutions can help mitigate. Furthermore, the pressure to optimize supply chains and reduce delivery times in the e-commerce boom necessitates more efficient and reliable transportation methods. The development of dedicated autonomous freight corridors and the increasing sophistication of autonomous driving software are further contributing to market expansion. Early adoption will likely be concentrated in regions with favorable regulatory environments and significant trucking infrastructure.
The shift from traditional diesel-powered trucks to electric and hybrid automated heavy-duty trucks is also a critical trend. While diesel will remain a significant segment in the initial forecast period, the long-term sustainability goals and decreasing battery costs will drive a substantial transition towards electric powertrains, particularly in urban and regional logistics. The operational cost savings associated with autonomous electric trucks, including reduced fuel and maintenance expenses, will be a major incentive for fleet owners.
The market is also witnessing a rise in platooning technology, where multiple trucks travel in close convoy, further enhancing fuel efficiency and reducing road congestion. This collaborative approach, enabled by advanced connectivity and autonomous driving capabilities, represents a significant step towards optimizing freight transportation.
The evolution of business models, from outright vehicle purchase to subscription-based autonomous trucking services, is also expected to lower the barrier to entry for smaller logistics providers, further democratizing access to this transformative technology.
Dominant Regions, Countries, or Segments in Automated Heavy Duty Truck
The Transportation and Logistics segment, within the Application category, is currently the most dominant driver of growth in the Automated Heavy Duty Truck market. This dominance is attributed to the direct impact of automation on the core efficiencies and cost structures of freight movement, a critical backbone of global commerce. The sheer volume of goods transported daily, coupled with the persistent challenges of driver shortages and rising labor costs, creates an urgent demand for autonomous solutions in this sector. Within this segment, long-haul trucking routes and the logistics operations within large distribution hubs are prime areas for early and widespread adoption. The economic policies in major economies are increasingly favoring the adoption of technologies that enhance productivity and reduce logistical bottlenecks, further bolstering the growth of this segment.
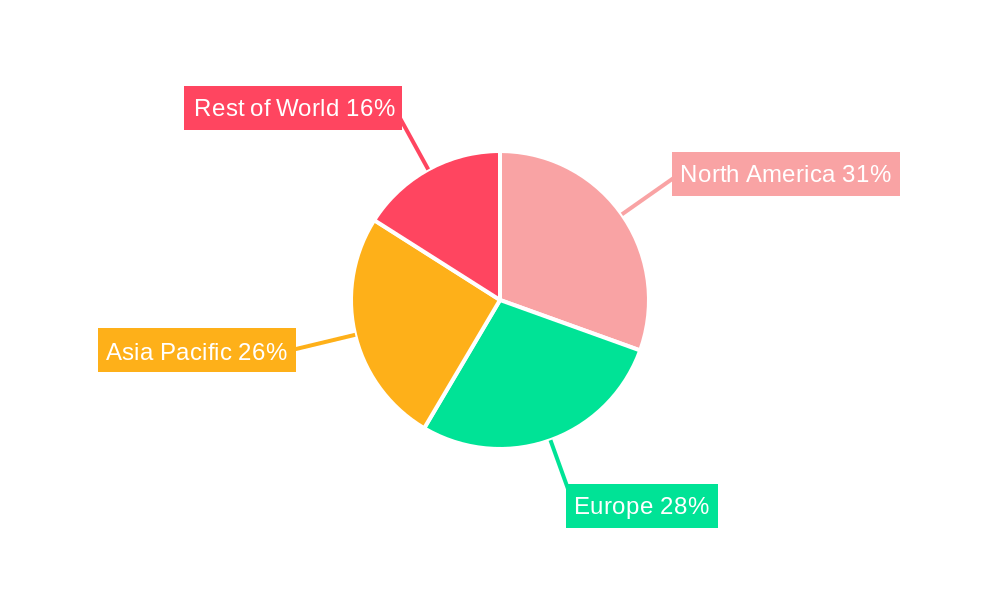
- North America (United States & Canada): Stands as a leading region, propelled by a vast highway network, significant trucking industry, and proactive regulatory bodies encouraging pilot programs and testing. The presence of major logistics companies and technological innovation hubs in the U.S. further solidifies its leadership.
- Europe (Germany, Sweden, Netherlands): Shows strong growth driven by stringent emission regulations, a focus on sustainability, and advancements in autonomous driving technology. European countries are actively developing smart infrastructure and testing autonomous freight corridors.
- Asia-Pacific (China, Japan): Emerging as a significant growth region, particularly China, due to its massive manufacturing base, extensive logistics needs, and government support for technological advancement. Japan's aging population and labor shortages are also driving interest in autonomous solutions.
In terms of Type, the Electric segment is projected to be the fastest-growing, driven by environmental regulations, corporate sustainability initiatives, and decreasing battery costs. While Diesel trucks will continue to hold a substantial market share, especially for long-haul applications where charging infrastructure is still developing, the long-term trend clearly favors electrification. Hybrid powertrains offer a transitional solution, bridging the gap between conventional and fully electric automated trucks.
- Key Drivers in Transportation & Logistics: Reduction in operational costs, enhanced safety and accident prevention, improved fuel efficiency, mitigation of driver shortages, 24/7 operational capabilities, optimization of delivery times.
- Market Share & Growth Potential: The Transportation and Logistics segment is projected to account for over xx% of the total Automated Heavy Duty Truck market by 2033. Its growth potential is immense, driven by the constant need for efficient and cost-effective freight movement.
Automated Heavy Duty Truck Product Landscape
The product landscape of automated heavy-duty trucks is rapidly evolving, featuring sophisticated autonomous driving systems integrated into robust chassis designs. Innovations focus on achieving higher levels of autonomy (SAE Levels 4 and 5), enabling trucks to navigate complex environments with minimal human intervention. Key advancements include enhanced sensor suites (LiDAR, radar, cameras) for comprehensive environmental perception, advanced AI algorithms for real-time decision-making, and robust V2X (Vehicle-to-Everything) communication for seamless interaction with infrastructure and other vehicles. Performance metrics emphasize improved safety through advanced collision avoidance, increased fuel efficiency through optimized driving patterns and platooning, and extended operational uptime due to reduced driver fatigue. Unique selling propositions revolve around delivering cost savings, enhanced safety, and addressing driver shortages.
Key Drivers, Barriers & Challenges in Automated Heavy Duty Truck
Key Drivers: The Automated Heavy Duty Truck market is propelled by a confluence of factors. Technological advancements in AI, sensor fusion, and connectivity are making autonomous systems more capable and reliable. The persistent global shortage of skilled truck drivers is creating an urgent need for automation to maintain supply chain efficiency. Furthermore, increasing pressure for enhanced road safety and the potential for significant operational cost reductions (fuel, labor, maintenance) are powerful economic incentives. Government initiatives and investments in smart infrastructure are also acting as catalysts for adoption.
Barriers & Challenges: Despite the promising outlook, the market faces significant hurdles. High initial investment costs for autonomous technology and infrastructure remain a substantial barrier for many fleet operators. Regulatory frameworks are still evolving, leading to uncertainty regarding deployment and operational guidelines across different jurisdictions. Public perception and acceptance of autonomous trucks on public roads present a challenge, requiring extensive safety demonstrations and education. Supply chain issues related to the availability of critical components, such as advanced semiconductors, can also impact production and deployment timelines. Cybersecurity threats to connected autonomous vehicles also demand robust and ongoing mitigation strategies.
Emerging Opportunities in Automated Heavy Duty Truck
Emerging opportunities lie in the development of specialized autonomous trucking solutions for niche applications, such as last-mile delivery in urban environments and autonomous hauling in off-road mining operations. The integration of hydrogen fuel cell technology with autonomous driving presents a significant opportunity for zero-emission long-haul trucking. Furthermore, the expansion of autonomous freight corridors and the development of integrated logistics platforms that seamlessly manage autonomous fleets offer untapped market potential. Evolving consumer preferences for faster and more sustainable deliveries are also creating demand for innovative autonomous freight services.
Growth Accelerators in the Automated Heavy Duty Truck Industry
Catalysts driving long-term growth in the Automated Heavy Duty Truck industry include breakthroughs in sensor technology, leading to more accurate and cost-effective perception systems. Strategic partnerships between traditional truck manufacturers, technology providers, and logistics companies are crucial for co-development and accelerating market penetration. Expansion into new geographical markets with developing infrastructure and supportive regulatory environments will unlock significant growth potential. The continuous refinement of AI algorithms and machine learning models will enhance the safety and efficiency of autonomous driving systems, fostering greater adoption.
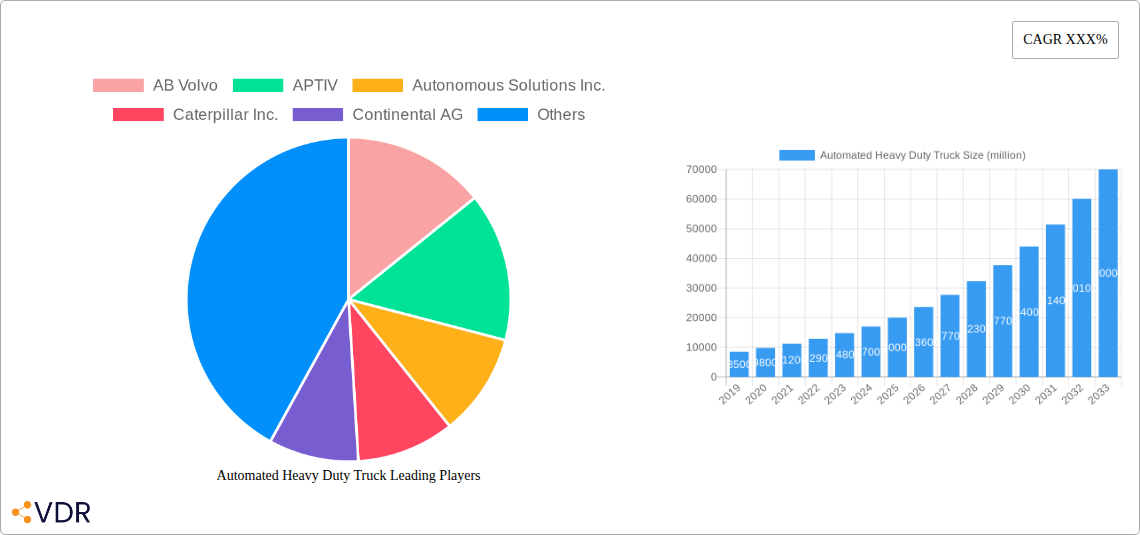
Key Players Shaping the Automated Heavy Duty Truck Market
- AB Volvo
- APTIV
- Autonomous Solutions Inc.
- Caterpillar Inc.
- Continental AG
- Daimler AG
- Denso Corporation
- EMBARK
- Hitachi Ltd.
- Intel Corporation
- Komatsu Corporation
- NVIDIA
- PECCAR, Inc.
- Qualcomm Technologies, Inc.
- Robert Bosch GmbH
- Valeo
- WABCO
- Waymo LLC
- ZF Friedrichshafen AG
Notable Milestones in Automated Heavy Duty Truck Sector
- 2019: First commercial deployment of autonomous trucks in controlled environments like mines and ports.
- 2020: Increased investment in autonomous trucking startups by venture capital and established automotive players.
- 2021: Successful completion of long-haul autonomous truck pilot programs on public highways, demonstrating safety and efficiency.
- 2022: Regulatory bodies in several key regions begin to establish frameworks for testing and deployment of autonomous heavy-duty vehicles.
- 2023: Introduction of advanced ADAS features in conventional heavy-duty trucks, paving the way for higher levels of autonomy.
- 2024: Formation of strategic alliances between technology providers and truck manufacturers to accelerate product development and market entry.
- 2025 (Estimated): Expected significant increase in the number of autonomous trucking pilot programs and early commercial deployments in specific corridors and applications.
In-Depth Automated Heavy Duty Truck Market Outlook
The future outlook for the Automated Heavy Duty Truck market is exceptionally strong, driven by ongoing technological innovation, increasing operational efficiencies, and supportive policy initiatives. Growth accelerators will continue to focus on advancing sensor capabilities, refining AI decision-making, and establishing robust cybersecurity protocols. Strategic partnerships will be pivotal in navigating the complexities of product development, regulatory compliance, and market penetration. Expansion into new geographical regions and the development of specialized autonomous solutions for diverse applications will create substantial revenue streams. The long-term market potential is rooted in the transformative impact of automation on the global logistics and transportation industries, promising a more efficient, safer, and sustainable future for freight movement.
Automated Heavy Duty Truck Segmentation
-
1. Application
- 1.1. Agriculture
- 1.2. Transportation and Logistics
-
2. Type
- 2.1. Diesel
- 2.2. Gasoline
- 2.3. Electric
- 2.4. Hybrid
Automated Heavy Duty Truck Segmentation By Geography
-
1. North America
- 1.1. United States
- 1.2. Canada
- 1.3. Mexico
-
2. South America
- 2.1. Brazil
- 2.2. Argentina
- 2.3. Rest of South America
-
3. Europe
- 3.1. United Kingdom
- 3.2. Germany
- 3.3. France
- 3.4. Italy
- 3.5. Spain
- 3.6. Russia
- 3.7. Benelux
- 3.8. Nordics
- 3.9. Rest of Europe
-
4. Middle East & Africa
- 4.1. Turkey
- 4.2. Israel
- 4.3. GCC
- 4.4. North Africa
- 4.5. South Africa
- 4.6. Rest of Middle East & Africa
-
5. Asia Pacific
- 5.1. China
- 5.2. India
- 5.3. Japan
- 5.4. South Korea
- 5.5. ASEAN
- 5.6. Oceania
- 5.7. Rest of Asia Pacific
Automated Heavy Duty Truck REPORT HIGHLIGHTS
| Aspects | Details |
|---|---|
| Study Period | 2019-2033 |
| Base Year | 2024 |
| Estimated Year | 2025 |
| Forecast Period | 2025-2033 |
| Historical Period | 2019-2024 |
| Growth Rate | CAGR of XXX% from 2019-2033 |
| Segmentation |
|
Table of Contents
- 1. Introduction
- 1.1. Research Scope
- 1.2. Market Segmentation
- 1.3. Research Methodology
- 1.4. Definitions and Assumptions
- 2. Executive Summary
- 2.1. Introduction
- 3. Market Dynamics
- 3.1. Introduction
- 3.2. Market Drivers
- 3.3. Market Restrains
- 3.4. Market Trends
- 4. Market Factor Analysis
- 4.1. Porters Five Forces
- 4.2. Supply/Value Chain
- 4.3. PESTEL analysis
- 4.4. Market Entropy
- 4.5. Patent/Trademark Analysis
- 5. Global Automated Heavy Duty Truck Analysis, Insights and Forecast, 2019-2031
- 5.1. Market Analysis, Insights and Forecast - by Application
- 5.1.1. Agriculture
- 5.1.2. Transportation and Logistics
- 5.2. Market Analysis, Insights and Forecast - by Type
- 5.2.1. Diesel
- 5.2.2. Gasoline
- 5.2.3. Electric
- 5.2.4. Hybrid
- 5.3. Market Analysis, Insights and Forecast - by Region
- 5.3.1. North America
- 5.3.2. South America
- 5.3.3. Europe
- 5.3.4. Middle East & Africa
- 5.3.5. Asia Pacific
- 5.1. Market Analysis, Insights and Forecast - by Application
- 6. North America Automated Heavy Duty Truck Analysis, Insights and Forecast, 2019-2031
- 6.1. Market Analysis, Insights and Forecast - by Application
- 6.1.1. Agriculture
- 6.1.2. Transportation and Logistics
- 6.2. Market Analysis, Insights and Forecast - by Type
- 6.2.1. Diesel
- 6.2.2. Gasoline
- 6.2.3. Electric
- 6.2.4. Hybrid
- 6.1. Market Analysis, Insights and Forecast - by Application
- 7. South America Automated Heavy Duty Truck Analysis, Insights and Forecast, 2019-2031
- 7.1. Market Analysis, Insights and Forecast - by Application
- 7.1.1. Agriculture
- 7.1.2. Transportation and Logistics
- 7.2. Market Analysis, Insights and Forecast - by Type
- 7.2.1. Diesel
- 7.2.2. Gasoline
- 7.2.3. Electric
- 7.2.4. Hybrid
- 7.1. Market Analysis, Insights and Forecast - by Application
- 8. Europe Automated Heavy Duty Truck Analysis, Insights and Forecast, 2019-2031
- 8.1. Market Analysis, Insights and Forecast - by Application
- 8.1.1. Agriculture
- 8.1.2. Transportation and Logistics
- 8.2. Market Analysis, Insights and Forecast - by Type
- 8.2.1. Diesel
- 8.2.2. Gasoline
- 8.2.3. Electric
- 8.2.4. Hybrid
- 8.1. Market Analysis, Insights and Forecast - by Application
- 9. Middle East & Africa Automated Heavy Duty Truck Analysis, Insights and Forecast, 2019-2031
- 9.1. Market Analysis, Insights and Forecast - by Application
- 9.1.1. Agriculture
- 9.1.2. Transportation and Logistics
- 9.2. Market Analysis, Insights and Forecast - by Type
- 9.2.1. Diesel
- 9.2.2. Gasoline
- 9.2.3. Electric
- 9.2.4. Hybrid
- 9.1. Market Analysis, Insights and Forecast - by Application
- 10. Asia Pacific Automated Heavy Duty Truck Analysis, Insights and Forecast, 2019-2031
- 10.1. Market Analysis, Insights and Forecast - by Application
- 10.1.1. Agriculture
- 10.1.2. Transportation and Logistics
- 10.2. Market Analysis, Insights and Forecast - by Type
- 10.2.1. Diesel
- 10.2.2. Gasoline
- 10.2.3. Electric
- 10.2.4. Hybrid
- 10.1. Market Analysis, Insights and Forecast - by Application
- 11. Competitive Analysis
- 11.1. Global Market Share Analysis 2024
- 11.2. Company Profiles
- 11.2.1 AB Volvo
- 11.2.1.1. Overview
- 11.2.1.2. Products
- 11.2.1.3. SWOT Analysis
- 11.2.1.4. Recent Developments
- 11.2.1.5. Financials (Based on Availability)
- 11.2.2 APTIV
- 11.2.2.1. Overview
- 11.2.2.2. Products
- 11.2.2.3. SWOT Analysis
- 11.2.2.4. Recent Developments
- 11.2.2.5. Financials (Based on Availability)
- 11.2.3 Autonomous Solutions Inc.
- 11.2.3.1. Overview
- 11.2.3.2. Products
- 11.2.3.3. SWOT Analysis
- 11.2.3.4. Recent Developments
- 11.2.3.5. Financials (Based on Availability)
- 11.2.4 Caterpillar Inc.
- 11.2.4.1. Overview
- 11.2.4.2. Products
- 11.2.4.3. SWOT Analysis
- 11.2.4.4. Recent Developments
- 11.2.4.5. Financials (Based on Availability)
- 11.2.5 Continental AG
- 11.2.5.1. Overview
- 11.2.5.2. Products
- 11.2.5.3. SWOT Analysis
- 11.2.5.4. Recent Developments
- 11.2.5.5. Financials (Based on Availability)
- 11.2.6 Daimler AG
- 11.2.6.1. Overview
- 11.2.6.2. Products
- 11.2.6.3. SWOT Analysis
- 11.2.6.4. Recent Developments
- 11.2.6.5. Financials (Based on Availability)
- 11.2.7 Denso Corporation
- 11.2.7.1. Overview
- 11.2.7.2. Products
- 11.2.7.3. SWOT Analysis
- 11.2.7.4. Recent Developments
- 11.2.7.5. Financials (Based on Availability)
- 11.2.8 EMBARK
- 11.2.8.1. Overview
- 11.2.8.2. Products
- 11.2.8.3. SWOT Analysis
- 11.2.8.4. Recent Developments
- 11.2.8.5. Financials (Based on Availability)
- 11.2.9 Hitachi Ltd.
- 11.2.9.1. Overview
- 11.2.9.2. Products
- 11.2.9.3. SWOT Analysis
- 11.2.9.4. Recent Developments
- 11.2.9.5. Financials (Based on Availability)
- 11.2.10 Intel Corporation
- 11.2.10.1. Overview
- 11.2.10.2. Products
- 11.2.10.3. SWOT Analysis
- 11.2.10.4. Recent Developments
- 11.2.10.5. Financials (Based on Availability)
- 11.2.11 Komatsu Corporation
- 11.2.11.1. Overview
- 11.2.11.2. Products
- 11.2.11.3. SWOT Analysis
- 11.2.11.4. Recent Developments
- 11.2.11.5. Financials (Based on Availability)
- 11.2.12 NVIDIA
- 11.2.12.1. Overview
- 11.2.12.2. Products
- 11.2.12.3. SWOT Analysis
- 11.2.12.4. Recent Developments
- 11.2.12.5. Financials (Based on Availability)
- 11.2.13 PECCAR
- 11.2.13.1. Overview
- 11.2.13.2. Products
- 11.2.13.3. SWOT Analysis
- 11.2.13.4. Recent Developments
- 11.2.13.5. Financials (Based on Availability)
- 11.2.14 Inc.
- 11.2.14.1. Overview
- 11.2.14.2. Products
- 11.2.14.3. SWOT Analysis
- 11.2.14.4. Recent Developments
- 11.2.14.5. Financials (Based on Availability)
- 11.2.15 Qualcomm Technologies
- 11.2.15.1. Overview
- 11.2.15.2. Products
- 11.2.15.3. SWOT Analysis
- 11.2.15.4. Recent Developments
- 11.2.15.5. Financials (Based on Availability)
- 11.2.16 Inc.
- 11.2.16.1. Overview
- 11.2.16.2. Products
- 11.2.16.3. SWOT Analysis
- 11.2.16.4. Recent Developments
- 11.2.16.5. Financials (Based on Availability)
- 11.2.17 Robert Bosch GmbH
- 11.2.17.1. Overview
- 11.2.17.2. Products
- 11.2.17.3. SWOT Analysis
- 11.2.17.4. Recent Developments
- 11.2.17.5. Financials (Based on Availability)
- 11.2.18 Valeo
- 11.2.18.1. Overview
- 11.2.18.2. Products
- 11.2.18.3. SWOT Analysis
- 11.2.18.4. Recent Developments
- 11.2.18.5. Financials (Based on Availability)
- 11.2.19 WABCO
- 11.2.19.1. Overview
- 11.2.19.2. Products
- 11.2.19.3. SWOT Analysis
- 11.2.19.4. Recent Developments
- 11.2.19.5. Financials (Based on Availability)
- 11.2.20 Waymo LLC
- 11.2.20.1. Overview
- 11.2.20.2. Products
- 11.2.20.3. SWOT Analysis
- 11.2.20.4. Recent Developments
- 11.2.20.5. Financials (Based on Availability)
- 11.2.21 ZF Friedrichshafen AG
- 11.2.21.1. Overview
- 11.2.21.2. Products
- 11.2.21.3. SWOT Analysis
- 11.2.21.4. Recent Developments
- 11.2.21.5. Financials (Based on Availability)
- 11.2.1 AB Volvo
List of Figures
- Figure 1: Global Automated Heavy Duty Truck Revenue Breakdown (million, %) by Region 2024 & 2032
- Figure 2: Global Automated Heavy Duty Truck Volume Breakdown (K, %) by Region 2024 & 2032
- Figure 3: North America Automated Heavy Duty Truck Revenue (million), by Application 2024 & 2032
- Figure 4: North America Automated Heavy Duty Truck Volume (K), by Application 2024 & 2032
- Figure 5: North America Automated Heavy Duty Truck Revenue Share (%), by Application 2024 & 2032
- Figure 6: North America Automated Heavy Duty Truck Volume Share (%), by Application 2024 & 2032
- Figure 7: North America Automated Heavy Duty Truck Revenue (million), by Type 2024 & 2032
- Figure 8: North America Automated Heavy Duty Truck Volume (K), by Type 2024 & 2032
- Figure 9: North America Automated Heavy Duty Truck Revenue Share (%), by Type 2024 & 2032
- Figure 10: North America Automated Heavy Duty Truck Volume Share (%), by Type 2024 & 2032
- Figure 11: North America Automated Heavy Duty Truck Revenue (million), by Country 2024 & 2032
- Figure 12: North America Automated Heavy Duty Truck Volume (K), by Country 2024 & 2032
- Figure 13: North America Automated Heavy Duty Truck Revenue Share (%), by Country 2024 & 2032
- Figure 14: North America Automated Heavy Duty Truck Volume Share (%), by Country 2024 & 2032
- Figure 15: South America Automated Heavy Duty Truck Revenue (million), by Application 2024 & 2032
- Figure 16: South America Automated Heavy Duty Truck Volume (K), by Application 2024 & 2032
- Figure 17: South America Automated Heavy Duty Truck Revenue Share (%), by Application 2024 & 2032
- Figure 18: South America Automated Heavy Duty Truck Volume Share (%), by Application 2024 & 2032
- Figure 19: South America Automated Heavy Duty Truck Revenue (million), by Type 2024 & 2032
- Figure 20: South America Automated Heavy Duty Truck Volume (K), by Type 2024 & 2032
- Figure 21: South America Automated Heavy Duty Truck Revenue Share (%), by Type 2024 & 2032
- Figure 22: South America Automated Heavy Duty Truck Volume Share (%), by Type 2024 & 2032
- Figure 23: South America Automated Heavy Duty Truck Revenue (million), by Country 2024 & 2032
- Figure 24: South America Automated Heavy Duty Truck Volume (K), by Country 2024 & 2032
- Figure 25: South America Automated Heavy Duty Truck Revenue Share (%), by Country 2024 & 2032
- Figure 26: South America Automated Heavy Duty Truck Volume Share (%), by Country 2024 & 2032
- Figure 27: Europe Automated Heavy Duty Truck Revenue (million), by Application 2024 & 2032
- Figure 28: Europe Automated Heavy Duty Truck Volume (K), by Application 2024 & 2032
- Figure 29: Europe Automated Heavy Duty Truck Revenue Share (%), by Application 2024 & 2032
- Figure 30: Europe Automated Heavy Duty Truck Volume Share (%), by Application 2024 & 2032
- Figure 31: Europe Automated Heavy Duty Truck Revenue (million), by Type 2024 & 2032
- Figure 32: Europe Automated Heavy Duty Truck Volume (K), by Type 2024 & 2032
- Figure 33: Europe Automated Heavy Duty Truck Revenue Share (%), by Type 2024 & 2032
- Figure 34: Europe Automated Heavy Duty Truck Volume Share (%), by Type 2024 & 2032
- Figure 35: Europe Automated Heavy Duty Truck Revenue (million), by Country 2024 & 2032
- Figure 36: Europe Automated Heavy Duty Truck Volume (K), by Country 2024 & 2032
- Figure 37: Europe Automated Heavy Duty Truck Revenue Share (%), by Country 2024 & 2032
- Figure 38: Europe Automated Heavy Duty Truck Volume Share (%), by Country 2024 & 2032
- Figure 39: Middle East & Africa Automated Heavy Duty Truck Revenue (million), by Application 2024 & 2032
- Figure 40: Middle East & Africa Automated Heavy Duty Truck Volume (K), by Application 2024 & 2032
- Figure 41: Middle East & Africa Automated Heavy Duty Truck Revenue Share (%), by Application 2024 & 2032
- Figure 42: Middle East & Africa Automated Heavy Duty Truck Volume Share (%), by Application 2024 & 2032
- Figure 43: Middle East & Africa Automated Heavy Duty Truck Revenue (million), by Type 2024 & 2032
- Figure 44: Middle East & Africa Automated Heavy Duty Truck Volume (K), by Type 2024 & 2032
- Figure 45: Middle East & Africa Automated Heavy Duty Truck Revenue Share (%), by Type 2024 & 2032
- Figure 46: Middle East & Africa Automated Heavy Duty Truck Volume Share (%), by Type 2024 & 2032
- Figure 47: Middle East & Africa Automated Heavy Duty Truck Revenue (million), by Country 2024 & 2032
- Figure 48: Middle East & Africa Automated Heavy Duty Truck Volume (K), by Country 2024 & 2032
- Figure 49: Middle East & Africa Automated Heavy Duty Truck Revenue Share (%), by Country 2024 & 2032
- Figure 50: Middle East & Africa Automated Heavy Duty Truck Volume Share (%), by Country 2024 & 2032
- Figure 51: Asia Pacific Automated Heavy Duty Truck Revenue (million), by Application 2024 & 2032
- Figure 52: Asia Pacific Automated Heavy Duty Truck Volume (K), by Application 2024 & 2032
- Figure 53: Asia Pacific Automated Heavy Duty Truck Revenue Share (%), by Application 2024 & 2032
- Figure 54: Asia Pacific Automated Heavy Duty Truck Volume Share (%), by Application 2024 & 2032
- Figure 55: Asia Pacific Automated Heavy Duty Truck Revenue (million), by Type 2024 & 2032
- Figure 56: Asia Pacific Automated Heavy Duty Truck Volume (K), by Type 2024 & 2032
- Figure 57: Asia Pacific Automated Heavy Duty Truck Revenue Share (%), by Type 2024 & 2032
- Figure 58: Asia Pacific Automated Heavy Duty Truck Volume Share (%), by Type 2024 & 2032
- Figure 59: Asia Pacific Automated Heavy Duty Truck Revenue (million), by Country 2024 & 2032
- Figure 60: Asia Pacific Automated Heavy Duty Truck Volume (K), by Country 2024 & 2032
- Figure 61: Asia Pacific Automated Heavy Duty Truck Revenue Share (%), by Country 2024 & 2032
- Figure 62: Asia Pacific Automated Heavy Duty Truck Volume Share (%), by Country 2024 & 2032
List of Tables
- Table 1: Global Automated Heavy Duty Truck Revenue million Forecast, by Region 2019 & 2032
- Table 2: Global Automated Heavy Duty Truck Volume K Forecast, by Region 2019 & 2032
- Table 3: Global Automated Heavy Duty Truck Revenue million Forecast, by Application 2019 & 2032
- Table 4: Global Automated Heavy Duty Truck Volume K Forecast, by Application 2019 & 2032
- Table 5: Global Automated Heavy Duty Truck Revenue million Forecast, by Type 2019 & 2032
- Table 6: Global Automated Heavy Duty Truck Volume K Forecast, by Type 2019 & 2032
- Table 7: Global Automated Heavy Duty Truck Revenue million Forecast, by Region 2019 & 2032
- Table 8: Global Automated Heavy Duty Truck Volume K Forecast, by Region 2019 & 2032
- Table 9: Global Automated Heavy Duty Truck Revenue million Forecast, by Application 2019 & 2032
- Table 10: Global Automated Heavy Duty Truck Volume K Forecast, by Application 2019 & 2032
- Table 11: Global Automated Heavy Duty Truck Revenue million Forecast, by Type 2019 & 2032
- Table 12: Global Automated Heavy Duty Truck Volume K Forecast, by Type 2019 & 2032
- Table 13: Global Automated Heavy Duty Truck Revenue million Forecast, by Country 2019 & 2032
- Table 14: Global Automated Heavy Duty Truck Volume K Forecast, by Country 2019 & 2032
- Table 15: United States Automated Heavy Duty Truck Revenue (million) Forecast, by Application 2019 & 2032
- Table 16: United States Automated Heavy Duty Truck Volume (K) Forecast, by Application 2019 & 2032
- Table 17: Canada Automated Heavy Duty Truck Revenue (million) Forecast, by Application 2019 & 2032
- Table 18: Canada Automated Heavy Duty Truck Volume (K) Forecast, by Application 2019 & 2032
- Table 19: Mexico Automated Heavy Duty Truck Revenue (million) Forecast, by Application 2019 & 2032
- Table 20: Mexico Automated Heavy Duty Truck Volume (K) Forecast, by Application 2019 & 2032
- Table 21: Global Automated Heavy Duty Truck Revenue million Forecast, by Application 2019 & 2032
- Table 22: Global Automated Heavy Duty Truck Volume K Forecast, by Application 2019 & 2032
- Table 23: Global Automated Heavy Duty Truck Revenue million Forecast, by Type 2019 & 2032
- Table 24: Global Automated Heavy Duty Truck Volume K Forecast, by Type 2019 & 2032
- Table 25: Global Automated Heavy Duty Truck Revenue million Forecast, by Country 2019 & 2032
- Table 26: Global Automated Heavy Duty Truck Volume K Forecast, by Country 2019 & 2032
- Table 27: Brazil Automated Heavy Duty Truck Revenue (million) Forecast, by Application 2019 & 2032
- Table 28: Brazil Automated Heavy Duty Truck Volume (K) Forecast, by Application 2019 & 2032
- Table 29: Argentina Automated Heavy Duty Truck Revenue (million) Forecast, by Application 2019 & 2032
- Table 30: Argentina Automated Heavy Duty Truck Volume (K) Forecast, by Application 2019 & 2032
- Table 31: Rest of South America Automated Heavy Duty Truck Revenue (million) Forecast, by Application 2019 & 2032
- Table 32: Rest of South America Automated Heavy Duty Truck Volume (K) Forecast, by Application 2019 & 2032
- Table 33: Global Automated Heavy Duty Truck Revenue million Forecast, by Application 2019 & 2032
- Table 34: Global Automated Heavy Duty Truck Volume K Forecast, by Application 2019 & 2032
- Table 35: Global Automated Heavy Duty Truck Revenue million Forecast, by Type 2019 & 2032
- Table 36: Global Automated Heavy Duty Truck Volume K Forecast, by Type 2019 & 2032
- Table 37: Global Automated Heavy Duty Truck Revenue million Forecast, by Country 2019 & 2032
- Table 38: Global Automated Heavy Duty Truck Volume K Forecast, by Country 2019 & 2032
- Table 39: United Kingdom Automated Heavy Duty Truck Revenue (million) Forecast, by Application 2019 & 2032
- Table 40: United Kingdom Automated Heavy Duty Truck Volume (K) Forecast, by Application 2019 & 2032
- Table 41: Germany Automated Heavy Duty Truck Revenue (million) Forecast, by Application 2019 & 2032
- Table 42: Germany Automated Heavy Duty Truck Volume (K) Forecast, by Application 2019 & 2032
- Table 43: France Automated Heavy Duty Truck Revenue (million) Forecast, by Application 2019 & 2032
- Table 44: France Automated Heavy Duty Truck Volume (K) Forecast, by Application 2019 & 2032
- Table 45: Italy Automated Heavy Duty Truck Revenue (million) Forecast, by Application 2019 & 2032
- Table 46: Italy Automated Heavy Duty Truck Volume (K) Forecast, by Application 2019 & 2032
- Table 47: Spain Automated Heavy Duty Truck Revenue (million) Forecast, by Application 2019 & 2032
- Table 48: Spain Automated Heavy Duty Truck Volume (K) Forecast, by Application 2019 & 2032
- Table 49: Russia Automated Heavy Duty Truck Revenue (million) Forecast, by Application 2019 & 2032
- Table 50: Russia Automated Heavy Duty Truck Volume (K) Forecast, by Application 2019 & 2032
- Table 51: Benelux Automated Heavy Duty Truck Revenue (million) Forecast, by Application 2019 & 2032
- Table 52: Benelux Automated Heavy Duty Truck Volume (K) Forecast, by Application 2019 & 2032
- Table 53: Nordics Automated Heavy Duty Truck Revenue (million) Forecast, by Application 2019 & 2032
- Table 54: Nordics Automated Heavy Duty Truck Volume (K) Forecast, by Application 2019 & 2032
- Table 55: Rest of Europe Automated Heavy Duty Truck Revenue (million) Forecast, by Application 2019 & 2032
- Table 56: Rest of Europe Automated Heavy Duty Truck Volume (K) Forecast, by Application 2019 & 2032
- Table 57: Global Automated Heavy Duty Truck Revenue million Forecast, by Application 2019 & 2032
- Table 58: Global Automated Heavy Duty Truck Volume K Forecast, by Application 2019 & 2032
- Table 59: Global Automated Heavy Duty Truck Revenue million Forecast, by Type 2019 & 2032
- Table 60: Global Automated Heavy Duty Truck Volume K Forecast, by Type 2019 & 2032
- Table 61: Global Automated Heavy Duty Truck Revenue million Forecast, by Country 2019 & 2032
- Table 62: Global Automated Heavy Duty Truck Volume K Forecast, by Country 2019 & 2032
- Table 63: Turkey Automated Heavy Duty Truck Revenue (million) Forecast, by Application 2019 & 2032
- Table 64: Turkey Automated Heavy Duty Truck Volume (K) Forecast, by Application 2019 & 2032
- Table 65: Israel Automated Heavy Duty Truck Revenue (million) Forecast, by Application 2019 & 2032
- Table 66: Israel Automated Heavy Duty Truck Volume (K) Forecast, by Application 2019 & 2032
- Table 67: GCC Automated Heavy Duty Truck Revenue (million) Forecast, by Application 2019 & 2032
- Table 68: GCC Automated Heavy Duty Truck Volume (K) Forecast, by Application 2019 & 2032
- Table 69: North Africa Automated Heavy Duty Truck Revenue (million) Forecast, by Application 2019 & 2032
- Table 70: North Africa Automated Heavy Duty Truck Volume (K) Forecast, by Application 2019 & 2032
- Table 71: South Africa Automated Heavy Duty Truck Revenue (million) Forecast, by Application 2019 & 2032
- Table 72: South Africa Automated Heavy Duty Truck Volume (K) Forecast, by Application 2019 & 2032
- Table 73: Rest of Middle East & Africa Automated Heavy Duty Truck Revenue (million) Forecast, by Application 2019 & 2032
- Table 74: Rest of Middle East & Africa Automated Heavy Duty Truck Volume (K) Forecast, by Application 2019 & 2032
- Table 75: Global Automated Heavy Duty Truck Revenue million Forecast, by Application 2019 & 2032
- Table 76: Global Automated Heavy Duty Truck Volume K Forecast, by Application 2019 & 2032
- Table 77: Global Automated Heavy Duty Truck Revenue million Forecast, by Type 2019 & 2032
- Table 78: Global Automated Heavy Duty Truck Volume K Forecast, by Type 2019 & 2032
- Table 79: Global Automated Heavy Duty Truck Revenue million Forecast, by Country 2019 & 2032
- Table 80: Global Automated Heavy Duty Truck Volume K Forecast, by Country 2019 & 2032
- Table 81: China Automated Heavy Duty Truck Revenue (million) Forecast, by Application 2019 & 2032
- Table 82: China Automated Heavy Duty Truck Volume (K) Forecast, by Application 2019 & 2032
- Table 83: India Automated Heavy Duty Truck Revenue (million) Forecast, by Application 2019 & 2032
- Table 84: India Automated Heavy Duty Truck Volume (K) Forecast, by Application 2019 & 2032
- Table 85: Japan Automated Heavy Duty Truck Revenue (million) Forecast, by Application 2019 & 2032
- Table 86: Japan Automated Heavy Duty Truck Volume (K) Forecast, by Application 2019 & 2032
- Table 87: South Korea Automated Heavy Duty Truck Revenue (million) Forecast, by Application 2019 & 2032
- Table 88: South Korea Automated Heavy Duty Truck Volume (K) Forecast, by Application 2019 & 2032
- Table 89: ASEAN Automated Heavy Duty Truck Revenue (million) Forecast, by Application 2019 & 2032
- Table 90: ASEAN Automated Heavy Duty Truck Volume (K) Forecast, by Application 2019 & 2032
- Table 91: Oceania Automated Heavy Duty Truck Revenue (million) Forecast, by Application 2019 & 2032
- Table 92: Oceania Automated Heavy Duty Truck Volume (K) Forecast, by Application 2019 & 2032
- Table 93: Rest of Asia Pacific Automated Heavy Duty Truck Revenue (million) Forecast, by Application 2019 & 2032
- Table 94: Rest of Asia Pacific Automated Heavy Duty Truck Volume (K) Forecast, by Application 2019 & 2032
Frequently Asked Questions
1. What is the projected Compound Annual Growth Rate (CAGR) of the Automated Heavy Duty Truck?
The projected CAGR is approximately XXX%.
2. Which companies are prominent players in the Automated Heavy Duty Truck?
Key companies in the market include AB Volvo, APTIV, Autonomous Solutions Inc., Caterpillar Inc., Continental AG, Daimler AG, Denso Corporation, EMBARK, Hitachi Ltd., Intel Corporation, Komatsu Corporation, NVIDIA, PECCAR, Inc., Qualcomm Technologies, Inc., Robert Bosch GmbH, Valeo, WABCO, Waymo LLC, ZF Friedrichshafen AG.
3. What are the main segments of the Automated Heavy Duty Truck?
The market segments include Application, Type.
4. Can you provide details about the market size?
The market size is estimated to be USD XXX million as of 2022.
5. What are some drivers contributing to market growth?
N/A
6. What are the notable trends driving market growth?
N/A
7. Are there any restraints impacting market growth?
N/A
8. Can you provide examples of recent developments in the market?
N/A
9. What pricing options are available for accessing the report?
Pricing options include single-user, multi-user, and enterprise licenses priced at USD 3950.00, USD 5925.00, and USD 7900.00 respectively.
10. Is the market size provided in terms of value or volume?
The market size is provided in terms of value, measured in million and volume, measured in K.
11. Are there any specific market keywords associated with the report?
Yes, the market keyword associated with the report is "Automated Heavy Duty Truck," which aids in identifying and referencing the specific market segment covered.
12. How do I determine which pricing option suits my needs best?
The pricing options vary based on user requirements and access needs. Individual users may opt for single-user licenses, while businesses requiring broader access may choose multi-user or enterprise licenses for cost-effective access to the report.
13. Are there any additional resources or data provided in the Automated Heavy Duty Truck report?
While the report offers comprehensive insights, it's advisable to review the specific contents or supplementary materials provided to ascertain if additional resources or data are available.
14. How can I stay updated on further developments or reports in the Automated Heavy Duty Truck?
To stay informed about further developments, trends, and reports in the Automated Heavy Duty Truck, consider subscribing to industry newsletters, following relevant companies and organizations, or regularly checking reputable industry news sources and publications.
Methodology
Step 1 - Identification of Relevant Samples Size from Population Database


Step 2 - Approaches for Defining Global Market Size (Value, Volume* & Price*)

Note*: In applicable scenarios
Step 3 - Data Sources
Primary Research
- Web Analytics
- Survey Reports
- Research Institute
- Latest Research Reports
- Opinion Leaders
Secondary Research
- Annual Reports
- White Paper
- Latest Press Release
- Industry Association
- Paid Database
- Investor Presentations

Step 4 - Data Triangulation
Involves using different sources of information in order to increase the validity of a study
These sources are likely to be stakeholders in a program - participants, other researchers, program staff, other community members, and so on.
Then we put all data in single framework & apply various statistical tools to find out the dynamic on the market.
During the analysis stage, feedback from the stakeholder groups would be compared to determine areas of agreement as well as areas of divergence


