
Key Insights
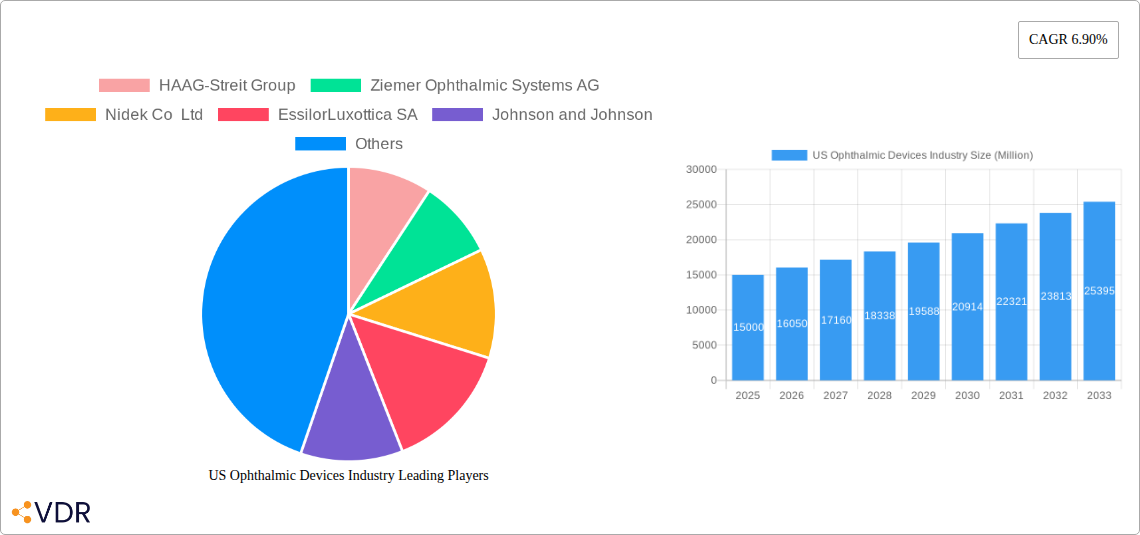
The US ophthalmic devices market, valued at approximately $15 billion in 2025, is projected to experience robust growth, driven by a rising geriatric population susceptible to age-related eye diseases like cataracts and glaucoma, increasing prevalence of refractive errors, and advancements in surgical and diagnostic technologies. The market's Compound Annual Growth Rate (CAGR) of 6.90% from 2025 to 2033 indicates significant expansion, with substantial opportunities for established players like Johnson & Johnson, Alcon Inc., and EssilorLuxottica SA, as well as emerging companies introducing innovative solutions. Technological advancements, such as minimally invasive surgical techniques, sophisticated imaging systems, and the integration of artificial intelligence in diagnostics, are key drivers. Growth is further fueled by increasing healthcare expenditure and rising awareness about eye health among consumers.
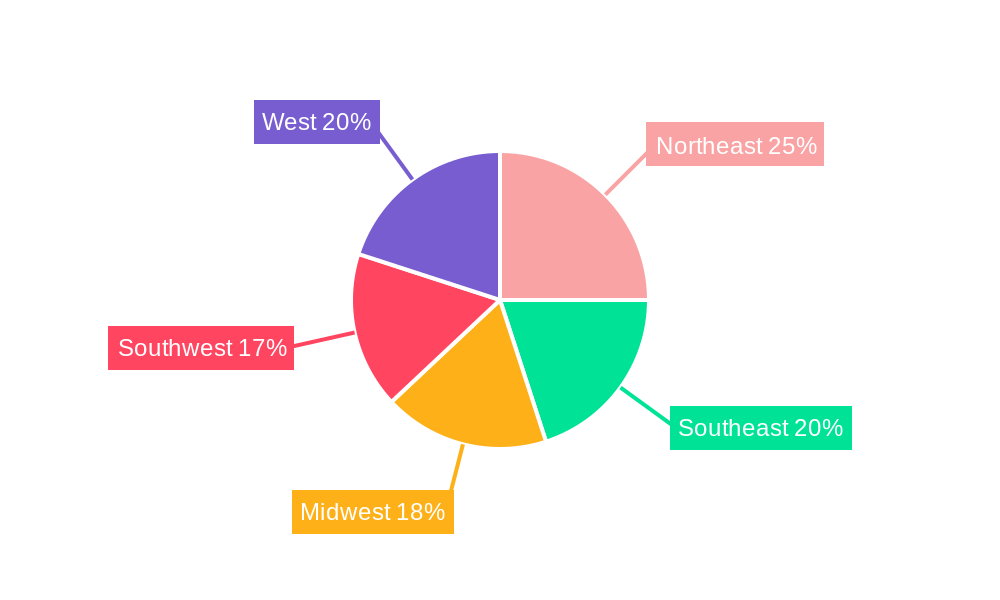
However, the market faces certain challenges. High costs associated with advanced ophthalmic devices can limit accessibility, particularly for patients in underserved communities. Stringent regulatory approvals and reimbursement policies also pose hurdles for manufacturers. Competition among established players and the emergence of new entrants intensify the pressure on pricing and margins. Furthermore, potential supply chain disruptions and the increasing complexity of device technologies contribute to the market's dynamic landscape. Despite these restraints, the long-term outlook for the US ophthalmic devices market remains positive, driven by continued technological innovation and an aging population. The segmentation of the market, including surgical devices, diagnostic and monitoring devices, and vision correction devices, allows for targeted investment and growth strategies, catering to specific needs within the ophthalmic care ecosystem. Regional variations within the US market, notably across Northeast, Southeast, Midwest, Southwest, and West, will influence market penetration and adoption rates for different technologies.
US Ophthalmic Devices Industry Market Report: 2019-2033
This comprehensive report provides a detailed analysis of the US ophthalmic devices industry, offering invaluable insights for industry professionals, investors, and strategic decision-makers. With a study period spanning 2019-2033, a base year of 2025, and a forecast period of 2025-2033, this report delivers a complete picture of market dynamics, growth trends, and future opportunities. The report analyzes key segments including Surgical Devices, Diagnostic and Monitoring Devices (further broken down into vision correction devices and other diagnostic and monitoring devices), providing a granular understanding of market size, growth rates, and key players.
US Ophthalmic Devices Industry Market Dynamics & Structure
The US ophthalmic devices market is a dynamic landscape characterized by moderate concentration, significant technological innovation, and stringent regulatory oversight. The market is driven by an aging population, rising prevalence of eye diseases, and advancements in minimally invasive surgical techniques. However, high R&D costs and lengthy regulatory approval processes pose significant barriers to entry. Mergers and acquisitions (M&A) activity remains significant, with larger players strategically consolidating their market positions.
- Market Concentration: The market exhibits moderate concentration, with top 10 players holding approximately xx% market share in 2024.
- Technological Innovation: Advancements in laser technology, artificial intelligence (AI), and biomaterials are driving innovation.
- Regulatory Framework: Stringent FDA regulations impact product development timelines and market entry.
- Competitive Product Substitutes: The availability of alternative treatment options influences market adoption rates.
- End-User Demographics: The aging population and rising prevalence of age-related eye diseases fuel market growth.
- M&A Trends: Consolidation activity continues, with xx major M&A deals recorded between 2019 and 2024, totaling an estimated value of $xx million.
US Ophthalmic Devices Industry Growth Trends & Insights
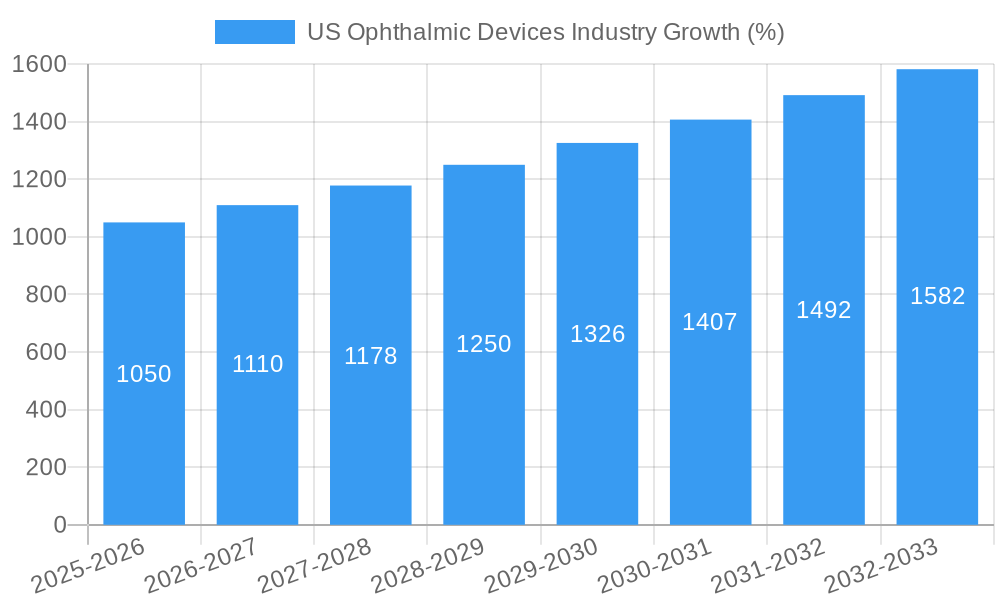
The US ophthalmic devices market experienced a CAGR of xx% during the historical period (2019-2024), reaching a market size of $xx million in 2024. This growth is primarily attributed to factors such as increased awareness of eye health, technological advancements leading to minimally invasive procedures, and favorable reimbursement policies. The forecast period (2025-2033) projects continued growth, driven by the increasing prevalence of chronic eye conditions like glaucoma and cataracts, coupled with the rising adoption of technologically advanced devices. The market is expected to reach $xx million by 2033, exhibiting a CAGR of xx%. The adoption rate of new technologies is expected to accelerate, further propelling market growth. Consumer behavior shifts, including increased demand for minimally invasive and personalized treatments, also contribute to the positive outlook. Market penetration of advanced diagnostic devices is projected to increase from xx% in 2024 to xx% by 2033.
Dominant Regions, Countries, or Segments in US Ophthalmic Devices Industry
The dominant segment within the US ophthalmic devices market is Surgical Devices, accounting for approximately xx% of the total market value in 2024. This segment's high growth is primarily driven by the increasing prevalence of age-related eye diseases requiring surgical intervention, such as cataracts and glaucoma. Within Surgical Devices, cataract surgery devices hold the largest share, fueled by rising cataract prevalence and technological advancements in lens implants. The Diagnostic and Monitoring Devices segment shows consistent growth, driven by increasing demand for early diagnosis and improved monitoring capabilities. Within this segment, vision correction devices witness considerable growth due to the rising prevalence of refractive errors.
- Key Drivers for Surgical Devices: Technological advancements, rising prevalence of cataracts and glaucoma, and improved surgical outcomes.
- Key Drivers for Diagnostic and Monitoring Devices: Early detection of eye diseases, growing demand for precise diagnostics, improved accuracy and speed of diagnostic devices, and increasing investment in R&D.
- Regional Dominance: The Northeast and West Coast regions demonstrate stronger growth due to higher concentration of specialized ophthalmology centers and research institutions.
US Ophthalmic Devices Industry Product Landscape
The US ophthalmic devices market offers a diverse range of products, including advanced intraocular lenses (IOLs), laser systems for refractive surgery, diagnostic imaging equipment, and minimally invasive surgical tools. Recent innovations focus on improved precision, reduced invasiveness, faster recovery times, and enhanced patient outcomes. Many products incorporate advanced technologies such as AI for image analysis and robotics for precise surgical procedures. Key selling propositions include improved efficacy, reduced complications, and enhanced patient experience.
Key Drivers, Barriers & Challenges in US Ophthalmic Devices Industry
Key Drivers:
- Aging population and increased prevalence of age-related eye diseases.
- Technological advancements leading to minimally invasive procedures.
- Favorable reimbursement policies and insurance coverage.
- Rising disposable incomes and increased healthcare spending.
Challenges:
- Stringent regulatory hurdles and lengthy FDA approval processes, potentially delaying product launches.
- High R&D costs and challenges associated with bringing innovative products to market.
- Intense competition among established players, including pricing pressure.
- Supply chain disruptions and material shortages impacting production and delivery timelines. This resulted in a xx% increase in device costs in 2022.
Emerging Opportunities in US Ophthalmic Devices Industry
Emerging opportunities include the growing demand for personalized medicine in ophthalmology, the development of new diagnostic tools for early disease detection, and the exploration of minimally invasive surgical techniques. The integration of AI and machine learning in diagnostic tools and surgical planning presents significant growth potential. Untapped markets include teleophthalmology and the development of affordable and accessible eye care solutions.
Growth Accelerators in the US Ophthalmic Devices Industry
Long-term growth will be accelerated by technological breakthroughs in areas such as gene therapy and regenerative medicine, as well as strategic partnerships between device manufacturers and healthcare providers. Expansion into underserved markets and the development of innovative business models will further fuel market growth.
Key Players Shaping the US Ophthalmic Devices Industry Market
- HAAG-Streit Group
- Ziemer Ophthalmic Systems AG
- Nidek Co Ltd
- EssilorLuxottica SA
- Johnson and Johnson
- Carl Zeiss AG
- Topcon Corporation
- Alcon Inc
- Bausch Health Companies Inc
- Hoya Corporation
Notable Milestones in US Ophthalmic Devices Industry Sector
- November 2022: Sight Sciences reported positive clinical data for its OMNI Surgical System in pseudophakic glaucoma patients. This highlights advancements in glaucoma treatment and may increase market adoption.
- August 2022: Glaukos Corporation received FDA clearance for its iStent infinite system, offering a new standalone treatment option for glaucoma. This expands treatment options and could significantly impact market share.
In-Depth US Ophthalmic Devices Industry Market Outlook
The US ophthalmic devices market is poised for significant growth over the forecast period, driven by technological advancements, an aging population, and increased healthcare spending. Strategic partnerships, expansion into emerging markets, and a focus on personalized medicine will further accelerate market expansion. The potential for disruptive technologies, such as AI-powered diagnostic tools and minimally invasive surgical robots, presents significant opportunities for industry players.
US Ophthalmic Devices Industry Segmentation
-
1. Devices
-
1.1. Surgical Devices
- 1.1.1. Glaucoma Drainage Devices
- 1.1.2. Glaucoma Stents and Implants
- 1.1.3. Intraocular Lenses
- 1.1.4. Lasers
- 1.1.5. Other Surgical Devices
-
1.2. Diagnostic and Monitoring Devices
- 1.2.1. Autorefractors and Keratometers
- 1.2.2. Corneal Topography Systems
- 1.2.3. Ophthalmic Ultrasound Imaging Systems
- 1.2.4. Ophthalmoscopes
- 1.2.5. Optical Coherence Tomography Scanners
- 1.2.6. Other Diagnostic and Monitoring Devices
-
1.3. Vision Correction Devices
- 1.3.1. Spectacles
- 1.3.2. Contact Lenses
-
1.1. Surgical Devices
US Ophthalmic Devices Industry Segmentation By Geography
-
1. North America
- 1.1. United States
- 1.2. Canada
- 1.3. Mexico
-
2. South America
- 2.1. Brazil
- 2.2. Argentina
- 2.3. Rest of South America
-
3. Europe
- 3.1. United Kingdom
- 3.2. Germany
- 3.3. France
- 3.4. Italy
- 3.5. Spain
- 3.6. Russia
- 3.7. Benelux
- 3.8. Nordics
- 3.9. Rest of Europe
-
4. Middle East & Africa
- 4.1. Turkey
- 4.2. Israel
- 4.3. GCC
- 4.4. North Africa
- 4.5. South Africa
- 4.6. Rest of Middle East & Africa
-
5. Asia Pacific
- 5.1. China
- 5.2. India
- 5.3. Japan
- 5.4. South Korea
- 5.5. ASEAN
- 5.6. Oceania
- 5.7. Rest of Asia Pacific
US Ophthalmic Devices Industry REPORT HIGHLIGHTS
| Aspects | Details |
|---|---|
| Study Period | 2019-2033 |
| Base Year | 2024 |
| Estimated Year | 2025 |
| Forecast Period | 2025-2033 |
| Historical Period | 2019-2024 |
| Growth Rate | CAGR of 6.90% from 2019-2033 |
| Segmentation |
|
Table of Contents
- 1. Introduction
- 1.1. Research Scope
- 1.2. Market Segmentation
- 1.3. Research Methodology
- 1.4. Definitions and Assumptions
- 2. Executive Summary
- 2.1. Introduction
- 3. Market Dynamics
- 3.1. Introduction
- 3.2. Market Drivers
- 3.2.1. Demographic Shift and Increasing Prevalence of Eye Diseases; Rising Geriatric Population; Technological Advancements in Ophthalmic Devices
- 3.3. Market Restrains
- 3.3.1. Risk Associated with Ophthalmic Procedures
- 3.4. Market Trends
- 3.4.1. Contact Lens are Expected to Register a Significant Growth in the United States Ophthalmic Devices Market Over the Forecast Period
- 4. Market Factor Analysis
- 4.1. Porters Five Forces
- 4.2. Supply/Value Chain
- 4.3. PESTEL analysis
- 4.4. Market Entropy
- 4.5. Patent/Trademark Analysis
- 5. Global US Ophthalmic Devices Industry Analysis, Insights and Forecast, 2019-2031
- 5.1. Market Analysis, Insights and Forecast - by Devices
- 5.1.1. Surgical Devices
- 5.1.1.1. Glaucoma Drainage Devices
- 5.1.1.2. Glaucoma Stents and Implants
- 5.1.1.3. Intraocular Lenses
- 5.1.1.4. Lasers
- 5.1.1.5. Other Surgical Devices
- 5.1.2. Diagnostic and Monitoring Devices
- 5.1.2.1. Autorefractors and Keratometers
- 5.1.2.2. Corneal Topography Systems
- 5.1.2.3. Ophthalmic Ultrasound Imaging Systems
- 5.1.2.4. Ophthalmoscopes
- 5.1.2.5. Optical Coherence Tomography Scanners
- 5.1.2.6. Other Diagnostic and Monitoring Devices
- 5.1.3. Vision Correction Devices
- 5.1.3.1. Spectacles
- 5.1.3.2. Contact Lenses
- 5.1.1. Surgical Devices
- 5.2. Market Analysis, Insights and Forecast - by Region
- 5.2.1. North America
- 5.2.2. South America
- 5.2.3. Europe
- 5.2.4. Middle East & Africa
- 5.2.5. Asia Pacific
- 5.1. Market Analysis, Insights and Forecast - by Devices
- 6. North America US Ophthalmic Devices Industry Analysis, Insights and Forecast, 2019-2031
- 6.1. Market Analysis, Insights and Forecast - by Devices
- 6.1.1. Surgical Devices
- 6.1.1.1. Glaucoma Drainage Devices
- 6.1.1.2. Glaucoma Stents and Implants
- 6.1.1.3. Intraocular Lenses
- 6.1.1.4. Lasers
- 6.1.1.5. Other Surgical Devices
- 6.1.2. Diagnostic and Monitoring Devices
- 6.1.2.1. Autorefractors and Keratometers
- 6.1.2.2. Corneal Topography Systems
- 6.1.2.3. Ophthalmic Ultrasound Imaging Systems
- 6.1.2.4. Ophthalmoscopes
- 6.1.2.5. Optical Coherence Tomography Scanners
- 6.1.2.6. Other Diagnostic and Monitoring Devices
- 6.1.3. Vision Correction Devices
- 6.1.3.1. Spectacles
- 6.1.3.2. Contact Lenses
- 6.1.1. Surgical Devices
- 6.1. Market Analysis, Insights and Forecast - by Devices
- 7. South America US Ophthalmic Devices Industry Analysis, Insights and Forecast, 2019-2031
- 7.1. Market Analysis, Insights and Forecast - by Devices
- 7.1.1. Surgical Devices
- 7.1.1.1. Glaucoma Drainage Devices
- 7.1.1.2. Glaucoma Stents and Implants
- 7.1.1.3. Intraocular Lenses
- 7.1.1.4. Lasers
- 7.1.1.5. Other Surgical Devices
- 7.1.2. Diagnostic and Monitoring Devices
- 7.1.2.1. Autorefractors and Keratometers
- 7.1.2.2. Corneal Topography Systems
- 7.1.2.3. Ophthalmic Ultrasound Imaging Systems
- 7.1.2.4. Ophthalmoscopes
- 7.1.2.5. Optical Coherence Tomography Scanners
- 7.1.2.6. Other Diagnostic and Monitoring Devices
- 7.1.3. Vision Correction Devices
- 7.1.3.1. Spectacles
- 7.1.3.2. Contact Lenses
- 7.1.1. Surgical Devices
- 7.1. Market Analysis, Insights and Forecast - by Devices
- 8. Europe US Ophthalmic Devices Industry Analysis, Insights and Forecast, 2019-2031
- 8.1. Market Analysis, Insights and Forecast - by Devices
- 8.1.1. Surgical Devices
- 8.1.1.1. Glaucoma Drainage Devices
- 8.1.1.2. Glaucoma Stents and Implants
- 8.1.1.3. Intraocular Lenses
- 8.1.1.4. Lasers
- 8.1.1.5. Other Surgical Devices
- 8.1.2. Diagnostic and Monitoring Devices
- 8.1.2.1. Autorefractors and Keratometers
- 8.1.2.2. Corneal Topography Systems
- 8.1.2.3. Ophthalmic Ultrasound Imaging Systems
- 8.1.2.4. Ophthalmoscopes
- 8.1.2.5. Optical Coherence Tomography Scanners
- 8.1.2.6. Other Diagnostic and Monitoring Devices
- 8.1.3. Vision Correction Devices
- 8.1.3.1. Spectacles
- 8.1.3.2. Contact Lenses
- 8.1.1. Surgical Devices
- 8.1. Market Analysis, Insights and Forecast - by Devices
- 9. Middle East & Africa US Ophthalmic Devices Industry Analysis, Insights and Forecast, 2019-2031
- 9.1. Market Analysis, Insights and Forecast - by Devices
- 9.1.1. Surgical Devices
- 9.1.1.1. Glaucoma Drainage Devices
- 9.1.1.2. Glaucoma Stents and Implants
- 9.1.1.3. Intraocular Lenses
- 9.1.1.4. Lasers
- 9.1.1.5. Other Surgical Devices
- 9.1.2. Diagnostic and Monitoring Devices
- 9.1.2.1. Autorefractors and Keratometers
- 9.1.2.2. Corneal Topography Systems
- 9.1.2.3. Ophthalmic Ultrasound Imaging Systems
- 9.1.2.4. Ophthalmoscopes
- 9.1.2.5. Optical Coherence Tomography Scanners
- 9.1.2.6. Other Diagnostic and Monitoring Devices
- 9.1.3. Vision Correction Devices
- 9.1.3.1. Spectacles
- 9.1.3.2. Contact Lenses
- 9.1.1. Surgical Devices
- 9.1. Market Analysis, Insights and Forecast - by Devices
- 10. Asia Pacific US Ophthalmic Devices Industry Analysis, Insights and Forecast, 2019-2031
- 10.1. Market Analysis, Insights and Forecast - by Devices
- 10.1.1. Surgical Devices
- 10.1.1.1. Glaucoma Drainage Devices
- 10.1.1.2. Glaucoma Stents and Implants
- 10.1.1.3. Intraocular Lenses
- 10.1.1.4. Lasers
- 10.1.1.5. Other Surgical Devices
- 10.1.2. Diagnostic and Monitoring Devices
- 10.1.2.1. Autorefractors and Keratometers
- 10.1.2.2. Corneal Topography Systems
- 10.1.2.3. Ophthalmic Ultrasound Imaging Systems
- 10.1.2.4. Ophthalmoscopes
- 10.1.2.5. Optical Coherence Tomography Scanners
- 10.1.2.6. Other Diagnostic and Monitoring Devices
- 10.1.3. Vision Correction Devices
- 10.1.3.1. Spectacles
- 10.1.3.2. Contact Lenses
- 10.1.1. Surgical Devices
- 10.1. Market Analysis, Insights and Forecast - by Devices
- 11. Northeast US Ophthalmic Devices Industry Analysis, Insights and Forecast, 2019-2031
- 12. Southeast US Ophthalmic Devices Industry Analysis, Insights and Forecast, 2019-2031
- 13. Midwest US Ophthalmic Devices Industry Analysis, Insights and Forecast, 2019-2031
- 14. Southwest US Ophthalmic Devices Industry Analysis, Insights and Forecast, 2019-2031
- 15. West US Ophthalmic Devices Industry Analysis, Insights and Forecast, 2019-2031
- 16. Competitive Analysis
- 16.1. Global Market Share Analysis 2024
- 16.2. Company Profiles
- 16.2.1 HAAG-Streit Group
- 16.2.1.1. Overview
- 16.2.1.2. Products
- 16.2.1.3. SWOT Analysis
- 16.2.1.4. Recent Developments
- 16.2.1.5. Financials (Based on Availability)
- 16.2.2 Ziemer Ophthalmic Systems AG
- 16.2.2.1. Overview
- 16.2.2.2. Products
- 16.2.2.3. SWOT Analysis
- 16.2.2.4. Recent Developments
- 16.2.2.5. Financials (Based on Availability)
- 16.2.3 Nidek Co Ltd
- 16.2.3.1. Overview
- 16.2.3.2. Products
- 16.2.3.3. SWOT Analysis
- 16.2.3.4. Recent Developments
- 16.2.3.5. Financials (Based on Availability)
- 16.2.4 EssilorLuxottica SA
- 16.2.4.1. Overview
- 16.2.4.2. Products
- 16.2.4.3. SWOT Analysis
- 16.2.4.4. Recent Developments
- 16.2.4.5. Financials (Based on Availability)
- 16.2.5 Johnson and Johnson
- 16.2.5.1. Overview
- 16.2.5.2. Products
- 16.2.5.3. SWOT Analysis
- 16.2.5.4. Recent Developments
- 16.2.5.5. Financials (Based on Availability)
- 16.2.6 Carl Zeiss AG
- 16.2.6.1. Overview
- 16.2.6.2. Products
- 16.2.6.3. SWOT Analysis
- 16.2.6.4. Recent Developments
- 16.2.6.5. Financials (Based on Availability)
- 16.2.7 Topcon Corporation
- 16.2.7.1. Overview
- 16.2.7.2. Products
- 16.2.7.3. SWOT Analysis
- 16.2.7.4. Recent Developments
- 16.2.7.5. Financials (Based on Availability)
- 16.2.8 Alcon Inc
- 16.2.8.1. Overview
- 16.2.8.2. Products
- 16.2.8.3. SWOT Analysis
- 16.2.8.4. Recent Developments
- 16.2.8.5. Financials (Based on Availability)
- 16.2.9 Bausch Health Companies Inc
- 16.2.9.1. Overview
- 16.2.9.2. Products
- 16.2.9.3. SWOT Analysis
- 16.2.9.4. Recent Developments
- 16.2.9.5. Financials (Based on Availability)
- 16.2.10 Hoya Corporation
- 16.2.10.1. Overview
- 16.2.10.2. Products
- 16.2.10.3. SWOT Analysis
- 16.2.10.4. Recent Developments
- 16.2.10.5. Financials (Based on Availability)
- 16.2.1 HAAG-Streit Group
List of Figures
- Figure 1: Global US Ophthalmic Devices Industry Revenue Breakdown (Million, %) by Region 2024 & 2032
- Figure 2: Global US Ophthalmic Devices Industry Volume Breakdown (K Unit, %) by Region 2024 & 2032
- Figure 3: United states US Ophthalmic Devices Industry Revenue (Million), by Country 2024 & 2032
- Figure 4: United states US Ophthalmic Devices Industry Volume (K Unit), by Country 2024 & 2032
- Figure 5: United states US Ophthalmic Devices Industry Revenue Share (%), by Country 2024 & 2032
- Figure 6: United states US Ophthalmic Devices Industry Volume Share (%), by Country 2024 & 2032
- Figure 7: North America US Ophthalmic Devices Industry Revenue (Million), by Devices 2024 & 2032
- Figure 8: North America US Ophthalmic Devices Industry Volume (K Unit), by Devices 2024 & 2032
- Figure 9: North America US Ophthalmic Devices Industry Revenue Share (%), by Devices 2024 & 2032
- Figure 10: North America US Ophthalmic Devices Industry Volume Share (%), by Devices 2024 & 2032
- Figure 11: North America US Ophthalmic Devices Industry Revenue (Million), by Country 2024 & 2032
- Figure 12: North America US Ophthalmic Devices Industry Volume (K Unit), by Country 2024 & 2032
- Figure 13: North America US Ophthalmic Devices Industry Revenue Share (%), by Country 2024 & 2032
- Figure 14: North America US Ophthalmic Devices Industry Volume Share (%), by Country 2024 & 2032
- Figure 15: South America US Ophthalmic Devices Industry Revenue (Million), by Devices 2024 & 2032
- Figure 16: South America US Ophthalmic Devices Industry Volume (K Unit), by Devices 2024 & 2032
- Figure 17: South America US Ophthalmic Devices Industry Revenue Share (%), by Devices 2024 & 2032
- Figure 18: South America US Ophthalmic Devices Industry Volume Share (%), by Devices 2024 & 2032
- Figure 19: South America US Ophthalmic Devices Industry Revenue (Million), by Country 2024 & 2032
- Figure 20: South America US Ophthalmic Devices Industry Volume (K Unit), by Country 2024 & 2032
- Figure 21: South America US Ophthalmic Devices Industry Revenue Share (%), by Country 2024 & 2032
- Figure 22: South America US Ophthalmic Devices Industry Volume Share (%), by Country 2024 & 2032
- Figure 23: Europe US Ophthalmic Devices Industry Revenue (Million), by Devices 2024 & 2032
- Figure 24: Europe US Ophthalmic Devices Industry Volume (K Unit), by Devices 2024 & 2032
- Figure 25: Europe US Ophthalmic Devices Industry Revenue Share (%), by Devices 2024 & 2032
- Figure 26: Europe US Ophthalmic Devices Industry Volume Share (%), by Devices 2024 & 2032
- Figure 27: Europe US Ophthalmic Devices Industry Revenue (Million), by Country 2024 & 2032
- Figure 28: Europe US Ophthalmic Devices Industry Volume (K Unit), by Country 2024 & 2032
- Figure 29: Europe US Ophthalmic Devices Industry Revenue Share (%), by Country 2024 & 2032
- Figure 30: Europe US Ophthalmic Devices Industry Volume Share (%), by Country 2024 & 2032
- Figure 31: Middle East & Africa US Ophthalmic Devices Industry Revenue (Million), by Devices 2024 & 2032
- Figure 32: Middle East & Africa US Ophthalmic Devices Industry Volume (K Unit), by Devices 2024 & 2032
- Figure 33: Middle East & Africa US Ophthalmic Devices Industry Revenue Share (%), by Devices 2024 & 2032
- Figure 34: Middle East & Africa US Ophthalmic Devices Industry Volume Share (%), by Devices 2024 & 2032
- Figure 35: Middle East & Africa US Ophthalmic Devices Industry Revenue (Million), by Country 2024 & 2032
- Figure 36: Middle East & Africa US Ophthalmic Devices Industry Volume (K Unit), by Country 2024 & 2032
- Figure 37: Middle East & Africa US Ophthalmic Devices Industry Revenue Share (%), by Country 2024 & 2032
- Figure 38: Middle East & Africa US Ophthalmic Devices Industry Volume Share (%), by Country 2024 & 2032
- Figure 39: Asia Pacific US Ophthalmic Devices Industry Revenue (Million), by Devices 2024 & 2032
- Figure 40: Asia Pacific US Ophthalmic Devices Industry Volume (K Unit), by Devices 2024 & 2032
- Figure 41: Asia Pacific US Ophthalmic Devices Industry Revenue Share (%), by Devices 2024 & 2032
- Figure 42: Asia Pacific US Ophthalmic Devices Industry Volume Share (%), by Devices 2024 & 2032
- Figure 43: Asia Pacific US Ophthalmic Devices Industry Revenue (Million), by Country 2024 & 2032
- Figure 44: Asia Pacific US Ophthalmic Devices Industry Volume (K Unit), by Country 2024 & 2032
- Figure 45: Asia Pacific US Ophthalmic Devices Industry Revenue Share (%), by Country 2024 & 2032
- Figure 46: Asia Pacific US Ophthalmic Devices Industry Volume Share (%), by Country 2024 & 2032
List of Tables
- Table 1: Global US Ophthalmic Devices Industry Revenue Million Forecast, by Region 2019 & 2032
- Table 2: Global US Ophthalmic Devices Industry Volume K Unit Forecast, by Region 2019 & 2032
- Table 3: Global US Ophthalmic Devices Industry Revenue Million Forecast, by Devices 2019 & 2032
- Table 4: Global US Ophthalmic Devices Industry Volume K Unit Forecast, by Devices 2019 & 2032
- Table 5: Global US Ophthalmic Devices Industry Revenue Million Forecast, by Region 2019 & 2032
- Table 6: Global US Ophthalmic Devices Industry Volume K Unit Forecast, by Region 2019 & 2032
- Table 7: Global US Ophthalmic Devices Industry Revenue Million Forecast, by Country 2019 & 2032
- Table 8: Global US Ophthalmic Devices Industry Volume K Unit Forecast, by Country 2019 & 2032
- Table 9: Northeast US Ophthalmic Devices Industry Revenue (Million) Forecast, by Application 2019 & 2032
- Table 10: Northeast US Ophthalmic Devices Industry Volume (K Unit) Forecast, by Application 2019 & 2032
- Table 11: Southeast US Ophthalmic Devices Industry Revenue (Million) Forecast, by Application 2019 & 2032
- Table 12: Southeast US Ophthalmic Devices Industry Volume (K Unit) Forecast, by Application 2019 & 2032
- Table 13: Midwest US Ophthalmic Devices Industry Revenue (Million) Forecast, by Application 2019 & 2032
- Table 14: Midwest US Ophthalmic Devices Industry Volume (K Unit) Forecast, by Application 2019 & 2032
- Table 15: Southwest US Ophthalmic Devices Industry Revenue (Million) Forecast, by Application 2019 & 2032
- Table 16: Southwest US Ophthalmic Devices Industry Volume (K Unit) Forecast, by Application 2019 & 2032
- Table 17: West US Ophthalmic Devices Industry Revenue (Million) Forecast, by Application 2019 & 2032
- Table 18: West US Ophthalmic Devices Industry Volume (K Unit) Forecast, by Application 2019 & 2032
- Table 19: Global US Ophthalmic Devices Industry Revenue Million Forecast, by Devices 2019 & 2032
- Table 20: Global US Ophthalmic Devices Industry Volume K Unit Forecast, by Devices 2019 & 2032
- Table 21: Global US Ophthalmic Devices Industry Revenue Million Forecast, by Country 2019 & 2032
- Table 22: Global US Ophthalmic Devices Industry Volume K Unit Forecast, by Country 2019 & 2032
- Table 23: United States US Ophthalmic Devices Industry Revenue (Million) Forecast, by Application 2019 & 2032
- Table 24: United States US Ophthalmic Devices Industry Volume (K Unit) Forecast, by Application 2019 & 2032
- Table 25: Canada US Ophthalmic Devices Industry Revenue (Million) Forecast, by Application 2019 & 2032
- Table 26: Canada US Ophthalmic Devices Industry Volume (K Unit) Forecast, by Application 2019 & 2032
- Table 27: Mexico US Ophthalmic Devices Industry Revenue (Million) Forecast, by Application 2019 & 2032
- Table 28: Mexico US Ophthalmic Devices Industry Volume (K Unit) Forecast, by Application 2019 & 2032
- Table 29: Global US Ophthalmic Devices Industry Revenue Million Forecast, by Devices 2019 & 2032
- Table 30: Global US Ophthalmic Devices Industry Volume K Unit Forecast, by Devices 2019 & 2032
- Table 31: Global US Ophthalmic Devices Industry Revenue Million Forecast, by Country 2019 & 2032
- Table 32: Global US Ophthalmic Devices Industry Volume K Unit Forecast, by Country 2019 & 2032
- Table 33: Brazil US Ophthalmic Devices Industry Revenue (Million) Forecast, by Application 2019 & 2032
- Table 34: Brazil US Ophthalmic Devices Industry Volume (K Unit) Forecast, by Application 2019 & 2032
- Table 35: Argentina US Ophthalmic Devices Industry Revenue (Million) Forecast, by Application 2019 & 2032
- Table 36: Argentina US Ophthalmic Devices Industry Volume (K Unit) Forecast, by Application 2019 & 2032
- Table 37: Rest of South America US Ophthalmic Devices Industry Revenue (Million) Forecast, by Application 2019 & 2032
- Table 38: Rest of South America US Ophthalmic Devices Industry Volume (K Unit) Forecast, by Application 2019 & 2032
- Table 39: Global US Ophthalmic Devices Industry Revenue Million Forecast, by Devices 2019 & 2032
- Table 40: Global US Ophthalmic Devices Industry Volume K Unit Forecast, by Devices 2019 & 2032
- Table 41: Global US Ophthalmic Devices Industry Revenue Million Forecast, by Country 2019 & 2032
- Table 42: Global US Ophthalmic Devices Industry Volume K Unit Forecast, by Country 2019 & 2032
- Table 43: United Kingdom US Ophthalmic Devices Industry Revenue (Million) Forecast, by Application 2019 & 2032
- Table 44: United Kingdom US Ophthalmic Devices Industry Volume (K Unit) Forecast, by Application 2019 & 2032
- Table 45: Germany US Ophthalmic Devices Industry Revenue (Million) Forecast, by Application 2019 & 2032
- Table 46: Germany US Ophthalmic Devices Industry Volume (K Unit) Forecast, by Application 2019 & 2032
- Table 47: France US Ophthalmic Devices Industry Revenue (Million) Forecast, by Application 2019 & 2032
- Table 48: France US Ophthalmic Devices Industry Volume (K Unit) Forecast, by Application 2019 & 2032
- Table 49: Italy US Ophthalmic Devices Industry Revenue (Million) Forecast, by Application 2019 & 2032
- Table 50: Italy US Ophthalmic Devices Industry Volume (K Unit) Forecast, by Application 2019 & 2032
- Table 51: Spain US Ophthalmic Devices Industry Revenue (Million) Forecast, by Application 2019 & 2032
- Table 52: Spain US Ophthalmic Devices Industry Volume (K Unit) Forecast, by Application 2019 & 2032
- Table 53: Russia US Ophthalmic Devices Industry Revenue (Million) Forecast, by Application 2019 & 2032
- Table 54: Russia US Ophthalmic Devices Industry Volume (K Unit) Forecast, by Application 2019 & 2032
- Table 55: Benelux US Ophthalmic Devices Industry Revenue (Million) Forecast, by Application 2019 & 2032
- Table 56: Benelux US Ophthalmic Devices Industry Volume (K Unit) Forecast, by Application 2019 & 2032
- Table 57: Nordics US Ophthalmic Devices Industry Revenue (Million) Forecast, by Application 2019 & 2032
- Table 58: Nordics US Ophthalmic Devices Industry Volume (K Unit) Forecast, by Application 2019 & 2032
- Table 59: Rest of Europe US Ophthalmic Devices Industry Revenue (Million) Forecast, by Application 2019 & 2032
- Table 60: Rest of Europe US Ophthalmic Devices Industry Volume (K Unit) Forecast, by Application 2019 & 2032
- Table 61: Global US Ophthalmic Devices Industry Revenue Million Forecast, by Devices 2019 & 2032
- Table 62: Global US Ophthalmic Devices Industry Volume K Unit Forecast, by Devices 2019 & 2032
- Table 63: Global US Ophthalmic Devices Industry Revenue Million Forecast, by Country 2019 & 2032
- Table 64: Global US Ophthalmic Devices Industry Volume K Unit Forecast, by Country 2019 & 2032
- Table 65: Turkey US Ophthalmic Devices Industry Revenue (Million) Forecast, by Application 2019 & 2032
- Table 66: Turkey US Ophthalmic Devices Industry Volume (K Unit) Forecast, by Application 2019 & 2032
- Table 67: Israel US Ophthalmic Devices Industry Revenue (Million) Forecast, by Application 2019 & 2032
- Table 68: Israel US Ophthalmic Devices Industry Volume (K Unit) Forecast, by Application 2019 & 2032
- Table 69: GCC US Ophthalmic Devices Industry Revenue (Million) Forecast, by Application 2019 & 2032
- Table 70: GCC US Ophthalmic Devices Industry Volume (K Unit) Forecast, by Application 2019 & 2032
- Table 71: North Africa US Ophthalmic Devices Industry Revenue (Million) Forecast, by Application 2019 & 2032
- Table 72: North Africa US Ophthalmic Devices Industry Volume (K Unit) Forecast, by Application 2019 & 2032
- Table 73: South Africa US Ophthalmic Devices Industry Revenue (Million) Forecast, by Application 2019 & 2032
- Table 74: South Africa US Ophthalmic Devices Industry Volume (K Unit) Forecast, by Application 2019 & 2032
- Table 75: Rest of Middle East & Africa US Ophthalmic Devices Industry Revenue (Million) Forecast, by Application 2019 & 2032
- Table 76: Rest of Middle East & Africa US Ophthalmic Devices Industry Volume (K Unit) Forecast, by Application 2019 & 2032
- Table 77: Global US Ophthalmic Devices Industry Revenue Million Forecast, by Devices 2019 & 2032
- Table 78: Global US Ophthalmic Devices Industry Volume K Unit Forecast, by Devices 2019 & 2032
- Table 79: Global US Ophthalmic Devices Industry Revenue Million Forecast, by Country 2019 & 2032
- Table 80: Global US Ophthalmic Devices Industry Volume K Unit Forecast, by Country 2019 & 2032
- Table 81: China US Ophthalmic Devices Industry Revenue (Million) Forecast, by Application 2019 & 2032
- Table 82: China US Ophthalmic Devices Industry Volume (K Unit) Forecast, by Application 2019 & 2032
- Table 83: India US Ophthalmic Devices Industry Revenue (Million) Forecast, by Application 2019 & 2032
- Table 84: India US Ophthalmic Devices Industry Volume (K Unit) Forecast, by Application 2019 & 2032
- Table 85: Japan US Ophthalmic Devices Industry Revenue (Million) Forecast, by Application 2019 & 2032
- Table 86: Japan US Ophthalmic Devices Industry Volume (K Unit) Forecast, by Application 2019 & 2032
- Table 87: South Korea US Ophthalmic Devices Industry Revenue (Million) Forecast, by Application 2019 & 2032
- Table 88: South Korea US Ophthalmic Devices Industry Volume (K Unit) Forecast, by Application 2019 & 2032
- Table 89: ASEAN US Ophthalmic Devices Industry Revenue (Million) Forecast, by Application 2019 & 2032
- Table 90: ASEAN US Ophthalmic Devices Industry Volume (K Unit) Forecast, by Application 2019 & 2032
- Table 91: Oceania US Ophthalmic Devices Industry Revenue (Million) Forecast, by Application 2019 & 2032
- Table 92: Oceania US Ophthalmic Devices Industry Volume (K Unit) Forecast, by Application 2019 & 2032
- Table 93: Rest of Asia Pacific US Ophthalmic Devices Industry Revenue (Million) Forecast, by Application 2019 & 2032
- Table 94: Rest of Asia Pacific US Ophthalmic Devices Industry Volume (K Unit) Forecast, by Application 2019 & 2032
Frequently Asked Questions
1. What is the projected Compound Annual Growth Rate (CAGR) of the US Ophthalmic Devices Industry?
The projected CAGR is approximately 6.90%.
2. Which companies are prominent players in the US Ophthalmic Devices Industry?
Key companies in the market include HAAG-Streit Group, Ziemer Ophthalmic Systems AG, Nidek Co Ltd, EssilorLuxottica SA, Johnson and Johnson, Carl Zeiss AG, Topcon Corporation, Alcon Inc, Bausch Health Companies Inc, Hoya Corporation.
3. What are the main segments of the US Ophthalmic Devices Industry?
The market segments include Devices.
4. Can you provide details about the market size?
The market size is estimated to be USD XX Million as of 2022.
5. What are some drivers contributing to market growth?
Demographic Shift and Increasing Prevalence of Eye Diseases; Rising Geriatric Population; Technological Advancements in Ophthalmic Devices.
6. What are the notable trends driving market growth?
Contact Lens are Expected to Register a Significant Growth in the United States Ophthalmic Devices Market Over the Forecast Period.
7. Are there any restraints impacting market growth?
Risk Associated with Ophthalmic Procedures.
8. Can you provide examples of recent developments in the market?
November 2022: Sight Sciences reported a publication of clinical data demonstrating the standalone effectiveness of the OMNI Surgical System in pseudophakic glaucoma patients with uncontrolled pressure following a previous combination cataract stent procedure.
9. What pricing options are available for accessing the report?
Pricing options include single-user, multi-user, and enterprise licenses priced at USD 3800, USD 4500, and USD 5800 respectively.
10. Is the market size provided in terms of value or volume?
The market size is provided in terms of value, measured in Million and volume, measured in K Unit.
11. Are there any specific market keywords associated with the report?
Yes, the market keyword associated with the report is "US Ophthalmic Devices Industry," which aids in identifying and referencing the specific market segment covered.
12. How do I determine which pricing option suits my needs best?
The pricing options vary based on user requirements and access needs. Individual users may opt for single-user licenses, while businesses requiring broader access may choose multi-user or enterprise licenses for cost-effective access to the report.
13. Are there any additional resources or data provided in the US Ophthalmic Devices Industry report?
While the report offers comprehensive insights, it's advisable to review the specific contents or supplementary materials provided to ascertain if additional resources or data are available.
14. How can I stay updated on further developments or reports in the US Ophthalmic Devices Industry?
To stay informed about further developments, trends, and reports in the US Ophthalmic Devices Industry, consider subscribing to industry newsletters, following relevant companies and organizations, or regularly checking reputable industry news sources and publications.
Methodology
Step 1 - Identification of Relevant Samples Size from Population Database


Step 2 - Approaches for Defining Global Market Size (Value, Volume* & Price*)

Note*: In applicable scenarios
Step 3 - Data Sources
Primary Research
- Web Analytics
- Survey Reports
- Research Institute
- Latest Research Reports
- Opinion Leaders
Secondary Research
- Annual Reports
- White Paper
- Latest Press Release
- Industry Association
- Paid Database
- Investor Presentations

Step 4 - Data Triangulation
Involves using different sources of information in order to increase the validity of a study
These sources are likely to be stakeholders in a program - participants, other researchers, program staff, other community members, and so on.
Then we put all data in single framework & apply various statistical tools to find out the dynamic on the market.
During the analysis stage, feedback from the stakeholder groups would be compared to determine areas of agreement as well as areas of divergence


