
Key Insights
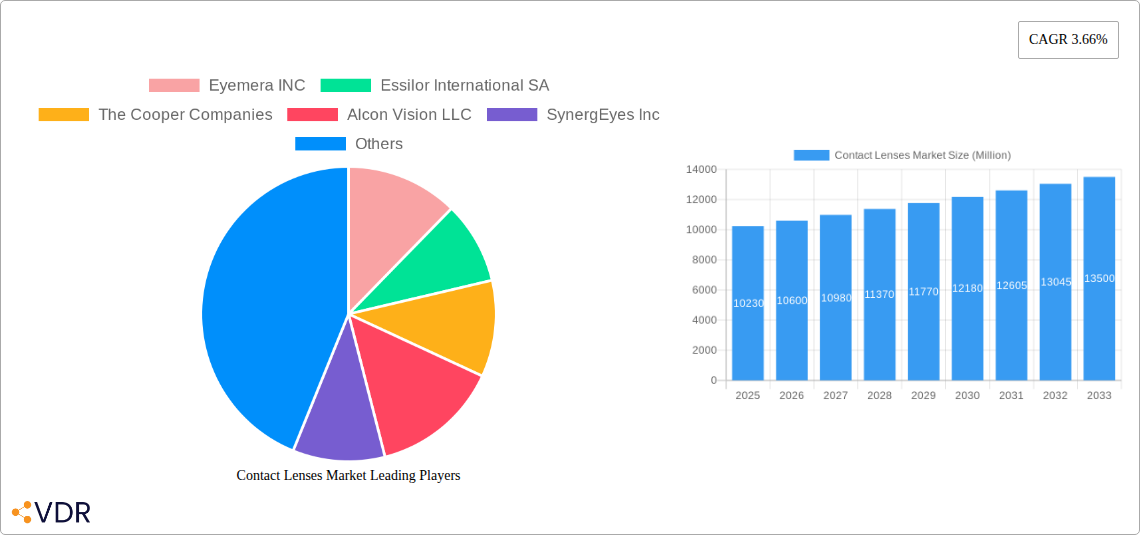
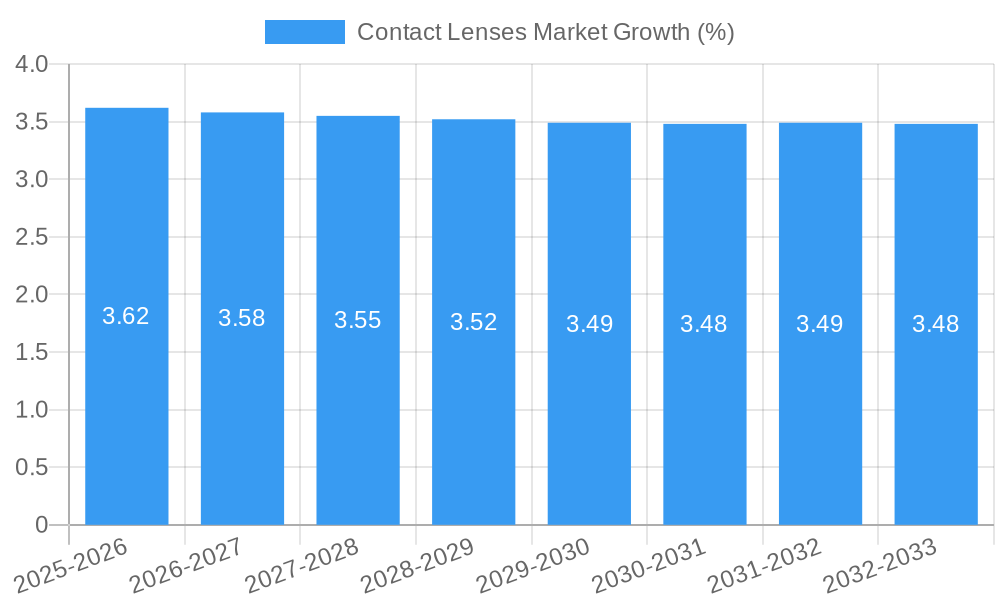
The global Contact Lenses Market is projected for robust growth, reaching an estimated USD 10.23 billion in 2025 with a Compound Annual Growth Rate (CAGR) of 3.66% from 2019 to 2033. This expansion is fueled by a confluence of factors, including the increasing prevalence of vision impairments worldwide, a growing emphasis on aesthetic appeal driving demand for cosmetic contact lenses, and significant technological advancements in lens materials and designs. The rising disposable incomes, particularly in emerging economies, are also contributing to greater accessibility and adoption of contact lenses as a preferred alternative to eyeglasses. Furthermore, the escalating awareness regarding eye health and the availability of specialized lenses for therapeutic and prosthetic purposes are poised to sustain this positive market trajectory. The market is segmented across various product types, usage applications, modalities, and designs, indicating a diverse and dynamic landscape catering to a broad spectrum of consumer needs and preferences.
Leading players such as Johnson & Johnson Vision Care Inc., Alcon Vision LLC, and Essilor International SA are actively investing in research and development to introduce innovative products, including advanced disposable lenses and multifocal designs, to capture market share. The market is also witnessing a growing trend towards personalized lens solutions and enhanced wearer comfort. While the market presents significant opportunities, certain restraints, such as the high cost of some specialized lenses and the potential for eye infections if proper hygiene is not maintained, may temper growth in specific segments. However, the overarching demand for vision correction and enhancement, coupled with ongoing product innovation and expanding distribution networks, suggests a favorable outlook for the global contact lens industry in the coming years.
Dive deep into the dynamic Contact Lenses Market with this comprehensive report, meticulously analyzing global trends, innovations, and growth trajectories. Covering the period from 2019 to 2033, with a base year of 2025 and a detailed forecast period of 2025–2033, this report provides unparalleled insights into the contact lens industry. Explore the intricate parent market of vision care and the sub-segments of child markets like soft contact lenses, hybrid contact lenses, and rigid gas permeable contact lenses. Understand the evolution of corrective contact lenses, therapeutic contact lenses, cosmetic contact lenses, and prosthetic contact lenses that are transforming visual health and aesthetics.
This SEO-optimized report integrates high-traffic keywords such as "contact lens market analysis," "soft contact lens market share," "disposable contact lenses growth," "multifocal contact lens trends," and "eyecare market opportunities" to maximize search engine visibility. Gain strategic advantage by understanding the nuances of conventional vs. disposable contact lenses, and the impact of spherical, toric, and multifocal designs.
Contact Lenses Market Market Dynamics & Structure
The global Contact Lenses Market is characterized by a moderate to high level of concentration, with major players investing heavily in research and development to drive technological innovation. Key drivers include an increasing prevalence of refractive errors, a growing demand for vision correction alternatives to eyeglasses, and a rising awareness of ocular health. The regulatory landscape, governed by bodies like the FDA and EMA, influences product approvals and market entry, ensuring safety and efficacy. Competitive product substitutes primarily include eyeglasses, refractive surgery, and increasingly, advanced contact lens technologies. End-user demographics are broad, spanning age groups from teenagers to the elderly, with a growing segment of younger consumers opting for cosmetic contact lenses. Mergers and acquisitions (M&A) are a significant trend, aimed at expanding product portfolios, geographic reach, and technological capabilities.
- Market Concentration: Dominated by a few key global players, but with significant opportunities for niche market participants.
- Technological Innovation Drivers: Advancements in silicone hydrogel materials, multi-focal designs, and specialized lenses for specific eye conditions.
- Regulatory Frameworks: Stringent approval processes from health authorities like the FDA, ensuring product safety and efficacy.
- Competitive Product Substitutes: Eyeglasses, LASIK surgery, and other vision correction methods.
- End-User Demographics: Broad appeal across age groups, with a rising trend in aesthetic and lifestyle-driven purchases.
- M&A Trends: Strategic acquisitions to consolidate market share and acquire innovative technologies, with approximately 5-7 significant M&A deals observed annually in the broader eyecare sector impacting contact lens manufacturers.
Contact Lenses Market Growth Trends & Insights
The Contact Lenses Market is poised for robust growth, driven by a confluence of factors that are reshaping visual correction and enhancement. The market size is projected to expand significantly, fueled by increasing adoption rates of both corrective and cosmetic contact lenses worldwide. Technological disruptions are at the forefront, with innovations in material science, lens design, and manufacturing processes continuously improving wearer comfort, vision quality, and eye health. Consumer behavior shifts are also playing a crucial role; a growing preference for convenience, active lifestyles, and aesthetic self-expression is accelerating the demand for disposable contact lenses and cosmetic contact lenses. The rising disposable incomes in emerging economies further contribute to increased market penetration, as more individuals can afford advanced vision correction solutions.
- Market Size Evolution: Expected to grow from an estimated $12,500 million units in 2025 to over $18,000 million units by 2033, exhibiting a Compound Annual Growth Rate (CAGR) of approximately 5.8% during the forecast period.
- Adoption Rates: Steady increase in the adoption of daily disposable contact lenses, projected to reach over 70% of the total disposable lens market by 2033.
- Technological Disruptions: Introduction of smart contact lenses with integrated sensors and augmented reality capabilities, though still in nascent stages, are anticipated to drive future market expansion.
- Consumer Behavior Shifts: Growing demand for personalized vision solutions and a greater emphasis on eye health awareness are influencing purchasing decisions.
- Market Penetration: Significant growth potential in Asia-Pacific and Latin America, where market penetration is currently lower compared to North America and Europe.
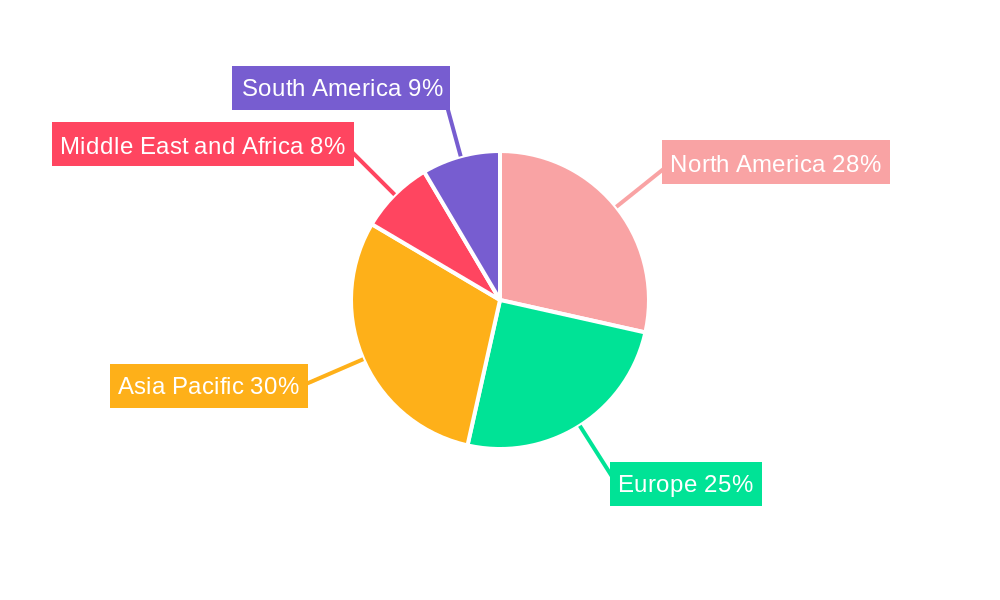
Dominant Regions, Countries, or Segments in Contact Lenses Market
The Contact Lenses Market is witnessing significant growth across various regions and segments, with North America currently holding a dominant position. This dominance is attributed to a combination of factors including a high prevalence of refractive errors, advanced healthcare infrastructure, strong purchasing power, and a well-established presence of leading contact lens manufacturers. The United States, within North America, is a pivotal market, driven by an aging population, increasing awareness of eye health, and the widespread availability of advanced contact lens products.
Among the product types, Soft Contact Lenses are the most dominant segment, commanding a substantial market share. Their popularity stems from superior comfort, ease of use, and availability in a wide array of designs and modalities. The growing preference for disposable contact lenses, particularly daily disposables, further amplifies the dominance of soft lenses. In terms of usage, Corrective Contact Lenses represent the largest segment, addressing the widespread need for vision correction. However, Cosmetic Contact Lenses are exhibiting a rapid growth rate, driven by fashion trends and social media influence.
The Disposable Modality is rapidly overtaking conventional lenses due to its convenience, hygiene, and reduced risk of infection. Designs such as Spherical lenses remain popular for basic refractive error correction, while Toric lenses for astigmatism and Multifocal lenses for presbyopia are gaining considerable traction, reflecting a demand for more specialized vision solutions.
- Dominant Region: North America, driven by high disposable incomes, advanced healthcare systems, and strong market penetration.
- Key Country: United States, accounting for a significant portion of the North American market share due to a large patient pool and adoption of innovative products.
- Dominant Product Type: Soft Contact Lenses, favored for comfort and versatility, projected to hold over 85% of the total product type market share by 2033.
- Dominant Usage: Corrective Contact Lenses, addressing a vast global demand for vision correction.
- Growing Usage Segment: Cosmetic Contact Lenses, experiencing a CAGR of over 7% due to evolving consumer preferences and aesthetic trends.
- Dominant Modality: Disposable Contact Lenses, with daily disposables leading the market due to convenience and hygiene, projected to capture over 75% of the modality market by 2033.
- Key Design Trends: Increasing demand for Toric and Multifocal designs to address specific vision needs beyond simple myopia and hyperopia.
Contact Lenses Market Product Landscape
The Contact Lenses Market product landscape is defined by continuous innovation focused on enhanced wearer experience, ocular health, and expanded functionality. Soft Contact Lenses, primarily made from silicone hydrogel materials, offer superior oxygen permeability and comfort, making them the most widely adopted category. Hybrid contact lenses, combining a rigid gas permeable center with a soft skirt, provide the visual clarity of RGP lenses with enhanced comfort. Rigid Gas Permeable (RGP) lenses, though a smaller segment, are crucial for specific vision impairments like keratoconus, offering exceptional visual acuity. Emerging "Other Product Types" are exploring novel materials and functionalities. Corrective Contact Lenses remain the largest application, with advancements in multifocal and toric designs significantly improving vision correction for presbyopia and astigmatism. Therapeutic Contact Lenses are gaining traction for drug delivery and management of ocular diseases. Cosmetic Contact Lenses offer aesthetic enhancements with a growing range of colors and effects.
Key Drivers, Barriers & Challenges in Contact Lenses Market
The Contact Lenses Market is propelled by several key drivers, including the rising global incidence of vision disorders such as myopia and presbyopia, a growing preference for discreet and convenient vision correction over eyeglasses, and significant advancements in material science leading to more comfortable and healthier lens options. Technological innovations in disposable contact lenses and specialized designs like multifocal contact lenses are further fueling market growth.
However, the market also faces several barriers and challenges. High manufacturing costs and the stringent regulatory approval processes for new products can hinder market entry and innovation speed. Supply chain disruptions, particularly for specialized materials, can impact production and availability. Intense competition from both established players and emerging brands, as well as the continuous threat from alternative vision correction methods like laser eye surgery, pose significant challenges. Price sensitivity in certain demographic segments and the need for consistent patient compliance with lens care regimens also represent hurdles.
Emerging Opportunities in Contact Lenses Market
The Contact Lenses Market is ripe with emerging opportunities, particularly in the development of smart contact lenses equipped with advanced sensors for continuous intraocular pressure monitoring, glucose sensing, and even augmented reality integration. The growing demand for cosmetic contact lenses among younger demographics presents a significant expansion avenue, with opportunities for innovative colors, effects, and personalized designs. Furthermore, the increasing prevalence of dry eye syndrome creates a niche for specialized therapeutic contact lenses designed to manage this condition and deliver sustained lubrication. Untapped markets in developing economies, where awareness of advanced vision correction is growing, offer substantial potential for market penetration. The evolution of prosthetic contact lenses for post-surgical or injury-related ocular reconstruction also represents a growing, albeit specialized, opportunity.
Growth Accelerators in the Contact Lenses Market Industry
Several catalysts are accelerating the long-term growth of the Contact Lenses Market. Technological breakthroughs in material science, particularly the development of advanced hydrogels with enhanced oxygen permeability and moisture retention, are improving wearer comfort and enabling longer wear times. Strategic partnerships between contact lens manufacturers and technology companies are paving the way for the integration of digital features and smart capabilities into contact lenses. Market expansion strategies, including targeted marketing campaigns for younger demographics and increasing penetration in emerging economies, are broadening the consumer base. The continuous innovation in disposable contact lenses, driven by convenience and hygiene benefits, is a significant growth accelerator, alongside the expanding portfolio of multifocal contact lenses addressing the needs of the aging population.
Key Players Shaping the Contact Lenses Market Market
- Eyemera INC
- Essilor International SA
- The Cooper Companies
- Alcon Vision LLC
- SynergEyes Inc
- Menicon Co Ltd
- Zeiss Group
- Johnson & Johnson Vision Care Inc
- Seed Co Ltd
- Bausch Health Companies Inc
- Hoya Corporation
Notable Milestones in Contact Lenses Market Sector
- June 2022: Johnson & Johnson Vision, a part of Johnson & Johnson MedTech, received FDA clearance for its latest contact lens innovation, ACUVUE OASYS MAX 1-Day and ACUVUE OASYS MAX 1-Day MULTIFOCAL, enhancing comfort and visual performance.
- April 2022: Alcon launched Precision, a disposable contact lens for astigmatism in Canada. The daily disposable silicone hydrogel (SiHy) contact lenses are designed for astigmatic patients, continuing Alcon's mission to help people's vision.
In-Depth Contact Lenses Market Market Outlook
The Contact Lenses Market is projected for sustained and dynamic growth, driven by ongoing innovation and expanding consumer needs. The increasing adoption of disposable contact lenses, particularly daily disposables, along with the continuous advancements in multifocal contact lenses to address presbyopia, will remain key growth accelerators. The burgeoning demand for cosmetic contact lenses and the potential of smart contact lenses for integrated health monitoring and augmented reality applications represent significant future growth frontiers. Strategic investments in research and development by key players, coupled with expanding market reach in emerging economies, will further fortify the market's upward trajectory, ensuring the industry remains a vital and evolving segment within the global vision care sector.
Contact Lenses Market Segmentation
-
1. Product Type
- 1.1. Soft Contact Lenses
- 1.2. Hybrid Contact Lenses
- 1.3. Rigid Gas Permeable Contact Lenses
- 1.4. Other Product Types
-
2. Usage
- 2.1. Corrective Contact Lenses
- 2.2. Therapeutic Contact Lenses
- 2.3. Cosmetic Contact Lenses
- 2.4. Prosthetic Contact Lenses
-
3. Modality
- 3.1. Conventional
- 3.2. Disposable
-
4. Design
- 4.1. Spherical
- 4.2. Toric
- 4.3. Multifocal
- 4.4. Other Designs
Contact Lenses Market Segmentation By Geography
-
1. North America
- 1.1. United States
- 1.2. Canada
- 1.3. Mexico
-
2. Europe
- 2.1. United Kingdom
- 2.2. Germany
- 2.3. France
- 2.4. Italy
- 2.5. Spain
- 2.6. Rest of Europe
-
3. Asia Pacific
- 3.1. China
- 3.2. Japan
- 3.3. India
- 3.4. Australia
- 3.5. South Korea
- 3.6. Rest of Asia Pacific
-
4. Middle East and Africa
- 4.1. GCC
- 4.2. South Africa
- 4.3. Rest of Middle East and Africa
-
5. South America
- 5.1. Brazil
- 5.2. Argentina
- 5.3. Rest of South America
Contact Lenses Market REPORT HIGHLIGHTS
| Aspects | Details |
|---|---|
| Study Period | 2019-2033 |
| Base Year | 2024 |
| Estimated Year | 2025 |
| Forecast Period | 2025-2033 |
| Historical Period | 2019-2024 |
| Growth Rate | CAGR of 3.66% from 2019-2033 |
| Segmentation |
|
Table of Contents
- 1. Introduction
- 1.1. Research Scope
- 1.2. Market Segmentation
- 1.3. Research Methodology
- 1.4. Definitions and Assumptions
- 2. Executive Summary
- 2.1. Introduction
- 3. Market Dynamics
- 3.1. Introduction
- 3.2. Market Drivers
- 3.2.1. Increasing Burden of Optical Disorders; Increasing Tendency to Enhance Aesthetics
- 3.3. Market Restrains
- 3.3.1. Availability of Alternative Techniques and Complications Associated with Lenses4.3.2
- 3.4. Market Trends
- 3.4.1. Corrective Contact Lenses are Expected to Register a Significant Growth Rate over the Forecast Period
- 4. Market Factor Analysis
- 4.1. Porters Five Forces
- 4.2. Supply/Value Chain
- 4.3. PESTEL analysis
- 4.4. Market Entropy
- 4.5. Patent/Trademark Analysis
- 5. Global Contact Lenses Market Analysis, Insights and Forecast, 2019-2031
- 5.1. Market Analysis, Insights and Forecast - by Product Type
- 5.1.1. Soft Contact Lenses
- 5.1.2. Hybrid Contact Lenses
- 5.1.3. Rigid Gas Permeable Contact Lenses
- 5.1.4. Other Product Types
- 5.2. Market Analysis, Insights and Forecast - by Usage
- 5.2.1. Corrective Contact Lenses
- 5.2.2. Therapeutic Contact Lenses
- 5.2.3. Cosmetic Contact Lenses
- 5.2.4. Prosthetic Contact Lenses
- 5.3. Market Analysis, Insights and Forecast - by Modality
- 5.3.1. Conventional
- 5.3.2. Disposable
- 5.4. Market Analysis, Insights and Forecast - by Design
- 5.4.1. Spherical
- 5.4.2. Toric
- 5.4.3. Multifocal
- 5.4.4. Other Designs
- 5.5. Market Analysis, Insights and Forecast - by Region
- 5.5.1. North America
- 5.5.2. Europe
- 5.5.3. Asia Pacific
- 5.5.4. Middle East and Africa
- 5.5.5. South America
- 5.1. Market Analysis, Insights and Forecast - by Product Type
- 6. North America Contact Lenses Market Analysis, Insights and Forecast, 2019-2031
- 6.1. Market Analysis, Insights and Forecast - by Product Type
- 6.1.1. Soft Contact Lenses
- 6.1.2. Hybrid Contact Lenses
- 6.1.3. Rigid Gas Permeable Contact Lenses
- 6.1.4. Other Product Types
- 6.2. Market Analysis, Insights and Forecast - by Usage
- 6.2.1. Corrective Contact Lenses
- 6.2.2. Therapeutic Contact Lenses
- 6.2.3. Cosmetic Contact Lenses
- 6.2.4. Prosthetic Contact Lenses
- 6.3. Market Analysis, Insights and Forecast - by Modality
- 6.3.1. Conventional
- 6.3.2. Disposable
- 6.4. Market Analysis, Insights and Forecast - by Design
- 6.4.1. Spherical
- 6.4.2. Toric
- 6.4.3. Multifocal
- 6.4.4. Other Designs
- 6.1. Market Analysis, Insights and Forecast - by Product Type
- 7. Europe Contact Lenses Market Analysis, Insights and Forecast, 2019-2031
- 7.1. Market Analysis, Insights and Forecast - by Product Type
- 7.1.1. Soft Contact Lenses
- 7.1.2. Hybrid Contact Lenses
- 7.1.3. Rigid Gas Permeable Contact Lenses
- 7.1.4. Other Product Types
- 7.2. Market Analysis, Insights and Forecast - by Usage
- 7.2.1. Corrective Contact Lenses
- 7.2.2. Therapeutic Contact Lenses
- 7.2.3. Cosmetic Contact Lenses
- 7.2.4. Prosthetic Contact Lenses
- 7.3. Market Analysis, Insights and Forecast - by Modality
- 7.3.1. Conventional
- 7.3.2. Disposable
- 7.4. Market Analysis, Insights and Forecast - by Design
- 7.4.1. Spherical
- 7.4.2. Toric
- 7.4.3. Multifocal
- 7.4.4. Other Designs
- 7.1. Market Analysis, Insights and Forecast - by Product Type
- 8. Asia Pacific Contact Lenses Market Analysis, Insights and Forecast, 2019-2031
- 8.1. Market Analysis, Insights and Forecast - by Product Type
- 8.1.1. Soft Contact Lenses
- 8.1.2. Hybrid Contact Lenses
- 8.1.3. Rigid Gas Permeable Contact Lenses
- 8.1.4. Other Product Types
- 8.2. Market Analysis, Insights and Forecast - by Usage
- 8.2.1. Corrective Contact Lenses
- 8.2.2. Therapeutic Contact Lenses
- 8.2.3. Cosmetic Contact Lenses
- 8.2.4. Prosthetic Contact Lenses
- 8.3. Market Analysis, Insights and Forecast - by Modality
- 8.3.1. Conventional
- 8.3.2. Disposable
- 8.4. Market Analysis, Insights and Forecast - by Design
- 8.4.1. Spherical
- 8.4.2. Toric
- 8.4.3. Multifocal
- 8.4.4. Other Designs
- 8.1. Market Analysis, Insights and Forecast - by Product Type
- 9. Middle East and Africa Contact Lenses Market Analysis, Insights and Forecast, 2019-2031
- 9.1. Market Analysis, Insights and Forecast - by Product Type
- 9.1.1. Soft Contact Lenses
- 9.1.2. Hybrid Contact Lenses
- 9.1.3. Rigid Gas Permeable Contact Lenses
- 9.1.4. Other Product Types
- 9.2. Market Analysis, Insights and Forecast - by Usage
- 9.2.1. Corrective Contact Lenses
- 9.2.2. Therapeutic Contact Lenses
- 9.2.3. Cosmetic Contact Lenses
- 9.2.4. Prosthetic Contact Lenses
- 9.3. Market Analysis, Insights and Forecast - by Modality
- 9.3.1. Conventional
- 9.3.2. Disposable
- 9.4. Market Analysis, Insights and Forecast - by Design
- 9.4.1. Spherical
- 9.4.2. Toric
- 9.4.3. Multifocal
- 9.4.4. Other Designs
- 9.1. Market Analysis, Insights and Forecast - by Product Type
- 10. South America Contact Lenses Market Analysis, Insights and Forecast, 2019-2031
- 10.1. Market Analysis, Insights and Forecast - by Product Type
- 10.1.1. Soft Contact Lenses
- 10.1.2. Hybrid Contact Lenses
- 10.1.3. Rigid Gas Permeable Contact Lenses
- 10.1.4. Other Product Types
- 10.2. Market Analysis, Insights and Forecast - by Usage
- 10.2.1. Corrective Contact Lenses
- 10.2.2. Therapeutic Contact Lenses
- 10.2.3. Cosmetic Contact Lenses
- 10.2.4. Prosthetic Contact Lenses
- 10.3. Market Analysis, Insights and Forecast - by Modality
- 10.3.1. Conventional
- 10.3.2. Disposable
- 10.4. Market Analysis, Insights and Forecast - by Design
- 10.4.1. Spherical
- 10.4.2. Toric
- 10.4.3. Multifocal
- 10.4.4. Other Designs
- 10.1. Market Analysis, Insights and Forecast - by Product Type
- 11. North America Contact Lenses Market Analysis, Insights and Forecast, 2019-2031
- 11.1. Market Analysis, Insights and Forecast - By Country/Sub-region
- 11.1.1 United States
- 11.1.2 Canada
- 11.1.3 Mexico
- 12. Europe Contact Lenses Market Analysis, Insights and Forecast, 2019-2031
- 12.1. Market Analysis, Insights and Forecast - By Country/Sub-region
- 12.1.1 United Kingdom
- 12.1.2 Germany
- 12.1.3 France
- 12.1.4 Italy
- 12.1.5 Spain
- 12.1.6 Rest of Europe
- 13. Asia Pacific Contact Lenses Market Analysis, Insights and Forecast, 2019-2031
- 13.1. Market Analysis, Insights and Forecast - By Country/Sub-region
- 13.1.1 China
- 13.1.2 Japan
- 13.1.3 India
- 13.1.4 Australia
- 13.1.5 South Korea
- 13.1.6 Rest of Asia Pacific
- 14. Middle East and Africa Contact Lenses Market Analysis, Insights and Forecast, 2019-2031
- 14.1. Market Analysis, Insights and Forecast - By Country/Sub-region
- 14.1.1 GCC
- 14.1.2 South Africa
- 14.1.3 Rest of Middle East and Africa
- 15. South America Contact Lenses Market Analysis, Insights and Forecast, 2019-2031
- 15.1. Market Analysis, Insights and Forecast - By Country/Sub-region
- 15.1.1 Brazil
- 15.1.2 Argentina
- 15.1.3 Rest of South America
- 16. Competitive Analysis
- 16.1. Global Market Share Analysis 2024
- 16.2. Company Profiles
- 16.2.1 Eyemera INC
- 16.2.1.1. Overview
- 16.2.1.2. Products
- 16.2.1.3. SWOT Analysis
- 16.2.1.4. Recent Developments
- 16.2.1.5. Financials (Based on Availability)
- 16.2.2 Essilor International SA
- 16.2.2.1. Overview
- 16.2.2.2. Products
- 16.2.2.3. SWOT Analysis
- 16.2.2.4. Recent Developments
- 16.2.2.5. Financials (Based on Availability)
- 16.2.3 The Cooper Companies
- 16.2.3.1. Overview
- 16.2.3.2. Products
- 16.2.3.3. SWOT Analysis
- 16.2.3.4. Recent Developments
- 16.2.3.5. Financials (Based on Availability)
- 16.2.4 Alcon Vision LLC
- 16.2.4.1. Overview
- 16.2.4.2. Products
- 16.2.4.3. SWOT Analysis
- 16.2.4.4. Recent Developments
- 16.2.4.5. Financials (Based on Availability)
- 16.2.5 SynergEyes Inc
- 16.2.5.1. Overview
- 16.2.5.2. Products
- 16.2.5.3. SWOT Analysis
- 16.2.5.4. Recent Developments
- 16.2.5.5. Financials (Based on Availability)
- 16.2.6 Menicon Co Ltd
- 16.2.6.1. Overview
- 16.2.6.2. Products
- 16.2.6.3. SWOT Analysis
- 16.2.6.4. Recent Developments
- 16.2.6.5. Financials (Based on Availability)
- 16.2.7 Zeiss Group
- 16.2.7.1. Overview
- 16.2.7.2. Products
- 16.2.7.3. SWOT Analysis
- 16.2.7.4. Recent Developments
- 16.2.7.5. Financials (Based on Availability)
- 16.2.8 Johnson & Johnson Vision Care Inc
- 16.2.8.1. Overview
- 16.2.8.2. Products
- 16.2.8.3. SWOT Analysis
- 16.2.8.4. Recent Developments
- 16.2.8.5. Financials (Based on Availability)
- 16.2.9 Seed Co Ltd
- 16.2.9.1. Overview
- 16.2.9.2. Products
- 16.2.9.3. SWOT Analysis
- 16.2.9.4. Recent Developments
- 16.2.9.5. Financials (Based on Availability)
- 16.2.10 Bausch Health Companies Inc
- 16.2.10.1. Overview
- 16.2.10.2. Products
- 16.2.10.3. SWOT Analysis
- 16.2.10.4. Recent Developments
- 16.2.10.5. Financials (Based on Availability)
- 16.2.11 Hoya Corporation
- 16.2.11.1. Overview
- 16.2.11.2. Products
- 16.2.11.3. SWOT Analysis
- 16.2.11.4. Recent Developments
- 16.2.11.5. Financials (Based on Availability)
- 16.2.1 Eyemera INC
List of Figures
- Figure 1: Global Contact Lenses Market Revenue Breakdown (Million, %) by Region 2024 & 2032
- Figure 2: Global Contact Lenses Market Volume Breakdown (K Unit, %) by Region 2024 & 2032
- Figure 3: North America Contact Lenses Market Revenue (Million), by Country 2024 & 2032
- Figure 4: North America Contact Lenses Market Volume (K Unit), by Country 2024 & 2032
- Figure 5: North America Contact Lenses Market Revenue Share (%), by Country 2024 & 2032
- Figure 6: North America Contact Lenses Market Volume Share (%), by Country 2024 & 2032
- Figure 7: Europe Contact Lenses Market Revenue (Million), by Country 2024 & 2032
- Figure 8: Europe Contact Lenses Market Volume (K Unit), by Country 2024 & 2032
- Figure 9: Europe Contact Lenses Market Revenue Share (%), by Country 2024 & 2032
- Figure 10: Europe Contact Lenses Market Volume Share (%), by Country 2024 & 2032
- Figure 11: Asia Pacific Contact Lenses Market Revenue (Million), by Country 2024 & 2032
- Figure 12: Asia Pacific Contact Lenses Market Volume (K Unit), by Country 2024 & 2032
- Figure 13: Asia Pacific Contact Lenses Market Revenue Share (%), by Country 2024 & 2032
- Figure 14: Asia Pacific Contact Lenses Market Volume Share (%), by Country 2024 & 2032
- Figure 15: Middle East and Africa Contact Lenses Market Revenue (Million), by Country 2024 & 2032
- Figure 16: Middle East and Africa Contact Lenses Market Volume (K Unit), by Country 2024 & 2032
- Figure 17: Middle East and Africa Contact Lenses Market Revenue Share (%), by Country 2024 & 2032
- Figure 18: Middle East and Africa Contact Lenses Market Volume Share (%), by Country 2024 & 2032
- Figure 19: South America Contact Lenses Market Revenue (Million), by Country 2024 & 2032
- Figure 20: South America Contact Lenses Market Volume (K Unit), by Country 2024 & 2032
- Figure 21: South America Contact Lenses Market Revenue Share (%), by Country 2024 & 2032
- Figure 22: South America Contact Lenses Market Volume Share (%), by Country 2024 & 2032
- Figure 23: North America Contact Lenses Market Revenue (Million), by Product Type 2024 & 2032
- Figure 24: North America Contact Lenses Market Volume (K Unit), by Product Type 2024 & 2032
- Figure 25: North America Contact Lenses Market Revenue Share (%), by Product Type 2024 & 2032
- Figure 26: North America Contact Lenses Market Volume Share (%), by Product Type 2024 & 2032
- Figure 27: North America Contact Lenses Market Revenue (Million), by Usage 2024 & 2032
- Figure 28: North America Contact Lenses Market Volume (K Unit), by Usage 2024 & 2032
- Figure 29: North America Contact Lenses Market Revenue Share (%), by Usage 2024 & 2032
- Figure 30: North America Contact Lenses Market Volume Share (%), by Usage 2024 & 2032
- Figure 31: North America Contact Lenses Market Revenue (Million), by Modality 2024 & 2032
- Figure 32: North America Contact Lenses Market Volume (K Unit), by Modality 2024 & 2032
- Figure 33: North America Contact Lenses Market Revenue Share (%), by Modality 2024 & 2032
- Figure 34: North America Contact Lenses Market Volume Share (%), by Modality 2024 & 2032
- Figure 35: North America Contact Lenses Market Revenue (Million), by Design 2024 & 2032
- Figure 36: North America Contact Lenses Market Volume (K Unit), by Design 2024 & 2032
- Figure 37: North America Contact Lenses Market Revenue Share (%), by Design 2024 & 2032
- Figure 38: North America Contact Lenses Market Volume Share (%), by Design 2024 & 2032
- Figure 39: North America Contact Lenses Market Revenue (Million), by Country 2024 & 2032
- Figure 40: North America Contact Lenses Market Volume (K Unit), by Country 2024 & 2032
- Figure 41: North America Contact Lenses Market Revenue Share (%), by Country 2024 & 2032
- Figure 42: North America Contact Lenses Market Volume Share (%), by Country 2024 & 2032
- Figure 43: Europe Contact Lenses Market Revenue (Million), by Product Type 2024 & 2032
- Figure 44: Europe Contact Lenses Market Volume (K Unit), by Product Type 2024 & 2032
- Figure 45: Europe Contact Lenses Market Revenue Share (%), by Product Type 2024 & 2032
- Figure 46: Europe Contact Lenses Market Volume Share (%), by Product Type 2024 & 2032
- Figure 47: Europe Contact Lenses Market Revenue (Million), by Usage 2024 & 2032
- Figure 48: Europe Contact Lenses Market Volume (K Unit), by Usage 2024 & 2032
- Figure 49: Europe Contact Lenses Market Revenue Share (%), by Usage 2024 & 2032
- Figure 50: Europe Contact Lenses Market Volume Share (%), by Usage 2024 & 2032
- Figure 51: Europe Contact Lenses Market Revenue (Million), by Modality 2024 & 2032
- Figure 52: Europe Contact Lenses Market Volume (K Unit), by Modality 2024 & 2032
- Figure 53: Europe Contact Lenses Market Revenue Share (%), by Modality 2024 & 2032
- Figure 54: Europe Contact Lenses Market Volume Share (%), by Modality 2024 & 2032
- Figure 55: Europe Contact Lenses Market Revenue (Million), by Design 2024 & 2032
- Figure 56: Europe Contact Lenses Market Volume (K Unit), by Design 2024 & 2032
- Figure 57: Europe Contact Lenses Market Revenue Share (%), by Design 2024 & 2032
- Figure 58: Europe Contact Lenses Market Volume Share (%), by Design 2024 & 2032
- Figure 59: Europe Contact Lenses Market Revenue (Million), by Country 2024 & 2032
- Figure 60: Europe Contact Lenses Market Volume (K Unit), by Country 2024 & 2032
- Figure 61: Europe Contact Lenses Market Revenue Share (%), by Country 2024 & 2032
- Figure 62: Europe Contact Lenses Market Volume Share (%), by Country 2024 & 2032
- Figure 63: Asia Pacific Contact Lenses Market Revenue (Million), by Product Type 2024 & 2032
- Figure 64: Asia Pacific Contact Lenses Market Volume (K Unit), by Product Type 2024 & 2032
- Figure 65: Asia Pacific Contact Lenses Market Revenue Share (%), by Product Type 2024 & 2032
- Figure 66: Asia Pacific Contact Lenses Market Volume Share (%), by Product Type 2024 & 2032
- Figure 67: Asia Pacific Contact Lenses Market Revenue (Million), by Usage 2024 & 2032
- Figure 68: Asia Pacific Contact Lenses Market Volume (K Unit), by Usage 2024 & 2032
- Figure 69: Asia Pacific Contact Lenses Market Revenue Share (%), by Usage 2024 & 2032
- Figure 70: Asia Pacific Contact Lenses Market Volume Share (%), by Usage 2024 & 2032
- Figure 71: Asia Pacific Contact Lenses Market Revenue (Million), by Modality 2024 & 2032
- Figure 72: Asia Pacific Contact Lenses Market Volume (K Unit), by Modality 2024 & 2032
- Figure 73: Asia Pacific Contact Lenses Market Revenue Share (%), by Modality 2024 & 2032
- Figure 74: Asia Pacific Contact Lenses Market Volume Share (%), by Modality 2024 & 2032
- Figure 75: Asia Pacific Contact Lenses Market Revenue (Million), by Design 2024 & 2032
- Figure 76: Asia Pacific Contact Lenses Market Volume (K Unit), by Design 2024 & 2032
- Figure 77: Asia Pacific Contact Lenses Market Revenue Share (%), by Design 2024 & 2032
- Figure 78: Asia Pacific Contact Lenses Market Volume Share (%), by Design 2024 & 2032
- Figure 79: Asia Pacific Contact Lenses Market Revenue (Million), by Country 2024 & 2032
- Figure 80: Asia Pacific Contact Lenses Market Volume (K Unit), by Country 2024 & 2032
- Figure 81: Asia Pacific Contact Lenses Market Revenue Share (%), by Country 2024 & 2032
- Figure 82: Asia Pacific Contact Lenses Market Volume Share (%), by Country 2024 & 2032
- Figure 83: Middle East and Africa Contact Lenses Market Revenue (Million), by Product Type 2024 & 2032
- Figure 84: Middle East and Africa Contact Lenses Market Volume (K Unit), by Product Type 2024 & 2032
- Figure 85: Middle East and Africa Contact Lenses Market Revenue Share (%), by Product Type 2024 & 2032
- Figure 86: Middle East and Africa Contact Lenses Market Volume Share (%), by Product Type 2024 & 2032
- Figure 87: Middle East and Africa Contact Lenses Market Revenue (Million), by Usage 2024 & 2032
- Figure 88: Middle East and Africa Contact Lenses Market Volume (K Unit), by Usage 2024 & 2032
- Figure 89: Middle East and Africa Contact Lenses Market Revenue Share (%), by Usage 2024 & 2032
- Figure 90: Middle East and Africa Contact Lenses Market Volume Share (%), by Usage 2024 & 2032
- Figure 91: Middle East and Africa Contact Lenses Market Revenue (Million), by Modality 2024 & 2032
- Figure 92: Middle East and Africa Contact Lenses Market Volume (K Unit), by Modality 2024 & 2032
- Figure 93: Middle East and Africa Contact Lenses Market Revenue Share (%), by Modality 2024 & 2032
- Figure 94: Middle East and Africa Contact Lenses Market Volume Share (%), by Modality 2024 & 2032
- Figure 95: Middle East and Africa Contact Lenses Market Revenue (Million), by Design 2024 & 2032
- Figure 96: Middle East and Africa Contact Lenses Market Volume (K Unit), by Design 2024 & 2032
- Figure 97: Middle East and Africa Contact Lenses Market Revenue Share (%), by Design 2024 & 2032
- Figure 98: Middle East and Africa Contact Lenses Market Volume Share (%), by Design 2024 & 2032
- Figure 99: Middle East and Africa Contact Lenses Market Revenue (Million), by Country 2024 & 2032
- Figure 100: Middle East and Africa Contact Lenses Market Volume (K Unit), by Country 2024 & 2032
- Figure 101: Middle East and Africa Contact Lenses Market Revenue Share (%), by Country 2024 & 2032
- Figure 102: Middle East and Africa Contact Lenses Market Volume Share (%), by Country 2024 & 2032
- Figure 103: South America Contact Lenses Market Revenue (Million), by Product Type 2024 & 2032
- Figure 104: South America Contact Lenses Market Volume (K Unit), by Product Type 2024 & 2032
- Figure 105: South America Contact Lenses Market Revenue Share (%), by Product Type 2024 & 2032
- Figure 106: South America Contact Lenses Market Volume Share (%), by Product Type 2024 & 2032
- Figure 107: South America Contact Lenses Market Revenue (Million), by Usage 2024 & 2032
- Figure 108: South America Contact Lenses Market Volume (K Unit), by Usage 2024 & 2032
- Figure 109: South America Contact Lenses Market Revenue Share (%), by Usage 2024 & 2032
- Figure 110: South America Contact Lenses Market Volume Share (%), by Usage 2024 & 2032
- Figure 111: South America Contact Lenses Market Revenue (Million), by Modality 2024 & 2032
- Figure 112: South America Contact Lenses Market Volume (K Unit), by Modality 2024 & 2032
- Figure 113: South America Contact Lenses Market Revenue Share (%), by Modality 2024 & 2032
- Figure 114: South America Contact Lenses Market Volume Share (%), by Modality 2024 & 2032
- Figure 115: South America Contact Lenses Market Revenue (Million), by Design 2024 & 2032
- Figure 116: South America Contact Lenses Market Volume (K Unit), by Design 2024 & 2032
- Figure 117: South America Contact Lenses Market Revenue Share (%), by Design 2024 & 2032
- Figure 118: South America Contact Lenses Market Volume Share (%), by Design 2024 & 2032
- Figure 119: South America Contact Lenses Market Revenue (Million), by Country 2024 & 2032
- Figure 120: South America Contact Lenses Market Volume (K Unit), by Country 2024 & 2032
- Figure 121: South America Contact Lenses Market Revenue Share (%), by Country 2024 & 2032
- Figure 122: South America Contact Lenses Market Volume Share (%), by Country 2024 & 2032
List of Tables
- Table 1: Global Contact Lenses Market Revenue Million Forecast, by Region 2019 & 2032
- Table 2: Global Contact Lenses Market Volume K Unit Forecast, by Region 2019 & 2032
- Table 3: Global Contact Lenses Market Revenue Million Forecast, by Product Type 2019 & 2032
- Table 4: Global Contact Lenses Market Volume K Unit Forecast, by Product Type 2019 & 2032
- Table 5: Global Contact Lenses Market Revenue Million Forecast, by Usage 2019 & 2032
- Table 6: Global Contact Lenses Market Volume K Unit Forecast, by Usage 2019 & 2032
- Table 7: Global Contact Lenses Market Revenue Million Forecast, by Modality 2019 & 2032
- Table 8: Global Contact Lenses Market Volume K Unit Forecast, by Modality 2019 & 2032
- Table 9: Global Contact Lenses Market Revenue Million Forecast, by Design 2019 & 2032
- Table 10: Global Contact Lenses Market Volume K Unit Forecast, by Design 2019 & 2032
- Table 11: Global Contact Lenses Market Revenue Million Forecast, by Region 2019 & 2032
- Table 12: Global Contact Lenses Market Volume K Unit Forecast, by Region 2019 & 2032
- Table 13: Global Contact Lenses Market Revenue Million Forecast, by Country 2019 & 2032
- Table 14: Global Contact Lenses Market Volume K Unit Forecast, by Country 2019 & 2032
- Table 15: United States Contact Lenses Market Revenue (Million) Forecast, by Application 2019 & 2032
- Table 16: United States Contact Lenses Market Volume (K Unit) Forecast, by Application 2019 & 2032
- Table 17: Canada Contact Lenses Market Revenue (Million) Forecast, by Application 2019 & 2032
- Table 18: Canada Contact Lenses Market Volume (K Unit) Forecast, by Application 2019 & 2032
- Table 19: Mexico Contact Lenses Market Revenue (Million) Forecast, by Application 2019 & 2032
- Table 20: Mexico Contact Lenses Market Volume (K Unit) Forecast, by Application 2019 & 2032
- Table 21: Global Contact Lenses Market Revenue Million Forecast, by Country 2019 & 2032
- Table 22: Global Contact Lenses Market Volume K Unit Forecast, by Country 2019 & 2032
- Table 23: United Kingdom Contact Lenses Market Revenue (Million) Forecast, by Application 2019 & 2032
- Table 24: United Kingdom Contact Lenses Market Volume (K Unit) Forecast, by Application 2019 & 2032
- Table 25: Germany Contact Lenses Market Revenue (Million) Forecast, by Application 2019 & 2032
- Table 26: Germany Contact Lenses Market Volume (K Unit) Forecast, by Application 2019 & 2032
- Table 27: France Contact Lenses Market Revenue (Million) Forecast, by Application 2019 & 2032
- Table 28: France Contact Lenses Market Volume (K Unit) Forecast, by Application 2019 & 2032
- Table 29: Italy Contact Lenses Market Revenue (Million) Forecast, by Application 2019 & 2032
- Table 30: Italy Contact Lenses Market Volume (K Unit) Forecast, by Application 2019 & 2032
- Table 31: Spain Contact Lenses Market Revenue (Million) Forecast, by Application 2019 & 2032
- Table 32: Spain Contact Lenses Market Volume (K Unit) Forecast, by Application 2019 & 2032
- Table 33: Rest of Europe Contact Lenses Market Revenue (Million) Forecast, by Application 2019 & 2032
- Table 34: Rest of Europe Contact Lenses Market Volume (K Unit) Forecast, by Application 2019 & 2032
- Table 35: Global Contact Lenses Market Revenue Million Forecast, by Country 2019 & 2032
- Table 36: Global Contact Lenses Market Volume K Unit Forecast, by Country 2019 & 2032
- Table 37: China Contact Lenses Market Revenue (Million) Forecast, by Application 2019 & 2032
- Table 38: China Contact Lenses Market Volume (K Unit) Forecast, by Application 2019 & 2032
- Table 39: Japan Contact Lenses Market Revenue (Million) Forecast, by Application 2019 & 2032
- Table 40: Japan Contact Lenses Market Volume (K Unit) Forecast, by Application 2019 & 2032
- Table 41: India Contact Lenses Market Revenue (Million) Forecast, by Application 2019 & 2032
- Table 42: India Contact Lenses Market Volume (K Unit) Forecast, by Application 2019 & 2032
- Table 43: Australia Contact Lenses Market Revenue (Million) Forecast, by Application 2019 & 2032
- Table 44: Australia Contact Lenses Market Volume (K Unit) Forecast, by Application 2019 & 2032
- Table 45: South Korea Contact Lenses Market Revenue (Million) Forecast, by Application 2019 & 2032
- Table 46: South Korea Contact Lenses Market Volume (K Unit) Forecast, by Application 2019 & 2032
- Table 47: Rest of Asia Pacific Contact Lenses Market Revenue (Million) Forecast, by Application 2019 & 2032
- Table 48: Rest of Asia Pacific Contact Lenses Market Volume (K Unit) Forecast, by Application 2019 & 2032
- Table 49: Global Contact Lenses Market Revenue Million Forecast, by Country 2019 & 2032
- Table 50: Global Contact Lenses Market Volume K Unit Forecast, by Country 2019 & 2032
- Table 51: GCC Contact Lenses Market Revenue (Million) Forecast, by Application 2019 & 2032
- Table 52: GCC Contact Lenses Market Volume (K Unit) Forecast, by Application 2019 & 2032
- Table 53: South Africa Contact Lenses Market Revenue (Million) Forecast, by Application 2019 & 2032
- Table 54: South Africa Contact Lenses Market Volume (K Unit) Forecast, by Application 2019 & 2032
- Table 55: Rest of Middle East and Africa Contact Lenses Market Revenue (Million) Forecast, by Application 2019 & 2032
- Table 56: Rest of Middle East and Africa Contact Lenses Market Volume (K Unit) Forecast, by Application 2019 & 2032
- Table 57: Global Contact Lenses Market Revenue Million Forecast, by Country 2019 & 2032
- Table 58: Global Contact Lenses Market Volume K Unit Forecast, by Country 2019 & 2032
- Table 59: Brazil Contact Lenses Market Revenue (Million) Forecast, by Application 2019 & 2032
- Table 60: Brazil Contact Lenses Market Volume (K Unit) Forecast, by Application 2019 & 2032
- Table 61: Argentina Contact Lenses Market Revenue (Million) Forecast, by Application 2019 & 2032
- Table 62: Argentina Contact Lenses Market Volume (K Unit) Forecast, by Application 2019 & 2032
- Table 63: Rest of South America Contact Lenses Market Revenue (Million) Forecast, by Application 2019 & 2032
- Table 64: Rest of South America Contact Lenses Market Volume (K Unit) Forecast, by Application 2019 & 2032
- Table 65: Global Contact Lenses Market Revenue Million Forecast, by Product Type 2019 & 2032
- Table 66: Global Contact Lenses Market Volume K Unit Forecast, by Product Type 2019 & 2032
- Table 67: Global Contact Lenses Market Revenue Million Forecast, by Usage 2019 & 2032
- Table 68: Global Contact Lenses Market Volume K Unit Forecast, by Usage 2019 & 2032
- Table 69: Global Contact Lenses Market Revenue Million Forecast, by Modality 2019 & 2032
- Table 70: Global Contact Lenses Market Volume K Unit Forecast, by Modality 2019 & 2032
- Table 71: Global Contact Lenses Market Revenue Million Forecast, by Design 2019 & 2032
- Table 72: Global Contact Lenses Market Volume K Unit Forecast, by Design 2019 & 2032
- Table 73: Global Contact Lenses Market Revenue Million Forecast, by Country 2019 & 2032
- Table 74: Global Contact Lenses Market Volume K Unit Forecast, by Country 2019 & 2032
- Table 75: United States Contact Lenses Market Revenue (Million) Forecast, by Application 2019 & 2032
- Table 76: United States Contact Lenses Market Volume (K Unit) Forecast, by Application 2019 & 2032
- Table 77: Canada Contact Lenses Market Revenue (Million) Forecast, by Application 2019 & 2032
- Table 78: Canada Contact Lenses Market Volume (K Unit) Forecast, by Application 2019 & 2032
- Table 79: Mexico Contact Lenses Market Revenue (Million) Forecast, by Application 2019 & 2032
- Table 80: Mexico Contact Lenses Market Volume (K Unit) Forecast, by Application 2019 & 2032
- Table 81: Global Contact Lenses Market Revenue Million Forecast, by Product Type 2019 & 2032
- Table 82: Global Contact Lenses Market Volume K Unit Forecast, by Product Type 2019 & 2032
- Table 83: Global Contact Lenses Market Revenue Million Forecast, by Usage 2019 & 2032
- Table 84: Global Contact Lenses Market Volume K Unit Forecast, by Usage 2019 & 2032
- Table 85: Global Contact Lenses Market Revenue Million Forecast, by Modality 2019 & 2032
- Table 86: Global Contact Lenses Market Volume K Unit Forecast, by Modality 2019 & 2032
- Table 87: Global Contact Lenses Market Revenue Million Forecast, by Design 2019 & 2032
- Table 88: Global Contact Lenses Market Volume K Unit Forecast, by Design 2019 & 2032
- Table 89: Global Contact Lenses Market Revenue Million Forecast, by Country 2019 & 2032
- Table 90: Global Contact Lenses Market Volume K Unit Forecast, by Country 2019 & 2032
- Table 91: United Kingdom Contact Lenses Market Revenue (Million) Forecast, by Application 2019 & 2032
- Table 92: United Kingdom Contact Lenses Market Volume (K Unit) Forecast, by Application 2019 & 2032
- Table 93: Germany Contact Lenses Market Revenue (Million) Forecast, by Application 2019 & 2032
- Table 94: Germany Contact Lenses Market Volume (K Unit) Forecast, by Application 2019 & 2032
- Table 95: France Contact Lenses Market Revenue (Million) Forecast, by Application 2019 & 2032
- Table 96: France Contact Lenses Market Volume (K Unit) Forecast, by Application 2019 & 2032
- Table 97: Italy Contact Lenses Market Revenue (Million) Forecast, by Application 2019 & 2032
- Table 98: Italy Contact Lenses Market Volume (K Unit) Forecast, by Application 2019 & 2032
- Table 99: Spain Contact Lenses Market Revenue (Million) Forecast, by Application 2019 & 2032
- Table 100: Spain Contact Lenses Market Volume (K Unit) Forecast, by Application 2019 & 2032
- Table 101: Rest of Europe Contact Lenses Market Revenue (Million) Forecast, by Application 2019 & 2032
- Table 102: Rest of Europe Contact Lenses Market Volume (K Unit) Forecast, by Application 2019 & 2032
- Table 103: Global Contact Lenses Market Revenue Million Forecast, by Product Type 2019 & 2032
- Table 104: Global Contact Lenses Market Volume K Unit Forecast, by Product Type 2019 & 2032
- Table 105: Global Contact Lenses Market Revenue Million Forecast, by Usage 2019 & 2032
- Table 106: Global Contact Lenses Market Volume K Unit Forecast, by Usage 2019 & 2032
- Table 107: Global Contact Lenses Market Revenue Million Forecast, by Modality 2019 & 2032
- Table 108: Global Contact Lenses Market Volume K Unit Forecast, by Modality 2019 & 2032
- Table 109: Global Contact Lenses Market Revenue Million Forecast, by Design 2019 & 2032
- Table 110: Global Contact Lenses Market Volume K Unit Forecast, by Design 2019 & 2032
- Table 111: Global Contact Lenses Market Revenue Million Forecast, by Country 2019 & 2032
- Table 112: Global Contact Lenses Market Volume K Unit Forecast, by Country 2019 & 2032
- Table 113: China Contact Lenses Market Revenue (Million) Forecast, by Application 2019 & 2032
- Table 114: China Contact Lenses Market Volume (K Unit) Forecast, by Application 2019 & 2032
- Table 115: Japan Contact Lenses Market Revenue (Million) Forecast, by Application 2019 & 2032
- Table 116: Japan Contact Lenses Market Volume (K Unit) Forecast, by Application 2019 & 2032
- Table 117: India Contact Lenses Market Revenue (Million) Forecast, by Application 2019 & 2032
- Table 118: India Contact Lenses Market Volume (K Unit) Forecast, by Application 2019 & 2032
- Table 119: Australia Contact Lenses Market Revenue (Million) Forecast, by Application 2019 & 2032
- Table 120: Australia Contact Lenses Market Volume (K Unit) Forecast, by Application 2019 & 2032
- Table 121: South Korea Contact Lenses Market Revenue (Million) Forecast, by Application 2019 & 2032
- Table 122: South Korea Contact Lenses Market Volume (K Unit) Forecast, by Application 2019 & 2032
- Table 123: Rest of Asia Pacific Contact Lenses Market Revenue (Million) Forecast, by Application 2019 & 2032
- Table 124: Rest of Asia Pacific Contact Lenses Market Volume (K Unit) Forecast, by Application 2019 & 2032
- Table 125: Global Contact Lenses Market Revenue Million Forecast, by Product Type 2019 & 2032
- Table 126: Global Contact Lenses Market Volume K Unit Forecast, by Product Type 2019 & 2032
- Table 127: Global Contact Lenses Market Revenue Million Forecast, by Usage 2019 & 2032
- Table 128: Global Contact Lenses Market Volume K Unit Forecast, by Usage 2019 & 2032
- Table 129: Global Contact Lenses Market Revenue Million Forecast, by Modality 2019 & 2032
- Table 130: Global Contact Lenses Market Volume K Unit Forecast, by Modality 2019 & 2032
- Table 131: Global Contact Lenses Market Revenue Million Forecast, by Design 2019 & 2032
- Table 132: Global Contact Lenses Market Volume K Unit Forecast, by Design 2019 & 2032
- Table 133: Global Contact Lenses Market Revenue Million Forecast, by Country 2019 & 2032
- Table 134: Global Contact Lenses Market Volume K Unit Forecast, by Country 2019 & 2032
- Table 135: GCC Contact Lenses Market Revenue (Million) Forecast, by Application 2019 & 2032
- Table 136: GCC Contact Lenses Market Volume (K Unit) Forecast, by Application 2019 & 2032
- Table 137: South Africa Contact Lenses Market Revenue (Million) Forecast, by Application 2019 & 2032
- Table 138: South Africa Contact Lenses Market Volume (K Unit) Forecast, by Application 2019 & 2032
- Table 139: Rest of Middle East and Africa Contact Lenses Market Revenue (Million) Forecast, by Application 2019 & 2032
- Table 140: Rest of Middle East and Africa Contact Lenses Market Volume (K Unit) Forecast, by Application 2019 & 2032
- Table 141: Global Contact Lenses Market Revenue Million Forecast, by Product Type 2019 & 2032
- Table 142: Global Contact Lenses Market Volume K Unit Forecast, by Product Type 2019 & 2032
- Table 143: Global Contact Lenses Market Revenue Million Forecast, by Usage 2019 & 2032
- Table 144: Global Contact Lenses Market Volume K Unit Forecast, by Usage 2019 & 2032
- Table 145: Global Contact Lenses Market Revenue Million Forecast, by Modality 2019 & 2032
- Table 146: Global Contact Lenses Market Volume K Unit Forecast, by Modality 2019 & 2032
- Table 147: Global Contact Lenses Market Revenue Million Forecast, by Design 2019 & 2032
- Table 148: Global Contact Lenses Market Volume K Unit Forecast, by Design 2019 & 2032
- Table 149: Global Contact Lenses Market Revenue Million Forecast, by Country 2019 & 2032
- Table 150: Global Contact Lenses Market Volume K Unit Forecast, by Country 2019 & 2032
- Table 151: Brazil Contact Lenses Market Revenue (Million) Forecast, by Application 2019 & 2032
- Table 152: Brazil Contact Lenses Market Volume (K Unit) Forecast, by Application 2019 & 2032
- Table 153: Argentina Contact Lenses Market Revenue (Million) Forecast, by Application 2019 & 2032
- Table 154: Argentina Contact Lenses Market Volume (K Unit) Forecast, by Application 2019 & 2032
- Table 155: Rest of South America Contact Lenses Market Revenue (Million) Forecast, by Application 2019 & 2032
- Table 156: Rest of South America Contact Lenses Market Volume (K Unit) Forecast, by Application 2019 & 2032
Frequently Asked Questions
1. What is the projected Compound Annual Growth Rate (CAGR) of the Contact Lenses Market?
The projected CAGR is approximately 3.66%.
2. Which companies are prominent players in the Contact Lenses Market?
Key companies in the market include Eyemera INC, Essilor International SA, The Cooper Companies, Alcon Vision LLC, SynergEyes Inc, Menicon Co Ltd, Zeiss Group, Johnson & Johnson Vision Care Inc, Seed Co Ltd, Bausch Health Companies Inc, Hoya Corporation.
3. What are the main segments of the Contact Lenses Market?
The market segments include Product Type, Usage, Modality, Design.
4. Can you provide details about the market size?
The market size is estimated to be USD 10.23 Million as of 2022.
5. What are some drivers contributing to market growth?
Increasing Burden of Optical Disorders; Increasing Tendency to Enhance Aesthetics.
6. What are the notable trends driving market growth?
Corrective Contact Lenses are Expected to Register a Significant Growth Rate over the Forecast Period.
7. Are there any restraints impacting market growth?
Availability of Alternative Techniques and Complications Associated with Lenses4.3.2.
8. Can you provide examples of recent developments in the market?
June 2022: Johnson & Johnson Vision, a part of Johnson & Johnson MedTech, received FDA clearance for its latest contact lens innovation, ACUVUE OASYS MAX 1-Day and ACUVUE OASYS MAX 1-Day MULTIFOCAL.
9. What pricing options are available for accessing the report?
Pricing options include single-user, multi-user, and enterprise licenses priced at USD 4750, USD 5250, and USD 8750 respectively.
10. Is the market size provided in terms of value or volume?
The market size is provided in terms of value, measured in Million and volume, measured in K Unit.
11. Are there any specific market keywords associated with the report?
Yes, the market keyword associated with the report is "Contact Lenses Market," which aids in identifying and referencing the specific market segment covered.
12. How do I determine which pricing option suits my needs best?
The pricing options vary based on user requirements and access needs. Individual users may opt for single-user licenses, while businesses requiring broader access may choose multi-user or enterprise licenses for cost-effective access to the report.
13. Are there any additional resources or data provided in the Contact Lenses Market report?
While the report offers comprehensive insights, it's advisable to review the specific contents or supplementary materials provided to ascertain if additional resources or data are available.
14. How can I stay updated on further developments or reports in the Contact Lenses Market?
To stay informed about further developments, trends, and reports in the Contact Lenses Market, consider subscribing to industry newsletters, following relevant companies and organizations, or regularly checking reputable industry news sources and publications.
Methodology
Step 1 - Identification of Relevant Samples Size from Population Database


Step 2 - Approaches for Defining Global Market Size (Value, Volume* & Price*)

Note*: In applicable scenarios
Step 3 - Data Sources
Primary Research
- Web Analytics
- Survey Reports
- Research Institute
- Latest Research Reports
- Opinion Leaders
Secondary Research
- Annual Reports
- White Paper
- Latest Press Release
- Industry Association
- Paid Database
- Investor Presentations

Step 4 - Data Triangulation
Involves using different sources of information in order to increase the validity of a study
These sources are likely to be stakeholders in a program - participants, other researchers, program staff, other community members, and so on.
Then we put all data in single framework & apply various statistical tools to find out the dynamic on the market.
During the analysis stage, feedback from the stakeholder groups would be compared to determine areas of agreement as well as areas of divergence


