

Key Insights
The Virtual Clinical Trials industry is experiencing robust expansion, projected to reach a significant market size by 2033. This growth is propelled by an impressive Compound Annual Growth Rate (CAGR) of 9.34%, signaling a dynamic shift in how medical research is conducted. The market, currently valued at USD 9.52 million in its base year of 2025, is anticipated to climb substantially throughout the forecast period of 2025-2033. Key drivers fueling this surge include the increasing adoption of digital health technologies, the growing demand for decentralized clinical trial solutions to enhance patient access and reduce logistical burdens, and the imperative to accelerate drug development timelines in response to unmet medical needs across critical therapeutic areas like cardiovascular disease and oncology. Furthermore, the industry is benefiting from advancements in remote monitoring devices, telehealth platforms, and sophisticated data analytics, all contributing to more efficient and patient-centric trial methodologies.
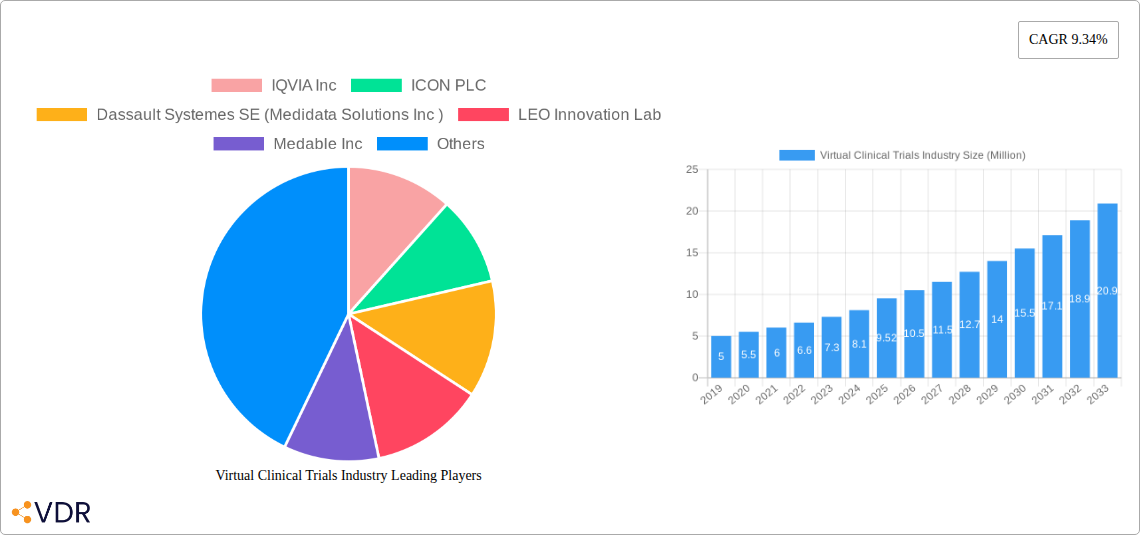
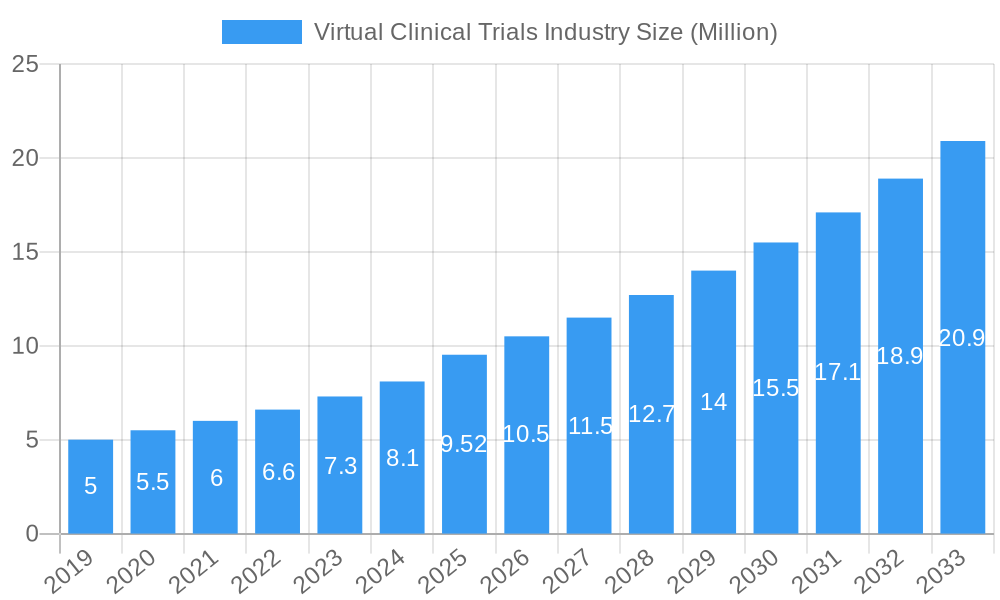
Virtual Clinical Trials Industry Market Size (In Million)
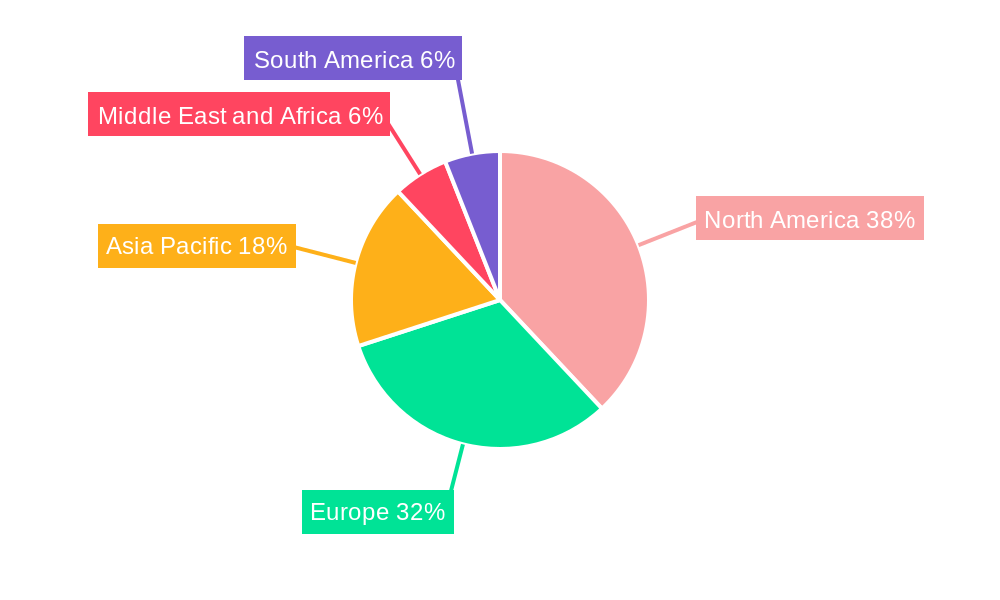
The virtual clinical trials landscape is characterized by a clear segmentation, with Observational and Interventional study designs leading the adoption of virtual elements. While Expanded Access programs are also integrating virtual components, the core of the transformation lies within the more traditional study frameworks. The market is segmented by indication type, with a strong focus on Cardiovascular Disease and Oncology, areas often requiring large patient cohorts and complex monitoring, making virtual solutions particularly attractive. Beyond these, "Other Indication Types" are also witnessing increased integration of virtual trial aspects. Geographically, North America, particularly the United States, is a dominant force, closely followed by Europe. The Asia Pacific region, with its rapidly growing healthcare infrastructure and increasing R&D investments, presents a significant growth opportunity. The competitive landscape is shaped by established players like IQVIA Inc., ICON PLC, and Parexel International Corporation, alongside innovative technology providers such as Medable Inc. and Signant Health, all vying to offer comprehensive virtual trial solutions and platforms to pharmaceutical and biotechnology companies.
Virtual Clinical Trials Industry Company Market Share
Virtual Clinical Trials Industry Market Dynamics & Structure
The global virtual clinical trials market is characterized by a moderate level of concentration, with key players like IQVIA Inc., ICON PLC, and Dassault Systemes SE (Medidata Solutions Inc.) holding significant shares. Technological innovation, particularly in areas like AI-driven patient recruitment, remote monitoring, and decentralized data collection, serves as a primary driver for market expansion. Robust regulatory frameworks, evolving to accommodate digital health solutions, are also shaping the industry's trajectory. However, challenges such as data privacy concerns, interoperability issues between different platforms, and the need for extensive clinician training present barriers to widespread adoption. End-user demographics are shifting towards a greater acceptance of technology in healthcare, fueled by patient convenience and the pursuit of more efficient trial processes. Mergers and acquisitions (M&A) activity is on the rise as established companies seek to expand their digital capabilities and smaller innovative firms aim for broader market reach. For instance, the market has witnessed numerous strategic partnerships and acquisitions aimed at integrating advanced analytics and digital tools, reflecting a dynamic competitive landscape.
- Market Concentration: Moderate, with dominance by a few large players and a growing number of specialized innovators.
- Technological Innovation Drivers: AI, machine learning, IoT devices for remote monitoring, blockchain for data security, and cloud-based platforms.
- Regulatory Frameworks: Evolving FDA and EMA guidelines supporting decentralized clinical trials (DCTs) and digital health technologies.
- Competitive Product Substitutes: Traditional on-site clinical trials, hybrid models, and emerging digital health platforms not specifically designed for trials.
- End-User Demographics: Increasing patient comfort with remote interactions and digital health tools, alongside a demand for more accessible and efficient trial participation.
- M&A Trends: Increasing acquisition of specialized tech companies by larger CROs and pharmaceutical firms to enhance their virtual trial offerings.
Virtual Clinical Trials Industry Growth Trends & Insights
The virtual clinical trials market is poised for substantial growth, driven by an escalating demand for more efficient, patient-centric, and cost-effective research methodologies. The market size is projected to expand significantly from its historical baseline, fueled by increasing adoption rates across various therapeutic areas. Technological disruptions, such as advancements in wearable sensors, telehealth platforms, and sophisticated data analytics, are fundamentally reshaping how clinical trials are conducted. These innovations are not only improving the quality and speed of data collection but also enhancing patient engagement and reducing geographical barriers to participation. The shift towards decentralized clinical trials (DCTs) and hybrid models, which leverage virtual components, is a key trend. This evolution is directly influenced by evolving consumer behavior, with patients increasingly preferring home-based participation for its convenience and reduced burden. The COVID-19 pandemic acted as a significant catalyst, accelerating the adoption of virtual trial methodologies and demonstrating their viability and effectiveness. This has led to sustained investment and innovation in digital health solutions for clinical research. The market is also benefiting from increased government and regulatory support, with bodies actively adapting guidelines to facilitate the integration of virtual elements. Consequently, the projected Compound Annual Growth Rate (CAGR) for the virtual clinical trials market is robust, indicating a strong upward trajectory in market penetration. This growth is further supported by the increasing complexity of diseases, particularly in areas like oncology and cardiovascular disease, which often require extensive patient monitoring and diverse data collection methods. The ability of virtual trials to accommodate these complexities more effectively is a major contributing factor to their rising prominence. Furthermore, the development of sophisticated platforms that ensure data integrity and patient safety in a remote setting is continuously improving, bolstering confidence and driving further market expansion. The global market is expected to witness a significant increase in its market share of overall clinical trials by the end of the forecast period. This sustained expansion is underpinned by a confluence of technological advancements, regulatory support, and a growing acceptance by both patients and sponsors of the benefits offered by virtual and decentralized trial approaches. The parent market, encompassing all clinical trials, provides a broad context for this rapid growth, with virtual components becoming an increasingly integral part of its future.
Dominant Regions, Countries, or Segments in Virtual Clinical Trials Industry
North America, particularly the United States, currently dominates the virtual clinical trials industry, driven by a confluence of factors including a well-established healthcare infrastructure, a robust pharmaceutical and biotechnology sector, and a proactive regulatory environment. The U.S. Food and Drug Administration (FDA) has been at the forefront of developing guidelines and providing support for decentralized and virtual clinical trials, which has significantly encouraged innovation and adoption. This supportive regulatory landscape, coupled with a high prevalence of chronic diseases and a strong patient willingness to embrace technology for healthcare, positions North America as a leading region. The economic policies in place foster significant investment in research and development, further bolstering the growth of virtual trial solutions.
Key Drivers of Dominance in North America:
- Proactive Regulatory Environment: FDA's acceptance and guidance for decentralized clinical trials (DCTs) and digital health technologies.
- Strong Pharmaceutical and Biotech Hub: Presence of major pharmaceutical companies and a vibrant biotech ecosystem actively conducting trials.
- Advanced Healthcare Infrastructure: Widespread adoption of electronic health records (EHRs) and a technologically adept patient population.
- High Incidence of Target Indications: Significant patient populations for diseases like Cardiovascular Disease and Oncology, major areas for virtual trial adoption.
- Investment in R&D: Substantial funding allocated to clinical research and development, driving the adoption of innovative trial methodologies.
Within the Study Design segment, Interventional virtual trials are experiencing the most significant growth. These trials, where interventions are tested, are increasingly leveraging virtual components to enhance patient recruitment and retention, especially for chronic conditions requiring long-term monitoring. The ability to collect real-world data remotely for interventional studies is proving invaluable.
Dominance within Study Design Segments:
- Interventional: Leading due to its application in testing new drugs and therapies, where remote monitoring and data capture are crucial for efficiency and patient adherence.
- Observational: Growing steadily as virtual methods facilitate long-term data collection on disease progression and patient outcomes without direct intervention.
- Expanded Access: Benefits from virtual components by enabling remote monitoring and communication for patients receiving investigational treatments outside of traditional trials.
In terms of Indication Type, Oncology represents a dominant segment for virtual clinical trials. The complexity of oncology trials, the need for frequent patient monitoring, and the often geographically dispersed patient populations make virtual solutions highly attractive. Patients undergoing cancer treatment can benefit greatly from reduced travel burdens and continuous remote symptom tracking.
Dominance within Indication Types:
- Oncology: High demand for remote monitoring, patient-reported outcomes, and streamlined data collection for complex treatment regimens.
- Cardiovascular Disease: Significant adoption due to the need for continuous physiological data monitoring (e.g., ECG, blood pressure) achievable through wearable devices.
- Other Indication Types: Growing adoption across neurology, rare diseases, and infectious diseases, all of which can benefit from increased patient access and remote data collection.
The market share within North America is substantial, with an estimated xx% of global clinical trial activities incorporating virtual elements. The growth potential for the child markets, particularly in the application of AI for patient stratification and remote monitoring of physiological data, remains immense.
Virtual Clinical Trials Industry Product Landscape
The product landscape in the virtual clinical trials industry is characterized by a rapidly evolving suite of digital solutions designed to facilitate remote patient engagement, data collection, and trial management. Key innovations include AI-powered platforms for patient identification and recruitment, wearable biosensors for continuous physiological data monitoring, telehealth solutions for virtual physician visits and patient assessments, and secure electronic data capture (EDC) systems. These products offer unique selling propositions such as enhanced data accuracy through real-time collection, improved patient adherence and satisfaction due to reduced travel, and accelerated trial timelines. Technological advancements are focused on creating seamless, interoperable ecosystems that provide a comprehensive virtual trial experience, from consent to data analysis.
Key Drivers, Barriers & Challenges in Virtual Clinical Trials Industry
Key Drivers:
- Technological Advancements: The proliferation of wearable devices, AI, and cloud computing enables robust remote data collection and analysis.
- Patient-Centricity: Growing demand for convenient, accessible trial participation, reducing the burden on patients.
- Cost and Time Efficiency: Virtual trials can potentially reduce operational costs and accelerate trial timelines.
- Regulatory Support: Evolving guidelines from regulatory bodies like the FDA and EMA are encouraging the adoption of virtual and decentralized approaches.
- Global Reach: Ability to recruit and monitor patients across wider geographical areas.
Key Barriers & Challenges:
- Data Privacy and Security: Ensuring the integrity and confidentiality of sensitive patient data collected remotely.
- Regulatory Harmonization: Differences in regulations across countries can pose challenges for global virtual trials.
- Digital Divide: Ensuring equitable access for patients with limited digital literacy or connectivity.
- Interoperability of Systems: Integrating various digital platforms and devices seamlessly.
- Clinician Adoption and Training: Overcoming resistance to new technologies and ensuring adequate training for healthcare professionals.
- On-site Needs: Certain trial aspects may still require in-person visits, necessitating hybrid models.
- Supply Chain Issues: Ensuring timely delivery and maintenance of remote monitoring devices to participants.
Emerging Opportunities in Virtual Clinical Trials Industry
Emerging opportunities lie in the development of advanced AI algorithms for predictive analytics in patient monitoring and early detection of adverse events in virtual settings. The integration of blockchain technology for enhanced data security and transparency is another significant avenue. Furthermore, the expansion of virtual trial methodologies into new therapeutic areas, such as rare diseases and neurological disorders, presents untapped markets. Evolving consumer preferences for personalized healthcare experiences will also drive demand for highly customized and patient-friendly virtual trial designs. The increasing focus on real-world evidence (RWE) collection through virtual means offers a substantial opportunity for post-market surveillance and understanding long-term treatment effects.
Growth Accelerators in the Virtual Clinical Trials Industry Industry
Long-term growth in the virtual clinical trials industry will be significantly accelerated by ongoing technological breakthroughs in artificial intelligence and machine learning for more precise patient stratification and predictive outcomes. Strategic partnerships between technology providers, pharmaceutical companies, and Contract Research Organizations (CROs) will foster innovation and streamline adoption. Market expansion strategies, including the development of user-friendly platforms adaptable to diverse patient populations and healthcare systems globally, will be crucial. The increasing emphasis on real-world data and evidence generation through remote monitoring and digital patient-reported outcomes will also be a major catalyst for sustained growth.
Key Players Shaping the Virtual Clinical Trials Industry Market
- IQVIA Inc.
- ICON PLC
- Dassault Systemes SE (Medidata Solutions Inc.)
- LEO Innovation Lab
- Medable Inc.
- Parexel International Corporation
- Oracle Corporation
- Signant Health
- Clinical Ink Inc.
- Medpace Holdings Inc.
- Laboratory Corporation of America Holdings (Covance Inc.)
Notable Milestones in Virtual Clinical Trials Industry Sector
- 2020: Increased adoption and regulatory acceptance of decentralized clinical trials (DCTs) due to the COVID-19 pandemic.
- 2021: Launch of advanced AI-powered patient recruitment platforms designed for remote screening.
- 2022: Significant investments in wearable sensor technology for continuous remote physiological monitoring.
- 2023: Expansion of telehealth platforms for remote patient visits and assessments within clinical trials.
- 2024: Growing integration of blockchain for enhanced data security and integrity in virtual trials.
In-Depth Virtual Clinical Trials Industry Market Outlook
The outlook for the virtual clinical trials industry is exceptionally positive, driven by the sustained integration of cutting-edge technologies and a clear market demand for more efficient and patient-centric research. Future growth will be fueled by advancements in AI for predictive patient outcomes and the expansion of real-world evidence (RWE) generation capabilities through remote monitoring. Strategic collaborations and the development of globally harmonized regulatory frameworks will further accelerate market penetration. The ongoing evolution of digital health infrastructure and increasing patient comfort with technology will solidify virtual clinical trials as a cornerstone of future pharmaceutical research and development.
Virtual Clinical Trials Industry Segmentation
-
1. Study Design
- 1.1. Observational
- 1.2. Intervensional
- 1.3. Expanded Access
-
2. Indication Type
- 2.1. Cardiovascular Disease
- 2.2. Oncology
- 2.3. Other Indication Types
Virtual Clinical Trials Industry Segmentation By Geography
-
1. North America
- 1.1. United States
- 1.2. Canada
- 1.3. Mexico
-
2. Europe
- 2.1. Germany
- 2.2. United Kingdom
- 2.3. France
- 2.4. Italy
- 2.5. Spain
- 2.6. Rest of Europe
-
3. Asia Pacific
- 3.1. China
- 3.2. Japan
- 3.3. India
- 3.4. Australia
- 3.5. South Korea
- 3.6. Rest of Asia Pacific
-
4. Middle East and Africa
- 4.1. GCC
- 4.2. South Africa
- 4.3. Rest of Middle East and Africa
-
5. South America
- 5.1. Brazil
- 5.2. Argentina
- 5.3. Rest of South America
Virtual Clinical Trials Industry Regional Market Share
Geographic Coverage of Virtual Clinical Trials Industry
Virtual Clinical Trials Industry REPORT HIGHLIGHTS
| Aspects | Details |
|---|---|
| Study Period | 2020-2034 |
| Base Year | 2025 |
| Estimated Year | 2026 |
| Forecast Period | 2026-2034 |
| Historical Period | 2020-2025 |
| Growth Rate | CAGR of 9.34% from 2020-2034 |
| Segmentation |
|
Table of Contents
- 1. Introduction
- 1.1. Research Scope
- 1.2. Market Segmentation
- 1.3. Research Objective
- 1.4. Definitions and Assumptions
- 2. Executive Summary
- 2.1. Market Snapshot
- 3. Market Dynamics
- 3.1. Market Drivers
- 3.2. Market Restrains
- 3.3. Market Trends
- 3.4. Market Opportunities
- 4. Market Factor Analysis
- 4.1. Porters Five Forces
- 4.1.1. Bargaining Power of Suppliers
- 4.1.2. Bargaining Power of Buyers
- 4.1.3. Threat of New Entrants
- 4.1.4. Threat of Substitutes
- 4.1.5. Competitive Rivalry
- 4.2. PESTEL analysis
- 4.3. BCG Analysis
- 4.3.1. Stars (High Growth, High Market Share)
- 4.3.2. Cash Cows (Low Growth, High Market Share)
- 4.3.3. Question Mark (High Growth, Low Market Share)
- 4.3.4. Dogs (Low Growth, Low Market Share)
- 4.4. Ansoff Matrix Analysis
- 4.5. Supply Chain Analysis
- 4.6. Regulatory Landscape
- 4.7. Current Market Potential and Opportunity Assessment (TAM–SAM–SOM Framework)
- 4.8. VDR Analyst Note
- 4.1. Porters Five Forces
- 5. Market Analysis, Insights and Forecast 2021-2033
- 5.1. Market Analysis, Insights and Forecast - by Study Design
- 5.1.1. Observational
- 5.1.2. Intervensional
- 5.1.3. Expanded Access
- 5.2. Market Analysis, Insights and Forecast - by Indication Type
- 5.2.1. Cardiovascular Disease
- 5.2.2. Oncology
- 5.2.3. Other Indication Types
- 5.3. Market Analysis, Insights and Forecast - by Region
- 5.3.1. North America
- 5.3.2. Europe
- 5.3.3. Asia Pacific
- 5.3.4. Middle East and Africa
- 5.3.5. South America
- 5.1. Market Analysis, Insights and Forecast - by Study Design
- 6. Global Virtual Clinical Trials Industry Analysis, Insights and Forecast, 2021-2033
- 6.1. Market Analysis, Insights and Forecast - by Study Design
- 6.1.1. Observational
- 6.1.2. Intervensional
- 6.1.3. Expanded Access
- 6.2. Market Analysis, Insights and Forecast - by Indication Type
- 6.2.1. Cardiovascular Disease
- 6.2.2. Oncology
- 6.2.3. Other Indication Types
- 6.1. Market Analysis, Insights and Forecast - by Study Design
- 7. North America Virtual Clinical Trials Industry Analysis, Insights and Forecast, 2021-2033
- 7.1. Market Analysis, Insights and Forecast - by Study Design
- 7.1.1. Observational
- 7.1.2. Intervensional
- 7.1.3. Expanded Access
- 7.2. Market Analysis, Insights and Forecast - by Indication Type
- 7.2.1. Cardiovascular Disease
- 7.2.2. Oncology
- 7.2.3. Other Indication Types
- 7.1. Market Analysis, Insights and Forecast - by Study Design
- 8. Europe Virtual Clinical Trials Industry Analysis, Insights and Forecast, 2021-2033
- 8.1. Market Analysis, Insights and Forecast - by Study Design
- 8.1.1. Observational
- 8.1.2. Intervensional
- 8.1.3. Expanded Access
- 8.2. Market Analysis, Insights and Forecast - by Indication Type
- 8.2.1. Cardiovascular Disease
- 8.2.2. Oncology
- 8.2.3. Other Indication Types
- 8.1. Market Analysis, Insights and Forecast - by Study Design
- 9. Asia Pacific Virtual Clinical Trials Industry Analysis, Insights and Forecast, 2021-2033
- 9.1. Market Analysis, Insights and Forecast - by Study Design
- 9.1.1. Observational
- 9.1.2. Intervensional
- 9.1.3. Expanded Access
- 9.2. Market Analysis, Insights and Forecast - by Indication Type
- 9.2.1. Cardiovascular Disease
- 9.2.2. Oncology
- 9.2.3. Other Indication Types
- 9.1. Market Analysis, Insights and Forecast - by Study Design
- 10. Middle East and Africa Virtual Clinical Trials Industry Analysis, Insights and Forecast, 2021-2033
- 10.1. Market Analysis, Insights and Forecast - by Study Design
- 10.1.1. Observational
- 10.1.2. Intervensional
- 10.1.3. Expanded Access
- 10.2. Market Analysis, Insights and Forecast - by Indication Type
- 10.2.1. Cardiovascular Disease
- 10.2.2. Oncology
- 10.2.3. Other Indication Types
- 10.1. Market Analysis, Insights and Forecast - by Study Design
- 11. South America Virtual Clinical Trials Industry Analysis, Insights and Forecast, 2021-2033
- 11.1. Market Analysis, Insights and Forecast - by Study Design
- 11.1.1. Observational
- 11.1.2. Intervensional
- 11.1.3. Expanded Access
- 11.2. Market Analysis, Insights and Forecast - by Indication Type
- 11.2.1. Cardiovascular Disease
- 11.2.2. Oncology
- 11.2.3. Other Indication Types
- 11.1. Market Analysis, Insights and Forecast - by Study Design
- 12. Competitive Analysis
- 12.1. Company Profiles
- 12.1.1 IQVIA Inc
- 12.1.1.1. Company Overview
- 12.1.1.2. Products
- 12.1.1.3. Company Financials
- 12.1.1.4. SWOT Analysis
- 12.1.2 ICON PLC
- 12.1.2.1. Company Overview
- 12.1.2.2. Products
- 12.1.2.3. Company Financials
- 12.1.2.4. SWOT Analysis
- 12.1.3 Dassault Systemes SE (Medidata Solutions Inc )
- 12.1.3.1. Company Overview
- 12.1.3.2. Products
- 12.1.3.3. Company Financials
- 12.1.3.4. SWOT Analysis
- 12.1.4 LEO Innovation Lab
- 12.1.4.1. Company Overview
- 12.1.4.2. Products
- 12.1.4.3. Company Financials
- 12.1.4.4. SWOT Analysis
- 12.1.5 Medable Inc
- 12.1.5.1. Company Overview
- 12.1.5.2. Products
- 12.1.5.3. Company Financials
- 12.1.5.4. SWOT Analysis
- 12.1.6 Parexel International Corporation
- 12.1.6.1. Company Overview
- 12.1.6.2. Products
- 12.1.6.3. Company Financials
- 12.1.6.4. SWOT Analysis
- 12.1.7 Oracle Corporation
- 12.1.7.1. Company Overview
- 12.1.7.2. Products
- 12.1.7.3. Company Financials
- 12.1.7.4. SWOT Analysis
- 12.1.8 Signant Health
- 12.1.8.1. Company Overview
- 12.1.8.2. Products
- 12.1.8.3. Company Financials
- 12.1.8.4. SWOT Analysis
- 12.1.9 Clinical Ink Inc
- 12.1.9.1. Company Overview
- 12.1.9.2. Products
- 12.1.9.3. Company Financials
- 12.1.9.4. SWOT Analysis
- 12.1.10 Medpace Holdings Inc
- 12.1.10.1. Company Overview
- 12.1.10.2. Products
- 12.1.10.3. Company Financials
- 12.1.10.4. SWOT Analysis
- 12.1.11 Laboratory Corporation of America Holdings (Covance Inc )
- 12.1.11.1. Company Overview
- 12.1.11.2. Products
- 12.1.11.3. Company Financials
- 12.1.11.4. SWOT Analysis
- 12.1.1 IQVIA Inc
- 12.2. Market Entropy
- 12.2.1 Company's Key Areas Served
- 12.2.2 Recent Developments
- 12.3. Company Market Share Analysis 2025
- 12.3.1 Top 5 Companies Market Share Analysis
- 12.3.2 Top 3 Companies Market Share Analysis
- 12.4. List of Potential Customers
- 13. Research Methodology
List of Figures
- Figure 1: Global Virtual Clinical Trials Industry Revenue Breakdown (Million, %) by Region 2025 & 2033
- Figure 2: North America Virtual Clinical Trials Industry Revenue (Million), by Study Design 2025 & 2033
- Figure 3: North America Virtual Clinical Trials Industry Revenue Share (%), by Study Design 2025 & 2033
- Figure 4: North America Virtual Clinical Trials Industry Revenue (Million), by Indication Type 2025 & 2033
- Figure 5: North America Virtual Clinical Trials Industry Revenue Share (%), by Indication Type 2025 & 2033
- Figure 6: North America Virtual Clinical Trials Industry Revenue (Million), by Country 2025 & 2033
- Figure 7: North America Virtual Clinical Trials Industry Revenue Share (%), by Country 2025 & 2033
- Figure 8: Europe Virtual Clinical Trials Industry Revenue (Million), by Study Design 2025 & 2033
- Figure 9: Europe Virtual Clinical Trials Industry Revenue Share (%), by Study Design 2025 & 2033
- Figure 10: Europe Virtual Clinical Trials Industry Revenue (Million), by Indication Type 2025 & 2033
- Figure 11: Europe Virtual Clinical Trials Industry Revenue Share (%), by Indication Type 2025 & 2033
- Figure 12: Europe Virtual Clinical Trials Industry Revenue (Million), by Country 2025 & 2033
- Figure 13: Europe Virtual Clinical Trials Industry Revenue Share (%), by Country 2025 & 2033
- Figure 14: Asia Pacific Virtual Clinical Trials Industry Revenue (Million), by Study Design 2025 & 2033
- Figure 15: Asia Pacific Virtual Clinical Trials Industry Revenue Share (%), by Study Design 2025 & 2033
- Figure 16: Asia Pacific Virtual Clinical Trials Industry Revenue (Million), by Indication Type 2025 & 2033
- Figure 17: Asia Pacific Virtual Clinical Trials Industry Revenue Share (%), by Indication Type 2025 & 2033
- Figure 18: Asia Pacific Virtual Clinical Trials Industry Revenue (Million), by Country 2025 & 2033
- Figure 19: Asia Pacific Virtual Clinical Trials Industry Revenue Share (%), by Country 2025 & 2033
- Figure 20: Middle East and Africa Virtual Clinical Trials Industry Revenue (Million), by Study Design 2025 & 2033
- Figure 21: Middle East and Africa Virtual Clinical Trials Industry Revenue Share (%), by Study Design 2025 & 2033
- Figure 22: Middle East and Africa Virtual Clinical Trials Industry Revenue (Million), by Indication Type 2025 & 2033
- Figure 23: Middle East and Africa Virtual Clinical Trials Industry Revenue Share (%), by Indication Type 2025 & 2033
- Figure 24: Middle East and Africa Virtual Clinical Trials Industry Revenue (Million), by Country 2025 & 2033
- Figure 25: Middle East and Africa Virtual Clinical Trials Industry Revenue Share (%), by Country 2025 & 2033
- Figure 26: South America Virtual Clinical Trials Industry Revenue (Million), by Study Design 2025 & 2033
- Figure 27: South America Virtual Clinical Trials Industry Revenue Share (%), by Study Design 2025 & 2033
- Figure 28: South America Virtual Clinical Trials Industry Revenue (Million), by Indication Type 2025 & 2033
- Figure 29: South America Virtual Clinical Trials Industry Revenue Share (%), by Indication Type 2025 & 2033
- Figure 30: South America Virtual Clinical Trials Industry Revenue (Million), by Country 2025 & 2033
- Figure 31: South America Virtual Clinical Trials Industry Revenue Share (%), by Country 2025 & 2033
List of Tables
- Table 1: Global Virtual Clinical Trials Industry Revenue Million Forecast, by Study Design 2020 & 2033
- Table 2: Global Virtual Clinical Trials Industry Revenue Million Forecast, by Indication Type 2020 & 2033
- Table 3: Global Virtual Clinical Trials Industry Revenue Million Forecast, by Region 2020 & 2033
- Table 4: Global Virtual Clinical Trials Industry Revenue Million Forecast, by Study Design 2020 & 2033
- Table 5: Global Virtual Clinical Trials Industry Revenue Million Forecast, by Indication Type 2020 & 2033
- Table 6: Global Virtual Clinical Trials Industry Revenue Million Forecast, by Country 2020 & 2033
- Table 7: United States Virtual Clinical Trials Industry Revenue (Million) Forecast, by Application 2020 & 2033
- Table 8: Canada Virtual Clinical Trials Industry Revenue (Million) Forecast, by Application 2020 & 2033
- Table 9: Mexico Virtual Clinical Trials Industry Revenue (Million) Forecast, by Application 2020 & 2033
- Table 10: Global Virtual Clinical Trials Industry Revenue Million Forecast, by Study Design 2020 & 2033
- Table 11: Global Virtual Clinical Trials Industry Revenue Million Forecast, by Indication Type 2020 & 2033
- Table 12: Global Virtual Clinical Trials Industry Revenue Million Forecast, by Country 2020 & 2033
- Table 13: Germany Virtual Clinical Trials Industry Revenue (Million) Forecast, by Application 2020 & 2033
- Table 14: United Kingdom Virtual Clinical Trials Industry Revenue (Million) Forecast, by Application 2020 & 2033
- Table 15: France Virtual Clinical Trials Industry Revenue (Million) Forecast, by Application 2020 & 2033
- Table 16: Italy Virtual Clinical Trials Industry Revenue (Million) Forecast, by Application 2020 & 2033
- Table 17: Spain Virtual Clinical Trials Industry Revenue (Million) Forecast, by Application 2020 & 2033
- Table 18: Rest of Europe Virtual Clinical Trials Industry Revenue (Million) Forecast, by Application 2020 & 2033
- Table 19: Global Virtual Clinical Trials Industry Revenue Million Forecast, by Study Design 2020 & 2033
- Table 20: Global Virtual Clinical Trials Industry Revenue Million Forecast, by Indication Type 2020 & 2033
- Table 21: Global Virtual Clinical Trials Industry Revenue Million Forecast, by Country 2020 & 2033
- Table 22: China Virtual Clinical Trials Industry Revenue (Million) Forecast, by Application 2020 & 2033
- Table 23: Japan Virtual Clinical Trials Industry Revenue (Million) Forecast, by Application 2020 & 2033
- Table 24: India Virtual Clinical Trials Industry Revenue (Million) Forecast, by Application 2020 & 2033
- Table 25: Australia Virtual Clinical Trials Industry Revenue (Million) Forecast, by Application 2020 & 2033
- Table 26: South Korea Virtual Clinical Trials Industry Revenue (Million) Forecast, by Application 2020 & 2033
- Table 27: Rest of Asia Pacific Virtual Clinical Trials Industry Revenue (Million) Forecast, by Application 2020 & 2033
- Table 28: Global Virtual Clinical Trials Industry Revenue Million Forecast, by Study Design 2020 & 2033
- Table 29: Global Virtual Clinical Trials Industry Revenue Million Forecast, by Indication Type 2020 & 2033
- Table 30: Global Virtual Clinical Trials Industry Revenue Million Forecast, by Country 2020 & 2033
- Table 31: GCC Virtual Clinical Trials Industry Revenue (Million) Forecast, by Application 2020 & 2033
- Table 32: South Africa Virtual Clinical Trials Industry Revenue (Million) Forecast, by Application 2020 & 2033
- Table 33: Rest of Middle East and Africa Virtual Clinical Trials Industry Revenue (Million) Forecast, by Application 2020 & 2033
- Table 34: Global Virtual Clinical Trials Industry Revenue Million Forecast, by Study Design 2020 & 2033
- Table 35: Global Virtual Clinical Trials Industry Revenue Million Forecast, by Indication Type 2020 & 2033
- Table 36: Global Virtual Clinical Trials Industry Revenue Million Forecast, by Country 2020 & 2033
- Table 37: Brazil Virtual Clinical Trials Industry Revenue (Million) Forecast, by Application 2020 & 2033
- Table 38: Argentina Virtual Clinical Trials Industry Revenue (Million) Forecast, by Application 2020 & 2033
- Table 39: Rest of South America Virtual Clinical Trials Industry Revenue (Million) Forecast, by Application 2020 & 2033
Frequently Asked Questions
1. What is the projected Compound Annual Growth Rate (CAGR) of the Virtual Clinical Trials Industry?
The projected CAGR is approximately 9.34%.
2. Which companies are prominent players in the Virtual Clinical Trials Industry?
Key companies in the market include IQVIA Inc, ICON PLC, Dassault Systemes SE (Medidata Solutions Inc ), LEO Innovation Lab, Medable Inc, Parexel International Corporation, Oracle Corporation, Signant Health, Clinical Ink Inc, Medpace Holdings Inc, Laboratory Corporation of America Holdings (Covance Inc ).
3. What are the main segments of the Virtual Clinical Trials Industry?
The market segments include Study Design, Indication Type.
4. Can you provide details about the market size?
The market size is estimated to be USD 9.52 Million as of 2022.
5. What are some drivers contributing to market growth?
Growing Digitization in Healthcare Sector; Technological Advancements in Virtual Clinical Trials; Prevalence of Chronic Disease.
6. What are the notable trends driving market growth?
The Oncology Segment is Expected to Occupy a Significant Share of the Market Over the Forecast Period.
7. Are there any restraints impacting market growth?
Challenges Associated with the Virtual Clinical Trials.
8. Can you provide examples of recent developments in the market?
N/A
9. What pricing options are available for accessing the report?
Pricing options include single-user, multi-user, and enterprise licenses priced at USD 4750, USD 5250, and USD 8750 respectively.
10. Is the market size provided in terms of value or volume?
The market size is provided in terms of value, measured in Million.
11. Are there any specific market keywords associated with the report?
Yes, the market keyword associated with the report is "Virtual Clinical Trials Industry," which aids in identifying and referencing the specific market segment covered.
12. How do I determine which pricing option suits my needs best?
The pricing options vary based on user requirements and access needs. Individual users may opt for single-user licenses, while businesses requiring broader access may choose multi-user or enterprise licenses for cost-effective access to the report.
13. Are there any additional resources or data provided in the Virtual Clinical Trials Industry report?
While the report offers comprehensive insights, it's advisable to review the specific contents or supplementary materials provided to ascertain if additional resources or data are available.
14. How can I stay updated on further developments or reports in the Virtual Clinical Trials Industry?
To stay informed about further developments, trends, and reports in the Virtual Clinical Trials Industry, consider subscribing to industry newsletters, following relevant companies and organizations, or regularly checking reputable industry news sources and publications.
Methodology
Step 1 - Identification of Relevant Samples Size from Population Database


Step 2 - Approaches for Defining Global Market Size (Value, Volume* & Price*)

Note*: In applicable scenarios
Step 3 - Data Sources
Primary Research
- Web Analytics
- Survey Reports
- Research Institute
- Latest Research Reports
- Opinion Leaders
Secondary Research
- Annual Reports
- White Paper
- Latest Press Release
- Industry Association
- Paid Database
- Investor Presentations

Step 4 - Data Triangulation
Involves using different sources of information in order to increase the validity of a study
These sources are likely to be stakeholders in a program - participants, other researchers, program staff, other community members, and so on.
Then we put all data in single framework & apply various statistical tools to find out the dynamic on the market.
During the analysis stage, feedback from the stakeholder groups would be compared to determine areas of agreement as well as areas of divergence