
Key Insights
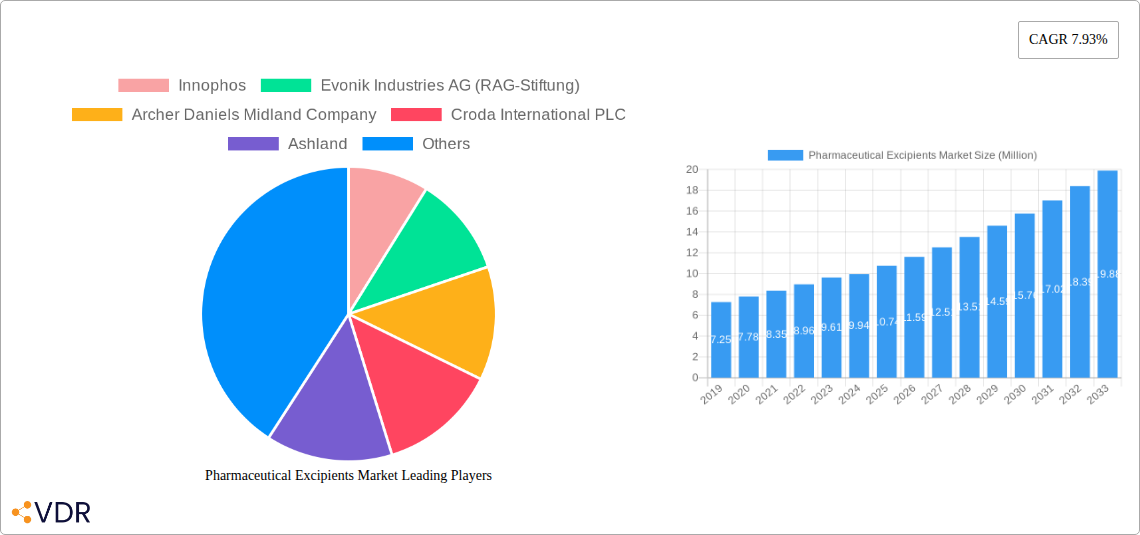
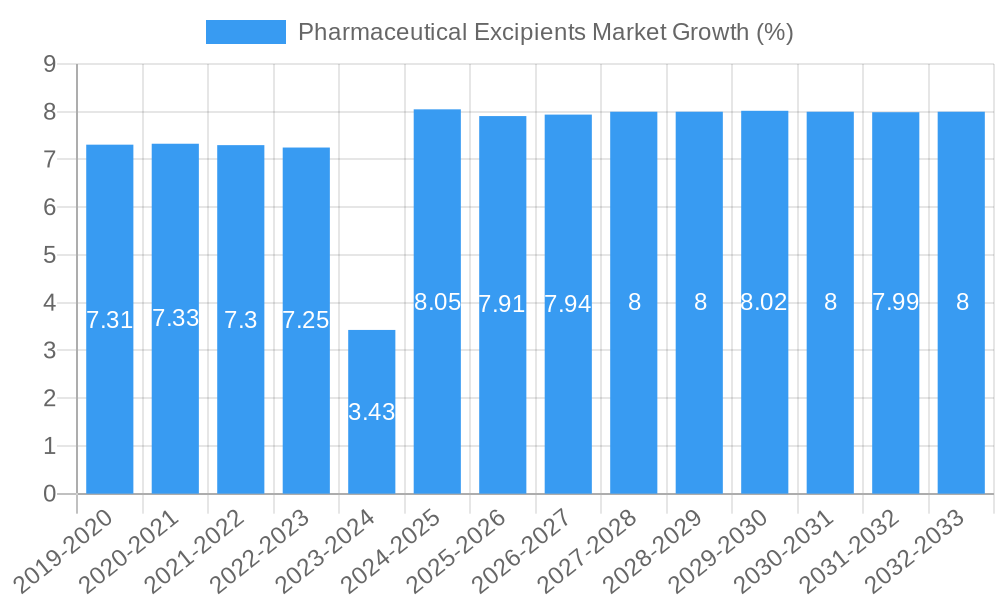
The global Pharmaceutical Excipients Market is poised for robust growth, projected to reach approximately USD 9.94 billion by 2025, with a Compound Annual Growth Rate (CAGR) of 7.93% expected to extend through 2033. This expansion is driven by several key factors, including the escalating demand for novel drug delivery systems, the increasing complexity of pharmaceutical formulations, and a growing global population with a higher prevalence of chronic diseases. Furthermore, the continuous innovation in drug development, coupled with stringent regulatory requirements for drug safety and efficacy, fuels the need for high-quality excipients. The market is segmented into inorganic and organic chemicals, with critical functionalities such as fillers, diluents, binders, suspension and viscosity agents, coatings, flavoring agents, disintegrants, colorants, and preservatives playing pivotal roles in ensuring drug stability, bioavailability, and patient compliance. Key industry players like Innophos, Evonik Industries AG, Archer Daniels Midland Company, Croda International PLC, and BASF SE are actively investing in research and development to introduce advanced excipient solutions that meet evolving pharmaceutical needs, thereby contributing significantly to market dynamics.
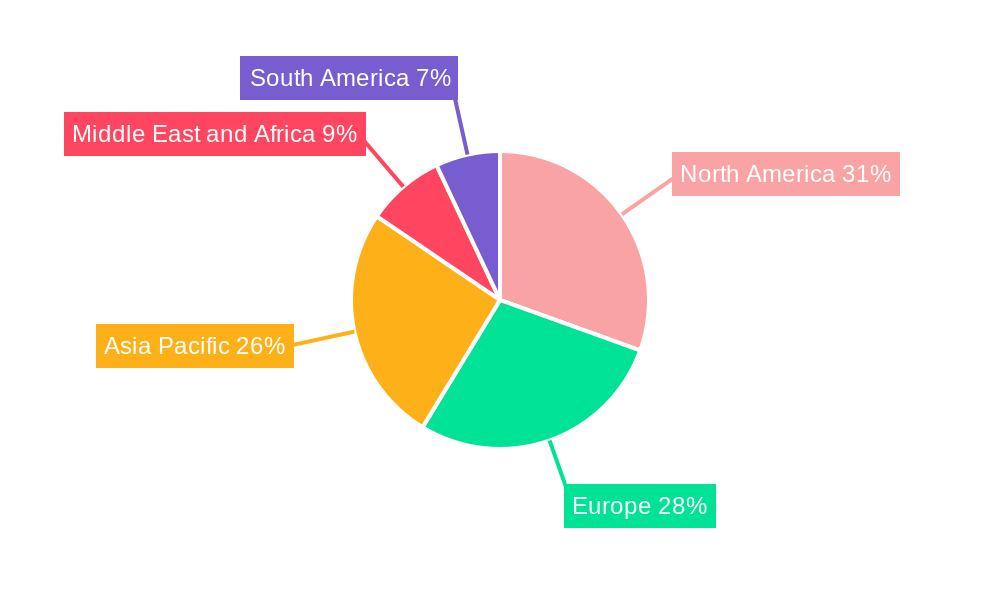
Geographically, North America and Europe currently represent substantial markets due to well-established pharmaceutical industries and high healthcare expenditure. However, the Asia Pacific region is anticipated to witness the fastest growth, propelled by the burgeoning pharmaceutical manufacturing base, increasing healthcare access, and supportive government initiatives in countries like China and India. Restraints to market growth may include the rising cost of raw materials and intense competition among market participants. Despite these challenges, the market's trajectory remains positive, supported by continuous technological advancements in excipient production and the expanding pipeline of generic and novel drug formulations requiring sophisticated excipient applications. The focus on patient safety and the development of advanced drug formulations for targeted therapies will continue to shape the demand for specialized excipients, underscoring the market's inherent resilience and growth potential.
Pharmaceutical Excipients Market: Navigating Innovation, Regulation, and Global Demand
This comprehensive pharmaceutical excipients market report delves into the dynamic landscape of pharmaceutical manufacturing, providing in-depth analysis and actionable insights for industry stakeholders. Covering the study period from 2019 to 2033, with a base and estimated year of 2025 and a forecast period of 2025–2033, this report leverages historical data from 2019–2024 to offer a robust understanding of market evolution. We meticulously examine the parent market and child markets, integrating high-traffic keywords such as pharmaceutical ingredients, drug delivery excipients, inert pharmaceutical ingredients, API excipients, excipient manufacturing, biopharmaceutical excipients, and oral drug delivery to maximize search engine visibility. Understand the pivotal role of excipients in enhancing drug efficacy, patient compliance, and manufacturing efficiency. This report is designed for pharmaceutical manufacturers, excipient suppliers, regulatory bodies, R&D professionals, and investors seeking to capitalize on the burgeoning opportunities within this critical sector.
Pharmaceutical Excipients Market Market Dynamics & Structure
The pharmaceutical excipients market is characterized by a moderate level of concentration, with a few key players holding significant market share while a long tail of smaller manufacturers caters to niche demands. Technological innovation is a primary driver, fueled by the constant need for improved drug delivery systems, enhanced bioavailability, and patient-friendly formulations. Regulatory frameworks, including stringent guidelines from bodies like the FDA and EMA, play a crucial role in shaping product development, quality control, and market entry. The competitive landscape is influenced by the availability of competitive product substitutes, particularly in the realm of novel excipient development for advanced drug delivery platforms. End-user demographics, comprising the pharmaceutical and biotechnology industries, dictate the demand for specific excipient functionalities and product types. Mergers and acquisitions (M&A) trends are prevalent, driven by companies seeking to expand their product portfolios, gain access to new technologies, or strengthen their market position. For instance, M&A activities in the past year have seen an estimated volume of 15-20 significant deals valued in the hundreds of millions of dollars as companies consolidate to achieve economies of scale and broaden their offerings in areas like specialty excipients. Innovation barriers include the lengthy and costly drug development and approval process, requiring extensive safety and efficacy testing of new excipients.
- Market Concentration: Moderate, with leading players and a fragmented smaller segment.
- Technological Innovation: Driven by advancements in drug delivery, controlled release, and solubility enhancement.
- Regulatory Landscape: Strict adherence to GMP, pharmacopeial standards, and regional regulations.
- Competitive Substitutes: Emerging novel excipients and alternative formulation approaches.
- End-User Demographics: Dominated by pharmaceutical and biopharmaceutical companies.
- M&A Trends: Strategic acquisitions to enhance capabilities and market reach.
- Innovation Barriers: High R&D costs and complex regulatory approval pathways.
Pharmaceutical Excipients Market Growth Trends & Insights
The pharmaceutical excipients market is poised for robust growth, driven by the escalating demand for innovative drug formulations and the expanding global pharmaceutical industry. The market size is projected to reach approximately USD 15,500 million by 2025, with an anticipated Compound Annual Growth Rate (CAGR) of 6.8% during the forecast period. This growth is further propelled by increasing healthcare expenditure worldwide, a rising prevalence of chronic diseases requiring long-term medication, and the growing pipeline of novel therapeutics. The adoption rates of advanced excipients, particularly those enabling targeted drug delivery, personalized medicine, and improved patient compliance, are on an upward trajectory. Technological disruptions, such as the development of biodegradable polymers for controlled release and the use of nanotechnology in drug delivery, are significantly influencing market dynamics. Consumer behavior shifts towards more convenient and effective medication administration methods, such as oral films and orally disintegrating tablets, are creating new avenues for excipient innovation. The integration of digital technologies in drug development and manufacturing is also playing a role in optimizing excipient selection and utilization, leading to enhanced product performance and reduced manufacturing costs. The increasing focus on biopharmaceuticals and the development of complex biologics are also spurring demand for specialized excipients that can ensure the stability and efficacy of these sensitive molecules. This evolving landscape presents significant opportunities for companies offering high-quality, performance-driven excipient solutions that address unmet needs in drug formulation and delivery. The estimated market penetration of specialty excipients for advanced drug delivery is expected to grow from 35% in 2023 to 48% by 2028, indicating a strong shift towards value-added ingredients.
Dominant Regions, Countries, or Segments in Pharmaceutical Excipients Market
The organic chemicals segment, particularly excipients derived from natural sources like cellulose derivatives, starches, and sugars, is a dominant force within the pharmaceutical excipients market. This dominance is attributed to their inherent biocompatibility, biodegradability, and cost-effectiveness. Within this segment, fillers and diluents represent the largest functional category, essential for bulk in solid dosage forms and contributing approximately 30% of the total excipient market value. North America currently leads the market, driven by its advanced pharmaceutical research and development infrastructure, robust regulatory environment, and high per capita healthcare spending. The United States, in particular, is a key market due to the presence of major pharmaceutical companies and a thriving biotechnology sector. Key drivers of this regional dominance include substantial investment in R&D for novel drug formulations and a strong emphasis on patient safety and drug efficacy. The region's well-established manufacturing base and access to advanced technologies further solidify its leading position.
The market share held by North America is estimated at around 38% of the global pharmaceutical excipients market. Factors contributing to this include:
- High R&D Investment: Significant funding allocated to pharmaceutical innovation and drug discovery.
- Advanced Manufacturing Capabilities: State-of-the-art facilities and adoption of cutting-edge technologies.
- Favorable Regulatory Environment: Streamlined approval processes for new drugs and excipients.
- Growing Demand for Specialty Excipients: Increasing focus on targeted drug delivery and personalized medicine.
The growth potential in emerging economies, particularly in Asia Pacific, is also noteworthy, driven by an expanding patient population, increasing access to healthcare, and a growing generic drug market. However, regulatory complexities and infrastructure challenges in some of these regions can present hurdles to rapid expansion. The demand for binders and suspension and viscosity agents is also substantial, reflecting the widespread use of tablets, capsules, and liquid formulations. The increasing complexity of drug molecules necessitates the use of specialized excipients that can enhance solubility and stability, further driving growth in the organic chemicals segment.
Pharmaceutical Excipients Market Product Landscape
The pharmaceutical excipients market is characterized by a dynamic product landscape driven by innovation and the evolving needs of drug development. Inorganic chemicals, such as calcium phosphate and titanium dioxide, continue to play a vital role as fillers and opacifiers. However, organic chemicals, including cellulose derivatives, starches, polymers like povidone, and lipids, are witnessing accelerated growth due to their versatility in drug delivery applications. Key product innovations focus on enhancing solubility of poorly soluble APIs, enabling controlled and targeted release, improving patient compliance through taste masking and easier administration, and ensuring the stability of sensitive biologics. Performance metrics like particle size, flowability, compressibility, and dissolution profiles are critical for excipient selection. Unique selling propositions often lie in high purity, specific functional properties, and regulatory compliance. Technological advancements in manufacturing processes allow for the production of highly specialized excipients tailored to specific drug formulations.
Key Drivers, Barriers & Challenges in Pharmaceutical Excipients Market
The pharmaceutical excipients market is primarily propelled by several key drivers: an aging global population and the rising incidence of chronic diseases necessitating continuous medication; an expanding generic drug market, requiring cost-effective and reliable excipients; increasing R&D in novel drug delivery systems for improved efficacy and patient compliance; and a growing demand for biopharmaceuticals requiring specialized, high-purity excipients. Technological advancements in material science and biotechnology are also continuously introducing new excipient functionalities.
Conversely, significant barriers and challenges exist. Stringent and evolving regulatory requirements for excipient safety and quality can lead to lengthy approval processes and increased development costs. The high cost of research and development for novel excipients, coupled with the need for extensive clinical validation, poses a substantial financial hurdle. Furthermore, supply chain disruptions, geopolitical uncertainties, and the potential for raw material price volatility can impact manufacturing and profitability. Intense competition from existing players and the threat of new entrants also present ongoing challenges.
Emerging Opportunities in Pharmaceutical Excipients Market
Emerging opportunities in the pharmaceutical excipients market lie in the rapidly growing field of personalized medicine, requiring highly customized excipients for patient-specific dosages and delivery methods. The development of novel excipients for biologics and gene therapies presents a significant untapped market, focusing on stabilization, targeted delivery, and enhanced cellular uptake. Furthermore, the demand for sustainable and bio-based excipients is increasing, driven by environmental consciousness and regulatory pressures, offering opportunities for green chemistry innovations. The expansion of oral drug delivery systems for complex molecules, such as peptides and proteins, also represents a substantial growth avenue, necessitating advanced excipients for improved bioavailability and stability. The burgeoning markets in developing economies, coupled with advancements in healthcare infrastructure, also offer considerable expansion potential.
Growth Accelerators in the Pharmaceutical Excipients Market Industry
Several catalysts are accelerating long-term growth in the pharmaceutical excipients market. Technological breakthroughs in polymer science and nanotechnology are enabling the creation of excipients with superior drug release profiles and targeting capabilities. Strategic partnerships between excipient manufacturers and pharmaceutical companies are fostering collaborative innovation and faster product development cycles. Market expansion strategies targeting emerging economies, driven by increasing healthcare access and demand for affordable medicines, are also key accelerators. The growing focus on excipient master files (EMFs) and regulatory harmonization across regions is streamlining the approval process, facilitating market entry for new excipients. The increasing investment in biopharmaceutical research and development is also a significant growth driver, demanding specialized excipients that ensure the integrity and efficacy of these complex therapeutics.
Key Players Shaping the Pharmaceutical Excipients Market Market
- Innophos
- Evonik Industries AG (RAG-Stiftung)
- Archer Daniels Midland Company
- Croda International PLC
- Ashland
- BASF SE
- Air Liquide group
- Roquette Frères
- DuPont
- The Lubrizol Corporation
- Associated British Foods PLC
- Kerry
Notable Milestones in Pharmaceutical Excipients Market Sector
- October 2023: Clariant, a sustainability-focused specialty chemicals company, launched its portfolio of high-performing pharmaceutical ingredient solutions to support the evolution of safe and effective medicines. Also, Clariant Health Care expanded its range of functional excipients to solve active pharmaceutical ingredient (API) delivery & bioavailability challenges.
- September 2023: Roquette, a company focused on plant-based ingredients and a provider of pharmaceutical and nutraceutical excipients, launched three new excipient grades to its portfolio of solutions for moisture-sensitive active pharmaceutical and nutraceutical ingredients.
In-Depth Pharmaceutical Excipients Market Market Outlook
The future outlook for the pharmaceutical excipients market is exceptionally promising, driven by sustained innovation and increasing global healthcare needs. Growth accelerators such as advancements in drug delivery technologies, the burgeoning biopharmaceutical sector, and a growing emphasis on patient-centric formulations will continue to shape market expansion. Strategic opportunities lie in developing specialized excipients for complex therapies, sustainable sourcing and manufacturing practices, and catering to the evolving demands of emerging markets. The increasing collaboration between excipient manufacturers and pharmaceutical companies, coupled with a favorable regulatory environment for innovative solutions, will further fuel market growth. Companies that can offer high-purity, functional, and regulatory-compliant excipients will be well-positioned to capitalize on the vast potential within this essential sector of the pharmaceutical industry. The estimated market potential for excipients in novel drug delivery systems is projected to grow by USD 5,000 million over the next five years, highlighting the significant future opportunities.
Pharmaceutical Excipients Market Segmentation
-
1. Product
- 1.1. Inorganic Chemicals
- 1.2. Organic Chemicals
-
2. Functionality
- 2.1. Fillers and Diluents
- 2.2. Binders
- 2.3. Suspension and Viscosity Agents
- 2.4. Coatings
- 2.5. Flavoring Agents
- 2.6. Disintegrants
- 2.7. Colorants
- 2.8. Preservatives
- 2.9. Other Functionalities
Pharmaceutical Excipients Market Segmentation By Geography
-
1. North America
- 1.1. United States
- 1.2. Canada
- 1.3. Mexico
-
2. Europe
- 2.1. Germany
- 2.2. United Kingdom
- 2.3. France
- 2.4. Italy
- 2.5. Spain
- 2.6. Rest of Europe
-
3. Asia Pacific
- 3.1. China
- 3.2. Japan
- 3.3. India
- 3.4. Australia
- 3.5. South Korea
- 3.6. Rest of Asia Pacific
-
4. Middle East and Africa
- 4.1. GCC
- 4.2. South Africa
- 4.3. Rest of Middle East and Africa
-
5. South America
- 5.1. Brazil
- 5.2. Argentina
- 5.3. Rest of South America
Pharmaceutical Excipients Market REPORT HIGHLIGHTS
| Aspects | Details |
|---|---|
| Study Period | 2019-2033 |
| Base Year | 2024 |
| Estimated Year | 2025 |
| Forecast Period | 2025-2033 |
| Historical Period | 2019-2024 |
| Growth Rate | CAGR of 7.93% from 2019-2033 |
| Segmentation |
|
Table of Contents
- 1. Introduction
- 1.1. Research Scope
- 1.2. Market Segmentation
- 1.3. Research Methodology
- 1.4. Definitions and Assumptions
- 2. Executive Summary
- 2.1. Introduction
- 3. Market Dynamics
- 3.1. Introduction
- 3.2. Market Drivers
- 3.2.1. Increasing Demand for Functionality Excipients; Recent Patents Expiries Driving the Demand for Pharmaceutical Excipients; Rapid Advancements in Nanotechnology
- 3.3. Market Restrains
- 3.3.1. Lack of Proper Approval Process; Adverse Reactions of Excipients and Contamination in Formulations
- 3.4. Market Trends
- 3.4.1. Binders Segment is Expected to Show a Significant Growth Over the Forecast Period
- 4. Market Factor Analysis
- 4.1. Porters Five Forces
- 4.2. Supply/Value Chain
- 4.3. PESTEL analysis
- 4.4. Market Entropy
- 4.5. Patent/Trademark Analysis
- 5. Global Pharmaceutical Excipients Market Analysis, Insights and Forecast, 2019-2031
- 5.1. Market Analysis, Insights and Forecast - by Product
- 5.1.1. Inorganic Chemicals
- 5.1.2. Organic Chemicals
- 5.2. Market Analysis, Insights and Forecast - by Functionality
- 5.2.1. Fillers and Diluents
- 5.2.2. Binders
- 5.2.3. Suspension and Viscosity Agents
- 5.2.4. Coatings
- 5.2.5. Flavoring Agents
- 5.2.6. Disintegrants
- 5.2.7. Colorants
- 5.2.8. Preservatives
- 5.2.9. Other Functionalities
- 5.3. Market Analysis, Insights and Forecast - by Region
- 5.3.1. North America
- 5.3.2. Europe
- 5.3.3. Asia Pacific
- 5.3.4. Middle East and Africa
- 5.3.5. South America
- 5.1. Market Analysis, Insights and Forecast - by Product
- 6. North America Pharmaceutical Excipients Market Analysis, Insights and Forecast, 2019-2031
- 6.1. Market Analysis, Insights and Forecast - by Product
- 6.1.1. Inorganic Chemicals
- 6.1.2. Organic Chemicals
- 6.2. Market Analysis, Insights and Forecast - by Functionality
- 6.2.1. Fillers and Diluents
- 6.2.2. Binders
- 6.2.3. Suspension and Viscosity Agents
- 6.2.4. Coatings
- 6.2.5. Flavoring Agents
- 6.2.6. Disintegrants
- 6.2.7. Colorants
- 6.2.8. Preservatives
- 6.2.9. Other Functionalities
- 6.1. Market Analysis, Insights and Forecast - by Product
- 7. Europe Pharmaceutical Excipients Market Analysis, Insights and Forecast, 2019-2031
- 7.1. Market Analysis, Insights and Forecast - by Product
- 7.1.1. Inorganic Chemicals
- 7.1.2. Organic Chemicals
- 7.2. Market Analysis, Insights and Forecast - by Functionality
- 7.2.1. Fillers and Diluents
- 7.2.2. Binders
- 7.2.3. Suspension and Viscosity Agents
- 7.2.4. Coatings
- 7.2.5. Flavoring Agents
- 7.2.6. Disintegrants
- 7.2.7. Colorants
- 7.2.8. Preservatives
- 7.2.9. Other Functionalities
- 7.1. Market Analysis, Insights and Forecast - by Product
- 8. Asia Pacific Pharmaceutical Excipients Market Analysis, Insights and Forecast, 2019-2031
- 8.1. Market Analysis, Insights and Forecast - by Product
- 8.1.1. Inorganic Chemicals
- 8.1.2. Organic Chemicals
- 8.2. Market Analysis, Insights and Forecast - by Functionality
- 8.2.1. Fillers and Diluents
- 8.2.2. Binders
- 8.2.3. Suspension and Viscosity Agents
- 8.2.4. Coatings
- 8.2.5. Flavoring Agents
- 8.2.6. Disintegrants
- 8.2.7. Colorants
- 8.2.8. Preservatives
- 8.2.9. Other Functionalities
- 8.1. Market Analysis, Insights and Forecast - by Product
- 9. Middle East and Africa Pharmaceutical Excipients Market Analysis, Insights and Forecast, 2019-2031
- 9.1. Market Analysis, Insights and Forecast - by Product
- 9.1.1. Inorganic Chemicals
- 9.1.2. Organic Chemicals
- 9.2. Market Analysis, Insights and Forecast - by Functionality
- 9.2.1. Fillers and Diluents
- 9.2.2. Binders
- 9.2.3. Suspension and Viscosity Agents
- 9.2.4. Coatings
- 9.2.5. Flavoring Agents
- 9.2.6. Disintegrants
- 9.2.7. Colorants
- 9.2.8. Preservatives
- 9.2.9. Other Functionalities
- 9.1. Market Analysis, Insights and Forecast - by Product
- 10. South America Pharmaceutical Excipients Market Analysis, Insights and Forecast, 2019-2031
- 10.1. Market Analysis, Insights and Forecast - by Product
- 10.1.1. Inorganic Chemicals
- 10.1.2. Organic Chemicals
- 10.2. Market Analysis, Insights and Forecast - by Functionality
- 10.2.1. Fillers and Diluents
- 10.2.2. Binders
- 10.2.3. Suspension and Viscosity Agents
- 10.2.4. Coatings
- 10.2.5. Flavoring Agents
- 10.2.6. Disintegrants
- 10.2.7. Colorants
- 10.2.8. Preservatives
- 10.2.9. Other Functionalities
- 10.1. Market Analysis, Insights and Forecast - by Product
- 11. North America Pharmaceutical Excipients Market Analysis, Insights and Forecast, 2019-2031
- 11.1. Market Analysis, Insights and Forecast - By Country/Sub-region
- 11.1.1 United States
- 11.1.2 Canada
- 11.1.3 Mexico
- 12. Europe Pharmaceutical Excipients Market Analysis, Insights and Forecast, 2019-2031
- 12.1. Market Analysis, Insights and Forecast - By Country/Sub-region
- 12.1.1 Germany
- 12.1.2 United Kingdom
- 12.1.3 France
- 12.1.4 Italy
- 12.1.5 Spain
- 12.1.6 Rest of Europe
- 13. Asia Pacific Pharmaceutical Excipients Market Analysis, Insights and Forecast, 2019-2031
- 13.1. Market Analysis, Insights and Forecast - By Country/Sub-region
- 13.1.1 China
- 13.1.2 Japan
- 13.1.3 India
- 13.1.4 Australia
- 13.1.5 South Korea
- 13.1.6 Rest of Asia Pacific
- 14. Middle East and Africa Pharmaceutical Excipients Market Analysis, Insights and Forecast, 2019-2031
- 14.1. Market Analysis, Insights and Forecast - By Country/Sub-region
- 14.1.1 GCC
- 14.1.2 South Africa
- 14.1.3 Rest of Middle East and Africa
- 15. South America Pharmaceutical Excipients Market Analysis, Insights and Forecast, 2019-2031
- 15.1. Market Analysis, Insights and Forecast - By Country/Sub-region
- 15.1.1 Brazil
- 15.1.2 Argentina
- 15.1.3 Rest of South America
- 16. Competitive Analysis
- 16.1. Global Market Share Analysis 2024
- 16.2. Company Profiles
- 16.2.1 Innophos
- 16.2.1.1. Overview
- 16.2.1.2. Products
- 16.2.1.3. SWOT Analysis
- 16.2.1.4. Recent Developments
- 16.2.1.5. Financials (Based on Availability)
- 16.2.2 Evonik Industries AG (RAG-Stiftung)
- 16.2.2.1. Overview
- 16.2.2.2. Products
- 16.2.2.3. SWOT Analysis
- 16.2.2.4. Recent Developments
- 16.2.2.5. Financials (Based on Availability)
- 16.2.3 Archer Daniels Midland Company
- 16.2.3.1. Overview
- 16.2.3.2. Products
- 16.2.3.3. SWOT Analysis
- 16.2.3.4. Recent Developments
- 16.2.3.5. Financials (Based on Availability)
- 16.2.4 Croda International PLC
- 16.2.4.1. Overview
- 16.2.4.2. Products
- 16.2.4.3. SWOT Analysis
- 16.2.4.4. Recent Developments
- 16.2.4.5. Financials (Based on Availability)
- 16.2.5 Ashland
- 16.2.5.1. Overview
- 16.2.5.2. Products
- 16.2.5.3. SWOT Analysis
- 16.2.5.4. Recent Developments
- 16.2.5.5. Financials (Based on Availability)
- 16.2.6 BASF SE
- 16.2.6.1. Overview
- 16.2.6.2. Products
- 16.2.6.3. SWOT Analysis
- 16.2.6.4. Recent Developments
- 16.2.6.5. Financials (Based on Availability)
- 16.2.7 Air Liquide group
- 16.2.7.1. Overview
- 16.2.7.2. Products
- 16.2.7.3. SWOT Analysis
- 16.2.7.4. Recent Developments
- 16.2.7.5. Financials (Based on Availability)
- 16.2.8 Roquette Frères
- 16.2.8.1. Overview
- 16.2.8.2. Products
- 16.2.8.3. SWOT Analysis
- 16.2.8.4. Recent Developments
- 16.2.8.5. Financials (Based on Availability)
- 16.2.9 DuPont
- 16.2.9.1. Overview
- 16.2.9.2. Products
- 16.2.9.3. SWOT Analysis
- 16.2.9.4. Recent Developments
- 16.2.9.5. Financials (Based on Availability)
- 16.2.10 The Lubrizol Corporation
- 16.2.10.1. Overview
- 16.2.10.2. Products
- 16.2.10.3. SWOT Analysis
- 16.2.10.4. Recent Developments
- 16.2.10.5. Financials (Based on Availability)
- 16.2.11 Associated British Foods PLC
- 16.2.11.1. Overview
- 16.2.11.2. Products
- 16.2.11.3. SWOT Analysis
- 16.2.11.4. Recent Developments
- 16.2.11.5. Financials (Based on Availability)
- 16.2.12 Kerry
- 16.2.12.1. Overview
- 16.2.12.2. Products
- 16.2.12.3. SWOT Analysis
- 16.2.12.4. Recent Developments
- 16.2.12.5. Financials (Based on Availability)
- 16.2.1 Innophos
List of Figures
- Figure 1: Global Pharmaceutical Excipients Market Revenue Breakdown (Million, %) by Region 2024 & 2032
- Figure 2: Global Pharmaceutical Excipients Market Volume Breakdown (K Unit, %) by Region 2024 & 2032
- Figure 3: North America Pharmaceutical Excipients Market Revenue (Million), by Country 2024 & 2032
- Figure 4: North America Pharmaceutical Excipients Market Volume (K Unit), by Country 2024 & 2032
- Figure 5: North America Pharmaceutical Excipients Market Revenue Share (%), by Country 2024 & 2032
- Figure 6: North America Pharmaceutical Excipients Market Volume Share (%), by Country 2024 & 2032
- Figure 7: Europe Pharmaceutical Excipients Market Revenue (Million), by Country 2024 & 2032
- Figure 8: Europe Pharmaceutical Excipients Market Volume (K Unit), by Country 2024 & 2032
- Figure 9: Europe Pharmaceutical Excipients Market Revenue Share (%), by Country 2024 & 2032
- Figure 10: Europe Pharmaceutical Excipients Market Volume Share (%), by Country 2024 & 2032
- Figure 11: Asia Pacific Pharmaceutical Excipients Market Revenue (Million), by Country 2024 & 2032
- Figure 12: Asia Pacific Pharmaceutical Excipients Market Volume (K Unit), by Country 2024 & 2032
- Figure 13: Asia Pacific Pharmaceutical Excipients Market Revenue Share (%), by Country 2024 & 2032
- Figure 14: Asia Pacific Pharmaceutical Excipients Market Volume Share (%), by Country 2024 & 2032
- Figure 15: Middle East and Africa Pharmaceutical Excipients Market Revenue (Million), by Country 2024 & 2032
- Figure 16: Middle East and Africa Pharmaceutical Excipients Market Volume (K Unit), by Country 2024 & 2032
- Figure 17: Middle East and Africa Pharmaceutical Excipients Market Revenue Share (%), by Country 2024 & 2032
- Figure 18: Middle East and Africa Pharmaceutical Excipients Market Volume Share (%), by Country 2024 & 2032
- Figure 19: South America Pharmaceutical Excipients Market Revenue (Million), by Country 2024 & 2032
- Figure 20: South America Pharmaceutical Excipients Market Volume (K Unit), by Country 2024 & 2032
- Figure 21: South America Pharmaceutical Excipients Market Revenue Share (%), by Country 2024 & 2032
- Figure 22: South America Pharmaceutical Excipients Market Volume Share (%), by Country 2024 & 2032
- Figure 23: North America Pharmaceutical Excipients Market Revenue (Million), by Product 2024 & 2032
- Figure 24: North America Pharmaceutical Excipients Market Volume (K Unit), by Product 2024 & 2032
- Figure 25: North America Pharmaceutical Excipients Market Revenue Share (%), by Product 2024 & 2032
- Figure 26: North America Pharmaceutical Excipients Market Volume Share (%), by Product 2024 & 2032
- Figure 27: North America Pharmaceutical Excipients Market Revenue (Million), by Functionality 2024 & 2032
- Figure 28: North America Pharmaceutical Excipients Market Volume (K Unit), by Functionality 2024 & 2032
- Figure 29: North America Pharmaceutical Excipients Market Revenue Share (%), by Functionality 2024 & 2032
- Figure 30: North America Pharmaceutical Excipients Market Volume Share (%), by Functionality 2024 & 2032
- Figure 31: North America Pharmaceutical Excipients Market Revenue (Million), by Country 2024 & 2032
- Figure 32: North America Pharmaceutical Excipients Market Volume (K Unit), by Country 2024 & 2032
- Figure 33: North America Pharmaceutical Excipients Market Revenue Share (%), by Country 2024 & 2032
- Figure 34: North America Pharmaceutical Excipients Market Volume Share (%), by Country 2024 & 2032
- Figure 35: Europe Pharmaceutical Excipients Market Revenue (Million), by Product 2024 & 2032
- Figure 36: Europe Pharmaceutical Excipients Market Volume (K Unit), by Product 2024 & 2032
- Figure 37: Europe Pharmaceutical Excipients Market Revenue Share (%), by Product 2024 & 2032
- Figure 38: Europe Pharmaceutical Excipients Market Volume Share (%), by Product 2024 & 2032
- Figure 39: Europe Pharmaceutical Excipients Market Revenue (Million), by Functionality 2024 & 2032
- Figure 40: Europe Pharmaceutical Excipients Market Volume (K Unit), by Functionality 2024 & 2032
- Figure 41: Europe Pharmaceutical Excipients Market Revenue Share (%), by Functionality 2024 & 2032
- Figure 42: Europe Pharmaceutical Excipients Market Volume Share (%), by Functionality 2024 & 2032
- Figure 43: Europe Pharmaceutical Excipients Market Revenue (Million), by Country 2024 & 2032
- Figure 44: Europe Pharmaceutical Excipients Market Volume (K Unit), by Country 2024 & 2032
- Figure 45: Europe Pharmaceutical Excipients Market Revenue Share (%), by Country 2024 & 2032
- Figure 46: Europe Pharmaceutical Excipients Market Volume Share (%), by Country 2024 & 2032
- Figure 47: Asia Pacific Pharmaceutical Excipients Market Revenue (Million), by Product 2024 & 2032
- Figure 48: Asia Pacific Pharmaceutical Excipients Market Volume (K Unit), by Product 2024 & 2032
- Figure 49: Asia Pacific Pharmaceutical Excipients Market Revenue Share (%), by Product 2024 & 2032
- Figure 50: Asia Pacific Pharmaceutical Excipients Market Volume Share (%), by Product 2024 & 2032
- Figure 51: Asia Pacific Pharmaceutical Excipients Market Revenue (Million), by Functionality 2024 & 2032
- Figure 52: Asia Pacific Pharmaceutical Excipients Market Volume (K Unit), by Functionality 2024 & 2032
- Figure 53: Asia Pacific Pharmaceutical Excipients Market Revenue Share (%), by Functionality 2024 & 2032
- Figure 54: Asia Pacific Pharmaceutical Excipients Market Volume Share (%), by Functionality 2024 & 2032
- Figure 55: Asia Pacific Pharmaceutical Excipients Market Revenue (Million), by Country 2024 & 2032
- Figure 56: Asia Pacific Pharmaceutical Excipients Market Volume (K Unit), by Country 2024 & 2032
- Figure 57: Asia Pacific Pharmaceutical Excipients Market Revenue Share (%), by Country 2024 & 2032
- Figure 58: Asia Pacific Pharmaceutical Excipients Market Volume Share (%), by Country 2024 & 2032
- Figure 59: Middle East and Africa Pharmaceutical Excipients Market Revenue (Million), by Product 2024 & 2032
- Figure 60: Middle East and Africa Pharmaceutical Excipients Market Volume (K Unit), by Product 2024 & 2032
- Figure 61: Middle East and Africa Pharmaceutical Excipients Market Revenue Share (%), by Product 2024 & 2032
- Figure 62: Middle East and Africa Pharmaceutical Excipients Market Volume Share (%), by Product 2024 & 2032
- Figure 63: Middle East and Africa Pharmaceutical Excipients Market Revenue (Million), by Functionality 2024 & 2032
- Figure 64: Middle East and Africa Pharmaceutical Excipients Market Volume (K Unit), by Functionality 2024 & 2032
- Figure 65: Middle East and Africa Pharmaceutical Excipients Market Revenue Share (%), by Functionality 2024 & 2032
- Figure 66: Middle East and Africa Pharmaceutical Excipients Market Volume Share (%), by Functionality 2024 & 2032
- Figure 67: Middle East and Africa Pharmaceutical Excipients Market Revenue (Million), by Country 2024 & 2032
- Figure 68: Middle East and Africa Pharmaceutical Excipients Market Volume (K Unit), by Country 2024 & 2032
- Figure 69: Middle East and Africa Pharmaceutical Excipients Market Revenue Share (%), by Country 2024 & 2032
- Figure 70: Middle East and Africa Pharmaceutical Excipients Market Volume Share (%), by Country 2024 & 2032
- Figure 71: South America Pharmaceutical Excipients Market Revenue (Million), by Product 2024 & 2032
- Figure 72: South America Pharmaceutical Excipients Market Volume (K Unit), by Product 2024 & 2032
- Figure 73: South America Pharmaceutical Excipients Market Revenue Share (%), by Product 2024 & 2032
- Figure 74: South America Pharmaceutical Excipients Market Volume Share (%), by Product 2024 & 2032
- Figure 75: South America Pharmaceutical Excipients Market Revenue (Million), by Functionality 2024 & 2032
- Figure 76: South America Pharmaceutical Excipients Market Volume (K Unit), by Functionality 2024 & 2032
- Figure 77: South America Pharmaceutical Excipients Market Revenue Share (%), by Functionality 2024 & 2032
- Figure 78: South America Pharmaceutical Excipients Market Volume Share (%), by Functionality 2024 & 2032
- Figure 79: South America Pharmaceutical Excipients Market Revenue (Million), by Country 2024 & 2032
- Figure 80: South America Pharmaceutical Excipients Market Volume (K Unit), by Country 2024 & 2032
- Figure 81: South America Pharmaceutical Excipients Market Revenue Share (%), by Country 2024 & 2032
- Figure 82: South America Pharmaceutical Excipients Market Volume Share (%), by Country 2024 & 2032
List of Tables
- Table 1: Global Pharmaceutical Excipients Market Revenue Million Forecast, by Region 2019 & 2032
- Table 2: Global Pharmaceutical Excipients Market Volume K Unit Forecast, by Region 2019 & 2032
- Table 3: Global Pharmaceutical Excipients Market Revenue Million Forecast, by Product 2019 & 2032
- Table 4: Global Pharmaceutical Excipients Market Volume K Unit Forecast, by Product 2019 & 2032
- Table 5: Global Pharmaceutical Excipients Market Revenue Million Forecast, by Functionality 2019 & 2032
- Table 6: Global Pharmaceutical Excipients Market Volume K Unit Forecast, by Functionality 2019 & 2032
- Table 7: Global Pharmaceutical Excipients Market Revenue Million Forecast, by Region 2019 & 2032
- Table 8: Global Pharmaceutical Excipients Market Volume K Unit Forecast, by Region 2019 & 2032
- Table 9: Global Pharmaceutical Excipients Market Revenue Million Forecast, by Country 2019 & 2032
- Table 10: Global Pharmaceutical Excipients Market Volume K Unit Forecast, by Country 2019 & 2032
- Table 11: United States Pharmaceutical Excipients Market Revenue (Million) Forecast, by Application 2019 & 2032
- Table 12: United States Pharmaceutical Excipients Market Volume (K Unit) Forecast, by Application 2019 & 2032
- Table 13: Canada Pharmaceutical Excipients Market Revenue (Million) Forecast, by Application 2019 & 2032
- Table 14: Canada Pharmaceutical Excipients Market Volume (K Unit) Forecast, by Application 2019 & 2032
- Table 15: Mexico Pharmaceutical Excipients Market Revenue (Million) Forecast, by Application 2019 & 2032
- Table 16: Mexico Pharmaceutical Excipients Market Volume (K Unit) Forecast, by Application 2019 & 2032
- Table 17: Global Pharmaceutical Excipients Market Revenue Million Forecast, by Country 2019 & 2032
- Table 18: Global Pharmaceutical Excipients Market Volume K Unit Forecast, by Country 2019 & 2032
- Table 19: Germany Pharmaceutical Excipients Market Revenue (Million) Forecast, by Application 2019 & 2032
- Table 20: Germany Pharmaceutical Excipients Market Volume (K Unit) Forecast, by Application 2019 & 2032
- Table 21: United Kingdom Pharmaceutical Excipients Market Revenue (Million) Forecast, by Application 2019 & 2032
- Table 22: United Kingdom Pharmaceutical Excipients Market Volume (K Unit) Forecast, by Application 2019 & 2032
- Table 23: France Pharmaceutical Excipients Market Revenue (Million) Forecast, by Application 2019 & 2032
- Table 24: France Pharmaceutical Excipients Market Volume (K Unit) Forecast, by Application 2019 & 2032
- Table 25: Italy Pharmaceutical Excipients Market Revenue (Million) Forecast, by Application 2019 & 2032
- Table 26: Italy Pharmaceutical Excipients Market Volume (K Unit) Forecast, by Application 2019 & 2032
- Table 27: Spain Pharmaceutical Excipients Market Revenue (Million) Forecast, by Application 2019 & 2032
- Table 28: Spain Pharmaceutical Excipients Market Volume (K Unit) Forecast, by Application 2019 & 2032
- Table 29: Rest of Europe Pharmaceutical Excipients Market Revenue (Million) Forecast, by Application 2019 & 2032
- Table 30: Rest of Europe Pharmaceutical Excipients Market Volume (K Unit) Forecast, by Application 2019 & 2032
- Table 31: Global Pharmaceutical Excipients Market Revenue Million Forecast, by Country 2019 & 2032
- Table 32: Global Pharmaceutical Excipients Market Volume K Unit Forecast, by Country 2019 & 2032
- Table 33: China Pharmaceutical Excipients Market Revenue (Million) Forecast, by Application 2019 & 2032
- Table 34: China Pharmaceutical Excipients Market Volume (K Unit) Forecast, by Application 2019 & 2032
- Table 35: Japan Pharmaceutical Excipients Market Revenue (Million) Forecast, by Application 2019 & 2032
- Table 36: Japan Pharmaceutical Excipients Market Volume (K Unit) Forecast, by Application 2019 & 2032
- Table 37: India Pharmaceutical Excipients Market Revenue (Million) Forecast, by Application 2019 & 2032
- Table 38: India Pharmaceutical Excipients Market Volume (K Unit) Forecast, by Application 2019 & 2032
- Table 39: Australia Pharmaceutical Excipients Market Revenue (Million) Forecast, by Application 2019 & 2032
- Table 40: Australia Pharmaceutical Excipients Market Volume (K Unit) Forecast, by Application 2019 & 2032
- Table 41: South Korea Pharmaceutical Excipients Market Revenue (Million) Forecast, by Application 2019 & 2032
- Table 42: South Korea Pharmaceutical Excipients Market Volume (K Unit) Forecast, by Application 2019 & 2032
- Table 43: Rest of Asia Pacific Pharmaceutical Excipients Market Revenue (Million) Forecast, by Application 2019 & 2032
- Table 44: Rest of Asia Pacific Pharmaceutical Excipients Market Volume (K Unit) Forecast, by Application 2019 & 2032
- Table 45: Global Pharmaceutical Excipients Market Revenue Million Forecast, by Country 2019 & 2032
- Table 46: Global Pharmaceutical Excipients Market Volume K Unit Forecast, by Country 2019 & 2032
- Table 47: GCC Pharmaceutical Excipients Market Revenue (Million) Forecast, by Application 2019 & 2032
- Table 48: GCC Pharmaceutical Excipients Market Volume (K Unit) Forecast, by Application 2019 & 2032
- Table 49: South Africa Pharmaceutical Excipients Market Revenue (Million) Forecast, by Application 2019 & 2032
- Table 50: South Africa Pharmaceutical Excipients Market Volume (K Unit) Forecast, by Application 2019 & 2032
- Table 51: Rest of Middle East and Africa Pharmaceutical Excipients Market Revenue (Million) Forecast, by Application 2019 & 2032
- Table 52: Rest of Middle East and Africa Pharmaceutical Excipients Market Volume (K Unit) Forecast, by Application 2019 & 2032
- Table 53: Global Pharmaceutical Excipients Market Revenue Million Forecast, by Country 2019 & 2032
- Table 54: Global Pharmaceutical Excipients Market Volume K Unit Forecast, by Country 2019 & 2032
- Table 55: Brazil Pharmaceutical Excipients Market Revenue (Million) Forecast, by Application 2019 & 2032
- Table 56: Brazil Pharmaceutical Excipients Market Volume (K Unit) Forecast, by Application 2019 & 2032
- Table 57: Argentina Pharmaceutical Excipients Market Revenue (Million) Forecast, by Application 2019 & 2032
- Table 58: Argentina Pharmaceutical Excipients Market Volume (K Unit) Forecast, by Application 2019 & 2032
- Table 59: Rest of South America Pharmaceutical Excipients Market Revenue (Million) Forecast, by Application 2019 & 2032
- Table 60: Rest of South America Pharmaceutical Excipients Market Volume (K Unit) Forecast, by Application 2019 & 2032
- Table 61: Global Pharmaceutical Excipients Market Revenue Million Forecast, by Product 2019 & 2032
- Table 62: Global Pharmaceutical Excipients Market Volume K Unit Forecast, by Product 2019 & 2032
- Table 63: Global Pharmaceutical Excipients Market Revenue Million Forecast, by Functionality 2019 & 2032
- Table 64: Global Pharmaceutical Excipients Market Volume K Unit Forecast, by Functionality 2019 & 2032
- Table 65: Global Pharmaceutical Excipients Market Revenue Million Forecast, by Country 2019 & 2032
- Table 66: Global Pharmaceutical Excipients Market Volume K Unit Forecast, by Country 2019 & 2032
- Table 67: United States Pharmaceutical Excipients Market Revenue (Million) Forecast, by Application 2019 & 2032
- Table 68: United States Pharmaceutical Excipients Market Volume (K Unit) Forecast, by Application 2019 & 2032
- Table 69: Canada Pharmaceutical Excipients Market Revenue (Million) Forecast, by Application 2019 & 2032
- Table 70: Canada Pharmaceutical Excipients Market Volume (K Unit) Forecast, by Application 2019 & 2032
- Table 71: Mexico Pharmaceutical Excipients Market Revenue (Million) Forecast, by Application 2019 & 2032
- Table 72: Mexico Pharmaceutical Excipients Market Volume (K Unit) Forecast, by Application 2019 & 2032
- Table 73: Global Pharmaceutical Excipients Market Revenue Million Forecast, by Product 2019 & 2032
- Table 74: Global Pharmaceutical Excipients Market Volume K Unit Forecast, by Product 2019 & 2032
- Table 75: Global Pharmaceutical Excipients Market Revenue Million Forecast, by Functionality 2019 & 2032
- Table 76: Global Pharmaceutical Excipients Market Volume K Unit Forecast, by Functionality 2019 & 2032
- Table 77: Global Pharmaceutical Excipients Market Revenue Million Forecast, by Country 2019 & 2032
- Table 78: Global Pharmaceutical Excipients Market Volume K Unit Forecast, by Country 2019 & 2032
- Table 79: Germany Pharmaceutical Excipients Market Revenue (Million) Forecast, by Application 2019 & 2032
- Table 80: Germany Pharmaceutical Excipients Market Volume (K Unit) Forecast, by Application 2019 & 2032
- Table 81: United Kingdom Pharmaceutical Excipients Market Revenue (Million) Forecast, by Application 2019 & 2032
- Table 82: United Kingdom Pharmaceutical Excipients Market Volume (K Unit) Forecast, by Application 2019 & 2032
- Table 83: France Pharmaceutical Excipients Market Revenue (Million) Forecast, by Application 2019 & 2032
- Table 84: France Pharmaceutical Excipients Market Volume (K Unit) Forecast, by Application 2019 & 2032
- Table 85: Italy Pharmaceutical Excipients Market Revenue (Million) Forecast, by Application 2019 & 2032
- Table 86: Italy Pharmaceutical Excipients Market Volume (K Unit) Forecast, by Application 2019 & 2032
- Table 87: Spain Pharmaceutical Excipients Market Revenue (Million) Forecast, by Application 2019 & 2032
- Table 88: Spain Pharmaceutical Excipients Market Volume (K Unit) Forecast, by Application 2019 & 2032
- Table 89: Rest of Europe Pharmaceutical Excipients Market Revenue (Million) Forecast, by Application 2019 & 2032
- Table 90: Rest of Europe Pharmaceutical Excipients Market Volume (K Unit) Forecast, by Application 2019 & 2032
- Table 91: Global Pharmaceutical Excipients Market Revenue Million Forecast, by Product 2019 & 2032
- Table 92: Global Pharmaceutical Excipients Market Volume K Unit Forecast, by Product 2019 & 2032
- Table 93: Global Pharmaceutical Excipients Market Revenue Million Forecast, by Functionality 2019 & 2032
- Table 94: Global Pharmaceutical Excipients Market Volume K Unit Forecast, by Functionality 2019 & 2032
- Table 95: Global Pharmaceutical Excipients Market Revenue Million Forecast, by Country 2019 & 2032
- Table 96: Global Pharmaceutical Excipients Market Volume K Unit Forecast, by Country 2019 & 2032
- Table 97: China Pharmaceutical Excipients Market Revenue (Million) Forecast, by Application 2019 & 2032
- Table 98: China Pharmaceutical Excipients Market Volume (K Unit) Forecast, by Application 2019 & 2032
- Table 99: Japan Pharmaceutical Excipients Market Revenue (Million) Forecast, by Application 2019 & 2032
- Table 100: Japan Pharmaceutical Excipients Market Volume (K Unit) Forecast, by Application 2019 & 2032
- Table 101: India Pharmaceutical Excipients Market Revenue (Million) Forecast, by Application 2019 & 2032
- Table 102: India Pharmaceutical Excipients Market Volume (K Unit) Forecast, by Application 2019 & 2032
- Table 103: Australia Pharmaceutical Excipients Market Revenue (Million) Forecast, by Application 2019 & 2032
- Table 104: Australia Pharmaceutical Excipients Market Volume (K Unit) Forecast, by Application 2019 & 2032
- Table 105: South Korea Pharmaceutical Excipients Market Revenue (Million) Forecast, by Application 2019 & 2032
- Table 106: South Korea Pharmaceutical Excipients Market Volume (K Unit) Forecast, by Application 2019 & 2032
- Table 107: Rest of Asia Pacific Pharmaceutical Excipients Market Revenue (Million) Forecast, by Application 2019 & 2032
- Table 108: Rest of Asia Pacific Pharmaceutical Excipients Market Volume (K Unit) Forecast, by Application 2019 & 2032
- Table 109: Global Pharmaceutical Excipients Market Revenue Million Forecast, by Product 2019 & 2032
- Table 110: Global Pharmaceutical Excipients Market Volume K Unit Forecast, by Product 2019 & 2032
- Table 111: Global Pharmaceutical Excipients Market Revenue Million Forecast, by Functionality 2019 & 2032
- Table 112: Global Pharmaceutical Excipients Market Volume K Unit Forecast, by Functionality 2019 & 2032
- Table 113: Global Pharmaceutical Excipients Market Revenue Million Forecast, by Country 2019 & 2032
- Table 114: Global Pharmaceutical Excipients Market Volume K Unit Forecast, by Country 2019 & 2032
- Table 115: GCC Pharmaceutical Excipients Market Revenue (Million) Forecast, by Application 2019 & 2032
- Table 116: GCC Pharmaceutical Excipients Market Volume (K Unit) Forecast, by Application 2019 & 2032
- Table 117: South Africa Pharmaceutical Excipients Market Revenue (Million) Forecast, by Application 2019 & 2032
- Table 118: South Africa Pharmaceutical Excipients Market Volume (K Unit) Forecast, by Application 2019 & 2032
- Table 119: Rest of Middle East and Africa Pharmaceutical Excipients Market Revenue (Million) Forecast, by Application 2019 & 2032
- Table 120: Rest of Middle East and Africa Pharmaceutical Excipients Market Volume (K Unit) Forecast, by Application 2019 & 2032
- Table 121: Global Pharmaceutical Excipients Market Revenue Million Forecast, by Product 2019 & 2032
- Table 122: Global Pharmaceutical Excipients Market Volume K Unit Forecast, by Product 2019 & 2032
- Table 123: Global Pharmaceutical Excipients Market Revenue Million Forecast, by Functionality 2019 & 2032
- Table 124: Global Pharmaceutical Excipients Market Volume K Unit Forecast, by Functionality 2019 & 2032
- Table 125: Global Pharmaceutical Excipients Market Revenue Million Forecast, by Country 2019 & 2032
- Table 126: Global Pharmaceutical Excipients Market Volume K Unit Forecast, by Country 2019 & 2032
- Table 127: Brazil Pharmaceutical Excipients Market Revenue (Million) Forecast, by Application 2019 & 2032
- Table 128: Brazil Pharmaceutical Excipients Market Volume (K Unit) Forecast, by Application 2019 & 2032
- Table 129: Argentina Pharmaceutical Excipients Market Revenue (Million) Forecast, by Application 2019 & 2032
- Table 130: Argentina Pharmaceutical Excipients Market Volume (K Unit) Forecast, by Application 2019 & 2032
- Table 131: Rest of South America Pharmaceutical Excipients Market Revenue (Million) Forecast, by Application 2019 & 2032
- Table 132: Rest of South America Pharmaceutical Excipients Market Volume (K Unit) Forecast, by Application 2019 & 2032
Frequently Asked Questions
1. What is the projected Compound Annual Growth Rate (CAGR) of the Pharmaceutical Excipients Market?
The projected CAGR is approximately 7.93%.
2. Which companies are prominent players in the Pharmaceutical Excipients Market?
Key companies in the market include Innophos, Evonik Industries AG (RAG-Stiftung), Archer Daniels Midland Company, Croda International PLC, Ashland, BASF SE, Air Liquide group, Roquette Frères, DuPont, The Lubrizol Corporation, Associated British Foods PLC, Kerry.
3. What are the main segments of the Pharmaceutical Excipients Market?
The market segments include Product, Functionality.
4. Can you provide details about the market size?
The market size is estimated to be USD 9.94 Million as of 2022.
5. What are some drivers contributing to market growth?
Increasing Demand for Functionality Excipients; Recent Patents Expiries Driving the Demand for Pharmaceutical Excipients; Rapid Advancements in Nanotechnology.
6. What are the notable trends driving market growth?
Binders Segment is Expected to Show a Significant Growth Over the Forecast Period.
7. Are there any restraints impacting market growth?
Lack of Proper Approval Process; Adverse Reactions of Excipients and Contamination in Formulations.
8. Can you provide examples of recent developments in the market?
October 2023: Clariant, a sustainability-focused specialty chemicals company, launched its portfolio of high-performing pharmaceutical ingredient solutions to support the evolution of safe and effective medicines. Also, Clariant Health Care expanded its range of functional excipients to solve active pharmaceutical ingredient (API) delivery & bioavailability challenges.
9. What pricing options are available for accessing the report?
Pricing options include single-user, multi-user, and enterprise licenses priced at USD 4750, USD 5250, and USD 8750 respectively.
10. Is the market size provided in terms of value or volume?
The market size is provided in terms of value, measured in Million and volume, measured in K Unit.
11. Are there any specific market keywords associated with the report?
Yes, the market keyword associated with the report is "Pharmaceutical Excipients Market," which aids in identifying and referencing the specific market segment covered.
12. How do I determine which pricing option suits my needs best?
The pricing options vary based on user requirements and access needs. Individual users may opt for single-user licenses, while businesses requiring broader access may choose multi-user or enterprise licenses for cost-effective access to the report.
13. Are there any additional resources or data provided in the Pharmaceutical Excipients Market report?
While the report offers comprehensive insights, it's advisable to review the specific contents or supplementary materials provided to ascertain if additional resources or data are available.
14. How can I stay updated on further developments or reports in the Pharmaceutical Excipients Market?
To stay informed about further developments, trends, and reports in the Pharmaceutical Excipients Market, consider subscribing to industry newsletters, following relevant companies and organizations, or regularly checking reputable industry news sources and publications.
Methodology
Step 1 - Identification of Relevant Samples Size from Population Database


Step 2 - Approaches for Defining Global Market Size (Value, Volume* & Price*)

Note*: In applicable scenarios
Step 3 - Data Sources
Primary Research
- Web Analytics
- Survey Reports
- Research Institute
- Latest Research Reports
- Opinion Leaders
Secondary Research
- Annual Reports
- White Paper
- Latest Press Release
- Industry Association
- Paid Database
- Investor Presentations

Step 4 - Data Triangulation
Involves using different sources of information in order to increase the validity of a study
These sources are likely to be stakeholders in a program - participants, other researchers, program staff, other community members, and so on.
Then we put all data in single framework & apply various statistical tools to find out the dynamic on the market.
During the analysis stage, feedback from the stakeholder groups would be compared to determine areas of agreement as well as areas of divergence


