

Key Insights
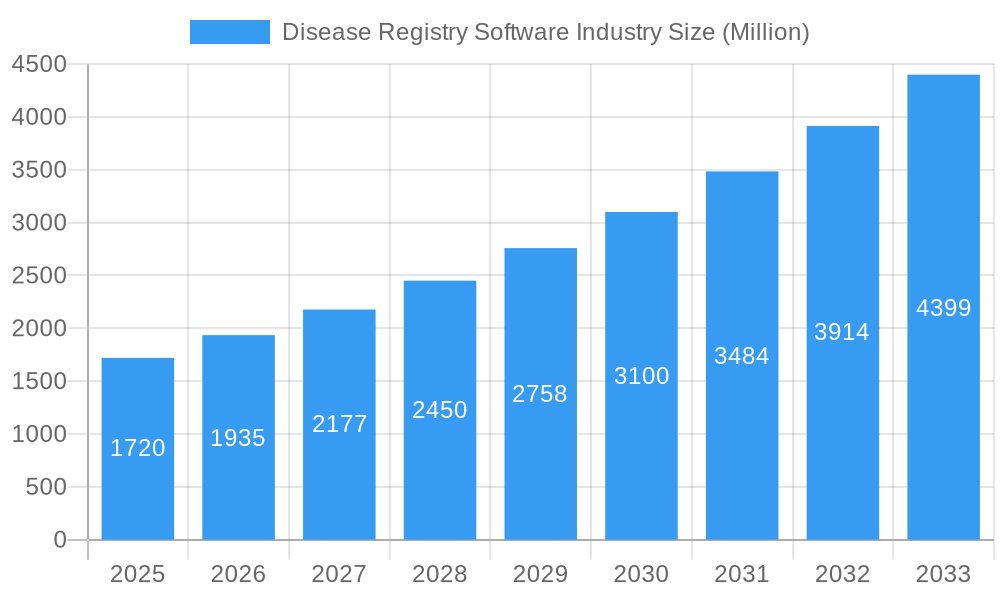
The global Disease Registry Software market is poised for significant expansion, projected to reach a market size of USD 1.72 billion with a robust Compound Annual Growth Rate (CAGR) of 12.53% during the forecast period of 2025-2033. This impressive growth is propelled by an increasing emphasis on data-driven healthcare, the rising prevalence of chronic diseases, and the growing need for effective patient cohort management and research. Disease Registries are becoming indispensable tools for tracking disease patterns, monitoring treatment outcomes, and informing public health policies. The demand for integrated software solutions is expected to rise as healthcare organizations seek seamless data flow and interoperability to enhance efficiency and analytical capabilities. Hospitals and pharmaceutical companies are leading the adoption of these advanced software solutions, driven by the imperative to improve patient care, streamline clinical trials, and meet regulatory compliance.
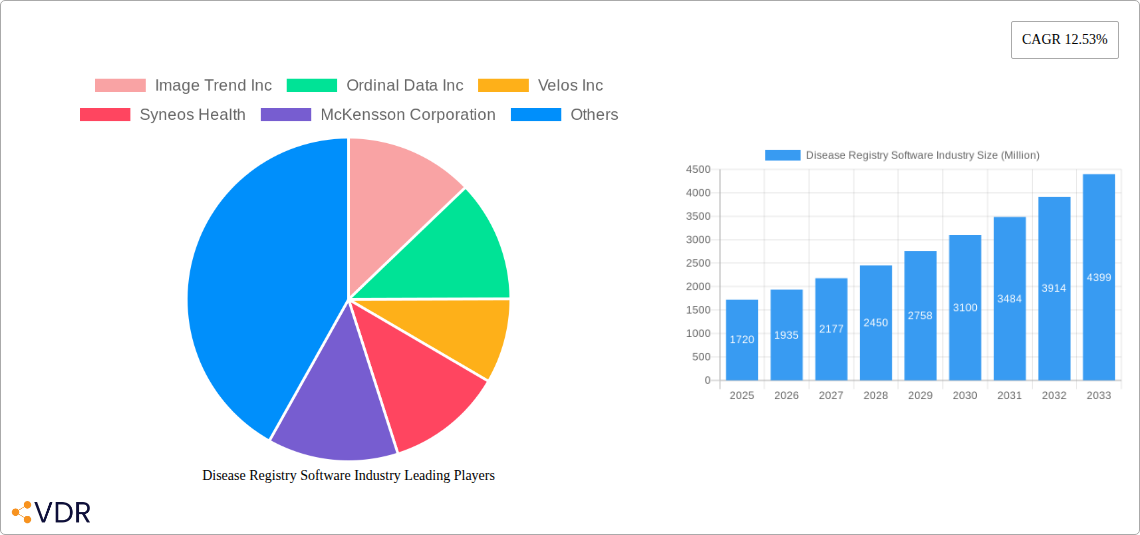
Disease Registry Software Industry Market Size (In Billion)
The market's trajectory is further bolstered by a growing awareness of the importance of real-world evidence (RWE) in drug development and post-market surveillance. The ability of disease registry software to collect, analyze, and report on vast amounts of patient data makes it a critical asset for researchers and healthcare providers alike. Key market drivers include the increasing adoption of electronic health records (EHRs), advancements in data analytics and AI, and government initiatives promoting data standardization and sharing. While the market is characterized by strong growth, potential restraints such as data security concerns and the high cost of implementation for smaller organizations need to be addressed. However, the overwhelming benefits in terms of improved public health, enhanced research capabilities, and personalized medicine are expected to outweigh these challenges, ensuring sustained market expansion across all major regions, with North America and Europe currently leading in adoption.
Disease Registry Software Industry Company Market Share
Unlocking Insights: The Comprehensive Disease Registry Software Industry Report (2019-2033)
This in-depth report provides a strategic overview of the global Disease Registry Software industry, offering critical insights for stakeholders navigating this dynamic market. Covering the historical period from 2019 to 2024 and projecting future growth through 2033, with a base and estimated year of 2025, this analysis dissects market trends, technological advancements, competitive landscapes, and emerging opportunities. We delve into the parent and child market segments, providing a granular understanding of drivers, barriers, and the strategic imperatives for success. This report is essential for healthcare providers, pharmaceutical companies, government agencies, software developers, and investors seeking to capitalize on the expanding disease registry ecosystem. The total market size for Disease Registry Software is projected to reach $6,700 Million by 2025 and is expected to grow at a Compound Annual Growth Rate (CAGR) of 12.5% during the forecast period (2025-2033), reaching approximately $16,300 Million by 2033.
Disease Registry Software Industry Market Dynamics & Structure
The Disease Registry Software industry is characterized by a moderately concentrated market, driven by continuous technological innovation and increasingly stringent regulatory frameworks. Key drivers include the growing emphasis on data-driven healthcare decision-making, the need for improved patient outcomes, and advancements in data analytics and artificial intelligence. Barriers to entry are moderate, stemming from the complex integration requirements with existing healthcare IT infrastructure and the need for specialized expertise in data privacy and security. Competitive product substitutes, while present in fragmented forms, are increasingly being consolidated by comprehensive registry solutions. End-user demographics are diverse, with hospitals and pharmaceutical companies being the primary adopters. Mergers and acquisitions (M&A) are an active trend, aimed at consolidating market share and expanding product portfolios. For instance, the number of M&A deals in the healthcare IT sector, specifically those involving data management and analytics, has seen a steady increase, with an estimated xx deals in 2023, up from xx in 2022. This consolidation is driven by the desire for integrated solutions that can handle the complexity of real-world evidence generation.
- Market Concentration: Moderately concentrated, with a few key players holding significant market share, but with room for specialized and emerging vendors.
- Technological Innovation Drivers: AI/ML for predictive analytics, cloud-based solutions for scalability, enhanced data security features, interoperability standards, and real-time data access.
- Regulatory Frameworks: HIPAA, GDPR, and country-specific health data regulations are crucial for compliance and drive the need for robust data governance features.
- Competitive Product Substitutes: Fragmented Electronic Health Record (EHR) functionalities, manual data collection methods, and basic data warehousing solutions.
- End-User Demographics: Hospitals (35% market share), Pharmaceutical Companies (30% market share), Government Agencies (20% market share), and Research Institutions/Other (15% market share).
- M&A Trends: Increasing consolidation as larger players acquire niche providers to expand capabilities and market reach. Estimated xx M&A transactions in the last two years.
Disease Registry Software Industry Growth Trends & Insights
The Disease Registry Software market is experiencing robust growth, fueled by an escalating demand for real-world evidence (RWE) in clinical research, drug development, and public health initiatives. The market size is evolving rapidly, driven by increasing adoption rates across healthcare organizations and pharmaceutical giants. Technological disruptions, such as the integration of artificial intelligence and machine learning for predictive analytics and personalized medicine, are fundamentally reshaping the landscape. Consumer behavior shifts, particularly the growing emphasis on patient-centric care and data transparency, are also influencing the adoption of advanced registry solutions. The market penetration of specialized disease registry software is expected to reach xx% by 2025, up from xx% in 2019.
The projected CAGR of 12.5% from 2025 to 2033 underscores the significant growth trajectory. This expansion is intrinsically linked to the increasing complexity of diseases and the need for detailed, longitudinal data to understand disease progression, treatment efficacy, and patient outcomes. The digital transformation within the healthcare sector further accelerates this trend, as organizations increasingly invest in sophisticated data management tools. The ability of registry software to facilitate comparative effectiveness research, post-market surveillance, and the identification of unmet medical needs makes it an indispensable asset for pharmaceutical companies seeking to optimize drug development pipelines and demonstrate value to payers and regulatory bodies.
Furthermore, the growing focus on rare diseases and the need for specialized patient cohorts for research are driving the demand for niche disease registries. Cloud-based solutions are gaining prominence due to their scalability, accessibility, and cost-effectiveness, enabling smaller research institutions and patient advocacy groups to establish and manage their own registries. The integration of genomics and other molecular data into disease registries is another emerging trend that promises to unlock deeper insights into disease mechanisms and therapeutic targets. The evolving regulatory landscape, with increasing demands for data-driven evidence, also compels organizations to invest in robust registry solutions that ensure data integrity, security, and compliance. The overall market sentiment is highly optimistic, with continuous innovation and expanding applications paving the way for sustained growth.
Dominant Regions, Countries, or Segments in Disease Registry Software Industry
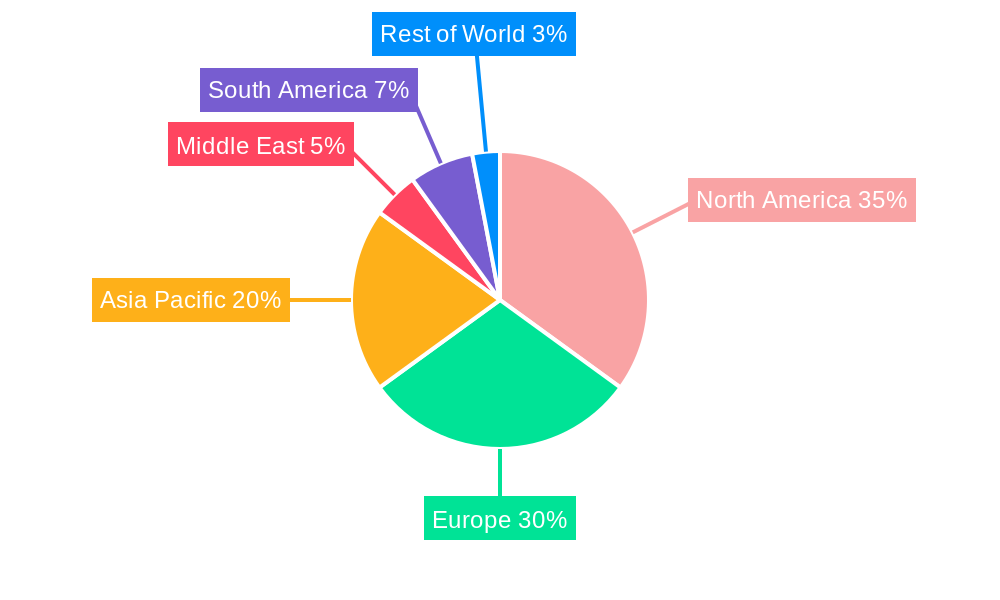
North America, particularly the United States, is currently the dominant region in the Disease Registry Software industry, driven by a mature healthcare infrastructure, significant investment in R&D, and a strong emphasis on data-driven healthcare. The country’s advanced technological adoption, coupled with a proactive regulatory environment that encourages real-world data utilization, has positioned it as a leader. The market share for Disease Registry Software in North America stands at approximately 45%, with substantial contributions from integrated software solutions and disease registries.
- Dominant Segment: Disease Registries: This segment, representing approximately 60% of the total market, is the primary driver of growth. It encompasses registries for chronic diseases, cancer, rare diseases, and infectious diseases, crucial for research, surveillance, and patient management.
- Dominant Software Type: Integrated Software: With a market share of roughly 70%, integrated software solutions are preferred for their ability to seamlessly connect with existing hospital information systems (HIS) and electronic health records (EHRs), offering a comprehensive data management platform. Stand-alone software holds a 30% market share, often serving niche or specific research needs.
- Dominant End User: Hospitals: Hospitals account for the largest share of end-users, estimated at 35%, due to their direct involvement in patient care and their role as primary data sources for various registries. Pharmaceutical companies follow closely with a 30% market share, leveraging registries for clinical trial support and post-market surveillance. Government agencies and research institutions constitute the remaining segments, contributing 20% and 15% respectively.
- Key Drivers in North America:
- Economic Policies: Government initiatives promoting health data exchange and RWE utilization.
- Infrastructure: Advanced healthcare IT infrastructure and widespread adoption of EHRs.
- Research Ecosystem: Robust academic and pharmaceutical research environment driving demand for data.
- Patient Advocacy: Strong patient advocacy groups driving the establishment of disease-specific registries.
Europe follows North America, with a market share of approximately 30%, driven by countries like Germany, the UK, and France, which are actively investing in digital health and RWE research. Asia Pacific is emerging as a high-growth region, with a growing market share of 20%, fueled by increasing healthcare expenditure, a rising prevalence of chronic diseases, and government support for digitalization in healthcare. Key drivers in these regions include government funding for public health initiatives, the increasing adoption of telemedicine, and a growing awareness of the importance of data analytics in improving healthcare outcomes.
Disease Registry Software Industry Product Landscape
The product landscape of the Disease Registry Software industry is characterized by increasing sophistication and specialization. Vendors are focusing on developing platforms that offer robust data collection, management, and analysis capabilities. Innovations include AI-powered predictive analytics for early disease detection and risk stratification, advanced visualization tools for interpreting complex datasets, and enhanced security features to ensure compliance with global data privacy regulations. Unique selling propositions often revolve around seamless integration with existing healthcare IT infrastructure, user-friendly interfaces, and the ability to support diverse registry types, from specific disease conditions to product registries. Technological advancements are also enabling real-time data synchronization, facilitating quicker insights for researchers and clinicians.
Key Drivers, Barriers & Challenges in Disease Registry Software Industry
The Disease Registry Software industry is propelled by several key drivers. The escalating demand for real-world evidence (RWE) to support drug development, clinical decision-making, and regulatory submissions is a primary catalyst. Technological advancements in data analytics, artificial intelligence, and cloud computing are enabling more sophisticated and scalable registry solutions. Government initiatives promoting data interoperability and the use of patient data for public health research also play a significant role.
However, the industry faces notable barriers and challenges. High implementation costs and the complexity of integrating with diverse legacy healthcare IT systems remain significant hurdles for many organizations. Stringent data privacy and security regulations, while essential, can also create compliance burdens and data access limitations. The lack of standardized data formats across different healthcare providers can lead to data quality issues and hinder interoperability. Competitive pressures from established EHR vendors offering basic registry functionalities and the need for specialized expertise in data science and registry management also pose challenges.
Emerging Opportunities in Disease Registry Software Industry
Emerging opportunities in the Disease Registry Software industry lie in the growing demand for patient-powered registries and the integration of genomic and wearable device data. The expansion of registries into emerging markets in Asia Pacific and Latin America presents a significant untapped market. Innovative applications include leveraging AI for predictive modeling of disease outbreaks, personalizing treatment plans based on individual patient data, and supporting clinical trial recruitment for rare diseases. Evolving consumer preferences for data ownership and transparency are also creating opportunities for patient-centric registry platforms.
Growth Accelerators in the Disease Registry Software Industry Industry
Several growth accelerators are poised to fuel the long-term expansion of the Disease Registry Software industry. Technological breakthroughs, such as blockchain for secure data sharing and advanced AI algorithms for personalized medicine, will unlock new capabilities. Strategic partnerships between software vendors, pharmaceutical companies, and academic institutions will foster collaborative research and development, driving innovation and market penetration. Market expansion strategies, including targeting underserved disease areas and geographical regions, will further broaden the industry's reach.
Key Players Shaping the Disease Registry Software Industry Market
Image Trend Inc Ordinal Data Inc Velos Inc Syneos Health McKensson Corporation Cerner Corporation IQVIA Dacima Software Inc Global Vision Technologies Inc FIGmd Inc IBM ArborMetrix
Notable Milestones in Disease Registry Software Industry Sector
- April 2022: Quantori, LLC launched a Registry Science Practice, focusing on the creation of registry programs for patients, clinicians, and researchers, enhancing the comprehensive support available for registry initiatives.
- January 2022: Seqster partnered with the National Pancreas Foundation (NPF) to create the nation's largest dynamic pancreatic patient disease database. This collaboration aims to accelerate cutting-edge research by providing faster access to comprehensive patient data than traditional methods.
In-Depth Disease Registry Software Industry Market Outlook
The future outlook for the Disease Registry Software industry is exceptionally bright, driven by the increasing reliance on real-world data for healthcare innovation and policy development. Growth accelerators such as advanced analytics, AI integration, and the expansion of cloud-based solutions will continue to shape the market. Strategic opportunities abound in personalized medicine, rare disease research, and the development of integrated platforms that bridge clinical care and research seamlessly. The industry is poised for sustained expansion as organizations worldwide recognize the indispensable value of robust disease registries in improving patient outcomes and advancing medical knowledge.
Disease Registry Software Industry Segmentation
-
1. Type of Registry
- 1.1. Disease Registries
- 1.2. Health Service Registries
- 1.3. Product Registries
-
2. Type of Software
- 2.1. Stand-alone Software
- 2.2. Integrated Software
-
3. End User
- 3.1. Hospitals
- 3.2. Governme
- 3.3. Pharmace
- 3.4. Other End Users
Disease Registry Software Industry Segmentation By Geography
-
1. North America
- 1.1. United States
- 1.2. Canada
- 1.3. Mexico
-
2. Europe
- 2.1. Germany
- 2.2. United Kingdom
- 2.3. France
- 2.4. Italy
- 2.5. Spain
- 2.6. Rest of Europe
-
3. Asia Pacific
- 3.1. China
- 3.2. Japan
- 3.3. India
- 3.4. Australia
- 3.5. South korea
- 3.6. Rest of Asia Pacific
- 4. Middle East
-
5. GCC
- 5.1. South Africa
- 5.2. Rest of Middle East
-
6. South America
- 6.1. Brazil
- 6.2. Argentina
- 6.3. Rest of South America
Disease Registry Software Industry Regional Market Share
Geographic Coverage of Disease Registry Software Industry
Disease Registry Software Industry REPORT HIGHLIGHTS
| Aspects | Details |
|---|---|
| Study Period | 2020-2034 |
| Base Year | 2025 |
| Estimated Year | 2026 |
| Forecast Period | 2026-2034 |
| Historical Period | 2020-2025 |
| Growth Rate | CAGR of 12.53% from 2020-2034 |
| Segmentation |
|
Table of Contents
- 1. Introduction
- 1.1. Research Scope
- 1.2. Market Segmentation
- 1.3. Research Objective
- 1.4. Definitions and Assumptions
- 2. Executive Summary
- 2.1. Market Snapshot
- 3. Market Dynamics
- 3.1. Market Drivers
- 3.2. Market Restrains
- 3.3. Market Trends
- 3.4. Market Opportunities
- 4. Market Factor Analysis
- 4.1. Porters Five Forces
- 4.1.1. Bargaining Power of Suppliers
- 4.1.2. Bargaining Power of Buyers
- 4.1.3. Threat of New Entrants
- 4.1.4. Threat of Substitutes
- 4.1.5. Competitive Rivalry
- 4.2. PESTEL analysis
- 4.3. BCG Analysis
- 4.3.1. Stars (High Growth, High Market Share)
- 4.3.2. Cash Cows (Low Growth, High Market Share)
- 4.3.3. Question Mark (High Growth, Low Market Share)
- 4.3.4. Dogs (Low Growth, Low Market Share)
- 4.4. Ansoff Matrix Analysis
- 4.5. Supply Chain Analysis
- 4.6. Regulatory Landscape
- 4.7. Current Market Potential and Opportunity Assessment (TAM–SAM–SOM Framework)
- 4.8. VDR Analyst Note
- 4.1. Porters Five Forces
- 5. Market Analysis, Insights and Forecast 2021-2033
- 5.1. Market Analysis, Insights and Forecast - by Type of Registry
- 5.1.1. Disease Registries
- 5.1.2. Health Service Registries
- 5.1.3. Product Registries
- 5.2. Market Analysis, Insights and Forecast - by Type of Software
- 5.2.1. Stand-alone Software
- 5.2.2. Integrated Software
- 5.3. Market Analysis, Insights and Forecast - by End User
- 5.3.1. Hospitals
- 5.3.2. Governme
- 5.3.3. Pharmace
- 5.3.4. Other End Users
- 5.4. Market Analysis, Insights and Forecast - by Region
- 5.4.1. North America
- 5.4.2. Europe
- 5.4.3. Asia Pacific
- 5.4.4. Middle East
- 5.4.5. GCC
- 5.4.6. South America
- 5.1. Market Analysis, Insights and Forecast - by Type of Registry
- 6. Global Disease Registry Software Industry Analysis, Insights and Forecast, 2021-2033
- 6.1. Market Analysis, Insights and Forecast - by Type of Registry
- 6.1.1. Disease Registries
- 6.1.2. Health Service Registries
- 6.1.3. Product Registries
- 6.2. Market Analysis, Insights and Forecast - by Type of Software
- 6.2.1. Stand-alone Software
- 6.2.2. Integrated Software
- 6.3. Market Analysis, Insights and Forecast - by End User
- 6.3.1. Hospitals
- 6.3.2. Governme
- 6.3.3. Pharmace
- 6.3.4. Other End Users
- 6.1. Market Analysis, Insights and Forecast - by Type of Registry
- 7. North America Disease Registry Software Industry Analysis, Insights and Forecast, 2021-2033
- 7.1. Market Analysis, Insights and Forecast - by Type of Registry
- 7.1.1. Disease Registries
- 7.1.2. Health Service Registries
- 7.1.3. Product Registries
- 7.2. Market Analysis, Insights and Forecast - by Type of Software
- 7.2.1. Stand-alone Software
- 7.2.2. Integrated Software
- 7.3. Market Analysis, Insights and Forecast - by End User
- 7.3.1. Hospitals
- 7.3.2. Governme
- 7.3.3. Pharmace
- 7.3.4. Other End Users
- 7.1. Market Analysis, Insights and Forecast - by Type of Registry
- 8. Europe Disease Registry Software Industry Analysis, Insights and Forecast, 2021-2033
- 8.1. Market Analysis, Insights and Forecast - by Type of Registry
- 8.1.1. Disease Registries
- 8.1.2. Health Service Registries
- 8.1.3. Product Registries
- 8.2. Market Analysis, Insights and Forecast - by Type of Software
- 8.2.1. Stand-alone Software
- 8.2.2. Integrated Software
- 8.3. Market Analysis, Insights and Forecast - by End User
- 8.3.1. Hospitals
- 8.3.2. Governme
- 8.3.3. Pharmace
- 8.3.4. Other End Users
- 8.1. Market Analysis, Insights and Forecast - by Type of Registry
- 9. Asia Pacific Disease Registry Software Industry Analysis, Insights and Forecast, 2021-2033
- 9.1. Market Analysis, Insights and Forecast - by Type of Registry
- 9.1.1. Disease Registries
- 9.1.2. Health Service Registries
- 9.1.3. Product Registries
- 9.2. Market Analysis, Insights and Forecast - by Type of Software
- 9.2.1. Stand-alone Software
- 9.2.2. Integrated Software
- 9.3. Market Analysis, Insights and Forecast - by End User
- 9.3.1. Hospitals
- 9.3.2. Governme
- 9.3.3. Pharmace
- 9.3.4. Other End Users
- 9.1. Market Analysis, Insights and Forecast - by Type of Registry
- 10. Middle East Disease Registry Software Industry Analysis, Insights and Forecast, 2021-2033
- 10.1. Market Analysis, Insights and Forecast - by Type of Registry
- 10.1.1. Disease Registries
- 10.1.2. Health Service Registries
- 10.1.3. Product Registries
- 10.2. Market Analysis, Insights and Forecast - by Type of Software
- 10.2.1. Stand-alone Software
- 10.2.2. Integrated Software
- 10.3. Market Analysis, Insights and Forecast - by End User
- 10.3.1. Hospitals
- 10.3.2. Governme
- 10.3.3. Pharmace
- 10.3.4. Other End Users
- 10.1. Market Analysis, Insights and Forecast - by Type of Registry
- 11. GCC Disease Registry Software Industry Analysis, Insights and Forecast, 2021-2033
- 11.1. Market Analysis, Insights and Forecast - by Type of Registry
- 11.1.1. Disease Registries
- 11.1.2. Health Service Registries
- 11.1.3. Product Registries
- 11.2. Market Analysis, Insights and Forecast - by Type of Software
- 11.2.1. Stand-alone Software
- 11.2.2. Integrated Software
- 11.3. Market Analysis, Insights and Forecast - by End User
- 11.3.1. Hospitals
- 11.3.2. Governme
- 11.3.3. Pharmace
- 11.3.4. Other End Users
- 11.1. Market Analysis, Insights and Forecast - by Type of Registry
- 12. South America Disease Registry Software Industry Analysis, Insights and Forecast, 2021-2033
- 12.1. Market Analysis, Insights and Forecast - by Type of Registry
- 12.1.1. Disease Registries
- 12.1.2. Health Service Registries
- 12.1.3. Product Registries
- 12.2. Market Analysis, Insights and Forecast - by Type of Software
- 12.2.1. Stand-alone Software
- 12.2.2. Integrated Software
- 12.3. Market Analysis, Insights and Forecast - by End User
- 12.3.1. Hospitals
- 12.3.2. Governme
- 12.3.3. Pharmace
- 12.3.4. Other End Users
- 12.1. Market Analysis, Insights and Forecast - by Type of Registry
- 13. Competitive Analysis
- 13.1. Company Profiles
- 13.1.1 Image Trend Inc
- 13.1.1.1. Company Overview
- 13.1.1.2. Products
- 13.1.1.3. Company Financials
- 13.1.1.4. SWOT Analysis
- 13.1.2 Ordinal Data Inc
- 13.1.2.1. Company Overview
- 13.1.2.2. Products
- 13.1.2.3. Company Financials
- 13.1.2.4. SWOT Analysis
- 13.1.3 Velos Inc
- 13.1.3.1. Company Overview
- 13.1.3.2. Products
- 13.1.3.3. Company Financials
- 13.1.3.4. SWOT Analysis
- 13.1.4 Syneos Health
- 13.1.4.1. Company Overview
- 13.1.4.2. Products
- 13.1.4.3. Company Financials
- 13.1.4.4. SWOT Analysis
- 13.1.5 McKensson Corporation
- 13.1.5.1. Company Overview
- 13.1.5.2. Products
- 13.1.5.3. Company Financials
- 13.1.5.4. SWOT Analysis
- 13.1.6 Cerner Corporation
- 13.1.6.1. Company Overview
- 13.1.6.2. Products
- 13.1.6.3. Company Financials
- 13.1.6.4. SWOT Analysis
- 13.1.7 IQVIA
- 13.1.7.1. Company Overview
- 13.1.7.2. Products
- 13.1.7.3. Company Financials
- 13.1.7.4. SWOT Analysis
- 13.1.8 Dacima Software Inc
- 13.1.8.1. Company Overview
- 13.1.8.2. Products
- 13.1.8.3. Company Financials
- 13.1.8.4. SWOT Analysis
- 13.1.9 Global Vision Technologies Inc
- 13.1.9.1. Company Overview
- 13.1.9.2. Products
- 13.1.9.3. Company Financials
- 13.1.9.4. SWOT Analysis
- 13.1.10 FIGmd Inc
- 13.1.10.1. Company Overview
- 13.1.10.2. Products
- 13.1.10.3. Company Financials
- 13.1.10.4. SWOT Analysis
- 13.1.11 IBM
- 13.1.11.1. Company Overview
- 13.1.11.2. Products
- 13.1.11.3. Company Financials
- 13.1.11.4. SWOT Analysis
- 13.1.12 ArborMetrix
- 13.1.12.1. Company Overview
- 13.1.12.2. Products
- 13.1.12.3. Company Financials
- 13.1.12.4. SWOT Analysis
- 13.1.1 Image Trend Inc
- 13.2. Market Entropy
- 13.2.1 Company's Key Areas Served
- 13.2.2 Recent Developments
- 13.3. Company Market Share Analysis 2025
- 13.3.1 Top 5 Companies Market Share Analysis
- 13.3.2 Top 3 Companies Market Share Analysis
- 13.4. List of Potential Customers
- 14. Research Methodology
List of Figures
- Figure 1: Global Disease Registry Software Industry Revenue Breakdown (Million, %) by Region 2025 & 2033
- Figure 2: North America Disease Registry Software Industry Revenue (Million), by Type of Registry 2025 & 2033
- Figure 3: North America Disease Registry Software Industry Revenue Share (%), by Type of Registry 2025 & 2033
- Figure 4: North America Disease Registry Software Industry Revenue (Million), by Type of Software 2025 & 2033
- Figure 5: North America Disease Registry Software Industry Revenue Share (%), by Type of Software 2025 & 2033
- Figure 6: North America Disease Registry Software Industry Revenue (Million), by End User 2025 & 2033
- Figure 7: North America Disease Registry Software Industry Revenue Share (%), by End User 2025 & 2033
- Figure 8: North America Disease Registry Software Industry Revenue (Million), by Country 2025 & 2033
- Figure 9: North America Disease Registry Software Industry Revenue Share (%), by Country 2025 & 2033
- Figure 10: Europe Disease Registry Software Industry Revenue (Million), by Type of Registry 2025 & 2033
- Figure 11: Europe Disease Registry Software Industry Revenue Share (%), by Type of Registry 2025 & 2033
- Figure 12: Europe Disease Registry Software Industry Revenue (Million), by Type of Software 2025 & 2033
- Figure 13: Europe Disease Registry Software Industry Revenue Share (%), by Type of Software 2025 & 2033
- Figure 14: Europe Disease Registry Software Industry Revenue (Million), by End User 2025 & 2033
- Figure 15: Europe Disease Registry Software Industry Revenue Share (%), by End User 2025 & 2033
- Figure 16: Europe Disease Registry Software Industry Revenue (Million), by Country 2025 & 2033
- Figure 17: Europe Disease Registry Software Industry Revenue Share (%), by Country 2025 & 2033
- Figure 18: Asia Pacific Disease Registry Software Industry Revenue (Million), by Type of Registry 2025 & 2033
- Figure 19: Asia Pacific Disease Registry Software Industry Revenue Share (%), by Type of Registry 2025 & 2033
- Figure 20: Asia Pacific Disease Registry Software Industry Revenue (Million), by Type of Software 2025 & 2033
- Figure 21: Asia Pacific Disease Registry Software Industry Revenue Share (%), by Type of Software 2025 & 2033
- Figure 22: Asia Pacific Disease Registry Software Industry Revenue (Million), by End User 2025 & 2033
- Figure 23: Asia Pacific Disease Registry Software Industry Revenue Share (%), by End User 2025 & 2033
- Figure 24: Asia Pacific Disease Registry Software Industry Revenue (Million), by Country 2025 & 2033
- Figure 25: Asia Pacific Disease Registry Software Industry Revenue Share (%), by Country 2025 & 2033
- Figure 26: Middle East Disease Registry Software Industry Revenue (Million), by Type of Registry 2025 & 2033
- Figure 27: Middle East Disease Registry Software Industry Revenue Share (%), by Type of Registry 2025 & 2033
- Figure 28: Middle East Disease Registry Software Industry Revenue (Million), by Type of Software 2025 & 2033
- Figure 29: Middle East Disease Registry Software Industry Revenue Share (%), by Type of Software 2025 & 2033
- Figure 30: Middle East Disease Registry Software Industry Revenue (Million), by End User 2025 & 2033
- Figure 31: Middle East Disease Registry Software Industry Revenue Share (%), by End User 2025 & 2033
- Figure 32: Middle East Disease Registry Software Industry Revenue (Million), by Country 2025 & 2033
- Figure 33: Middle East Disease Registry Software Industry Revenue Share (%), by Country 2025 & 2033
- Figure 34: GCC Disease Registry Software Industry Revenue (Million), by Type of Registry 2025 & 2033
- Figure 35: GCC Disease Registry Software Industry Revenue Share (%), by Type of Registry 2025 & 2033
- Figure 36: GCC Disease Registry Software Industry Revenue (Million), by Type of Software 2025 & 2033
- Figure 37: GCC Disease Registry Software Industry Revenue Share (%), by Type of Software 2025 & 2033
- Figure 38: GCC Disease Registry Software Industry Revenue (Million), by End User 2025 & 2033
- Figure 39: GCC Disease Registry Software Industry Revenue Share (%), by End User 2025 & 2033
- Figure 40: GCC Disease Registry Software Industry Revenue (Million), by Country 2025 & 2033
- Figure 41: GCC Disease Registry Software Industry Revenue Share (%), by Country 2025 & 2033
- Figure 42: South America Disease Registry Software Industry Revenue (Million), by Type of Registry 2025 & 2033
- Figure 43: South America Disease Registry Software Industry Revenue Share (%), by Type of Registry 2025 & 2033
- Figure 44: South America Disease Registry Software Industry Revenue (Million), by Type of Software 2025 & 2033
- Figure 45: South America Disease Registry Software Industry Revenue Share (%), by Type of Software 2025 & 2033
- Figure 46: South America Disease Registry Software Industry Revenue (Million), by End User 2025 & 2033
- Figure 47: South America Disease Registry Software Industry Revenue Share (%), by End User 2025 & 2033
- Figure 48: South America Disease Registry Software Industry Revenue (Million), by Country 2025 & 2033
- Figure 49: South America Disease Registry Software Industry Revenue Share (%), by Country 2025 & 2033
List of Tables
- Table 1: Global Disease Registry Software Industry Revenue Million Forecast, by Type of Registry 2020 & 2033
- Table 2: Global Disease Registry Software Industry Revenue Million Forecast, by Type of Software 2020 & 2033
- Table 3: Global Disease Registry Software Industry Revenue Million Forecast, by End User 2020 & 2033
- Table 4: Global Disease Registry Software Industry Revenue Million Forecast, by Region 2020 & 2033
- Table 5: Global Disease Registry Software Industry Revenue Million Forecast, by Type of Registry 2020 & 2033
- Table 6: Global Disease Registry Software Industry Revenue Million Forecast, by Type of Software 2020 & 2033
- Table 7: Global Disease Registry Software Industry Revenue Million Forecast, by End User 2020 & 2033
- Table 8: Global Disease Registry Software Industry Revenue Million Forecast, by Country 2020 & 2033
- Table 9: United States Disease Registry Software Industry Revenue (Million) Forecast, by Application 2020 & 2033
- Table 10: Canada Disease Registry Software Industry Revenue (Million) Forecast, by Application 2020 & 2033
- Table 11: Mexico Disease Registry Software Industry Revenue (Million) Forecast, by Application 2020 & 2033
- Table 12: Global Disease Registry Software Industry Revenue Million Forecast, by Type of Registry 2020 & 2033
- Table 13: Global Disease Registry Software Industry Revenue Million Forecast, by Type of Software 2020 & 2033
- Table 14: Global Disease Registry Software Industry Revenue Million Forecast, by End User 2020 & 2033
- Table 15: Global Disease Registry Software Industry Revenue Million Forecast, by Country 2020 & 2033
- Table 16: Germany Disease Registry Software Industry Revenue (Million) Forecast, by Application 2020 & 2033
- Table 17: United Kingdom Disease Registry Software Industry Revenue (Million) Forecast, by Application 2020 & 2033
- Table 18: France Disease Registry Software Industry Revenue (Million) Forecast, by Application 2020 & 2033
- Table 19: Italy Disease Registry Software Industry Revenue (Million) Forecast, by Application 2020 & 2033
- Table 20: Spain Disease Registry Software Industry Revenue (Million) Forecast, by Application 2020 & 2033
- Table 21: Rest of Europe Disease Registry Software Industry Revenue (Million) Forecast, by Application 2020 & 2033
- Table 22: Global Disease Registry Software Industry Revenue Million Forecast, by Type of Registry 2020 & 2033
- Table 23: Global Disease Registry Software Industry Revenue Million Forecast, by Type of Software 2020 & 2033
- Table 24: Global Disease Registry Software Industry Revenue Million Forecast, by End User 2020 & 2033
- Table 25: Global Disease Registry Software Industry Revenue Million Forecast, by Country 2020 & 2033
- Table 26: China Disease Registry Software Industry Revenue (Million) Forecast, by Application 2020 & 2033
- Table 27: Japan Disease Registry Software Industry Revenue (Million) Forecast, by Application 2020 & 2033
- Table 28: India Disease Registry Software Industry Revenue (Million) Forecast, by Application 2020 & 2033
- Table 29: Australia Disease Registry Software Industry Revenue (Million) Forecast, by Application 2020 & 2033
- Table 30: South korea Disease Registry Software Industry Revenue (Million) Forecast, by Application 2020 & 2033
- Table 31: Rest of Asia Pacific Disease Registry Software Industry Revenue (Million) Forecast, by Application 2020 & 2033
- Table 32: Global Disease Registry Software Industry Revenue Million Forecast, by Type of Registry 2020 & 2033
- Table 33: Global Disease Registry Software Industry Revenue Million Forecast, by Type of Software 2020 & 2033
- Table 34: Global Disease Registry Software Industry Revenue Million Forecast, by End User 2020 & 2033
- Table 35: Global Disease Registry Software Industry Revenue Million Forecast, by Country 2020 & 2033
- Table 36: Global Disease Registry Software Industry Revenue Million Forecast, by Type of Registry 2020 & 2033
- Table 37: Global Disease Registry Software Industry Revenue Million Forecast, by Type of Software 2020 & 2033
- Table 38: Global Disease Registry Software Industry Revenue Million Forecast, by End User 2020 & 2033
- Table 39: Global Disease Registry Software Industry Revenue Million Forecast, by Country 2020 & 2033
- Table 40: South Africa Disease Registry Software Industry Revenue (Million) Forecast, by Application 2020 & 2033
- Table 41: Rest of Middle East Disease Registry Software Industry Revenue (Million) Forecast, by Application 2020 & 2033
- Table 42: Global Disease Registry Software Industry Revenue Million Forecast, by Type of Registry 2020 & 2033
- Table 43: Global Disease Registry Software Industry Revenue Million Forecast, by Type of Software 2020 & 2033
- Table 44: Global Disease Registry Software Industry Revenue Million Forecast, by End User 2020 & 2033
- Table 45: Global Disease Registry Software Industry Revenue Million Forecast, by Country 2020 & 2033
- Table 46: Brazil Disease Registry Software Industry Revenue (Million) Forecast, by Application 2020 & 2033
- Table 47: Argentina Disease Registry Software Industry Revenue (Million) Forecast, by Application 2020 & 2033
- Table 48: Rest of South America Disease Registry Software Industry Revenue (Million) Forecast, by Application 2020 & 2033
Frequently Asked Questions
1. What is the projected Compound Annual Growth Rate (CAGR) of the Disease Registry Software Industry?
The projected CAGR is approximately 12.53%.
2. Which companies are prominent players in the Disease Registry Software Industry?
Key companies in the market include Image Trend Inc, Ordinal Data Inc, Velos Inc, Syneos Health, McKensson Corporation, Cerner Corporation, IQVIA, Dacima Software Inc, Global Vision Technologies Inc, FIGmd Inc, IBM, ArborMetrix.
3. What are the main segments of the Disease Registry Software Industry?
The market segments include Type of Registry, Type of Software, End User.
4. Can you provide details about the market size?
The market size is estimated to be USD 1.72 Million as of 2022.
5. What are some drivers contributing to market growth?
Implementation of Government Initiatives to Build Patient Registries; Rising Adoption of Electronic Health Records (EHR); Increasing Use of Patient Registry Data for Post-marketing Surveillance.
6. What are the notable trends driving market growth?
Integrated Software Segment is is Expected to Hold a Major Market Share in the Patient Registry Software Market.
7. Are there any restraints impacting market growth?
Privacy and Data Security-related Concerns; Lack of Trained and Skilled Resources.
8. Can you provide examples of recent developments in the market?
In April 2022, Quantori, LLC launched a Registry Science Practice focusing on the creation of registry programs for patients, clinicians, and researchers.
9. What pricing options are available for accessing the report?
Pricing options include single-user, multi-user, and enterprise licenses priced at USD 4750, USD 5250, and USD 8750 respectively.
10. Is the market size provided in terms of value or volume?
The market size is provided in terms of value, measured in Million.
11. Are there any specific market keywords associated with the report?
Yes, the market keyword associated with the report is "Disease Registry Software Industry," which aids in identifying and referencing the specific market segment covered.
12. How do I determine which pricing option suits my needs best?
The pricing options vary based on user requirements and access needs. Individual users may opt for single-user licenses, while businesses requiring broader access may choose multi-user or enterprise licenses for cost-effective access to the report.
13. Are there any additional resources or data provided in the Disease Registry Software Industry report?
While the report offers comprehensive insights, it's advisable to review the specific contents or supplementary materials provided to ascertain if additional resources or data are available.
14. How can I stay updated on further developments or reports in the Disease Registry Software Industry?
To stay informed about further developments, trends, and reports in the Disease Registry Software Industry, consider subscribing to industry newsletters, following relevant companies and organizations, or regularly checking reputable industry news sources and publications.
Methodology
Step 1 - Identification of Relevant Samples Size from Population Database


Step 2 - Approaches for Defining Global Market Size (Value, Volume* & Price*)

Note*: In applicable scenarios
Step 3 - Data Sources
Primary Research
- Web Analytics
- Survey Reports
- Research Institute
- Latest Research Reports
- Opinion Leaders
Secondary Research
- Annual Reports
- White Paper
- Latest Press Release
- Industry Association
- Paid Database
- Investor Presentations

Step 4 - Data Triangulation
Involves using different sources of information in order to increase the validity of a study
These sources are likely to be stakeholders in a program - participants, other researchers, program staff, other community members, and so on.
Then we put all data in single framework & apply various statistical tools to find out the dynamic on the market.
During the analysis stage, feedback from the stakeholder groups would be compared to determine areas of agreement as well as areas of divergence