

Key Insights
The global blood coagulants market is projected for substantial growth, reaching an estimated
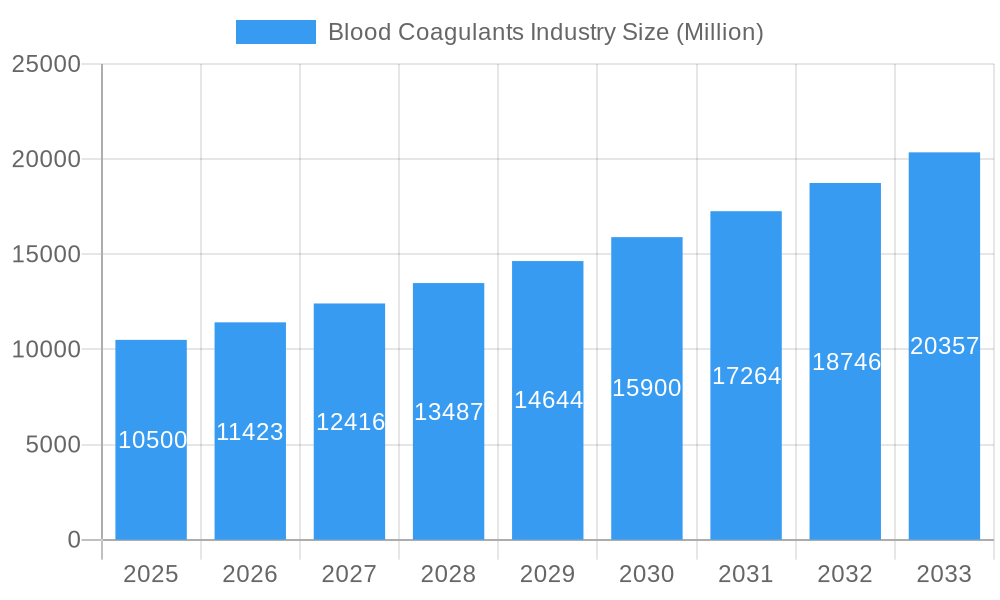
Blood Coagulants Industry Market Size (In Million)
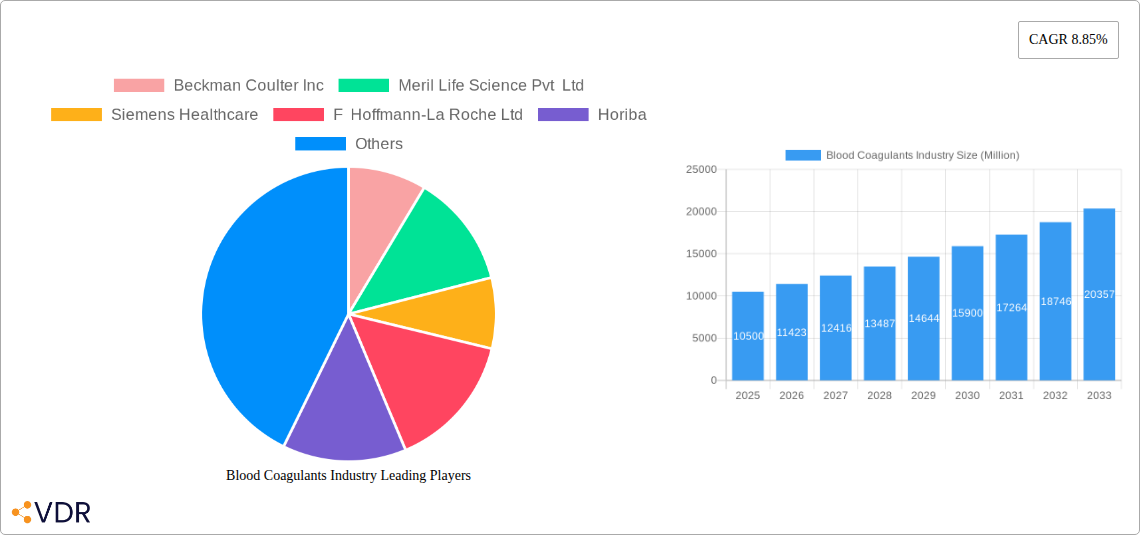
The market is characterized by intense competition from major global players, including Beckman Coulter Inc., Siemens Healthcare, F Hoffmann-La Roche Ltd., and Thermo Fisher Scientific Inc. These companies are actively investing in research and development to launch next-generation diagnostic instruments and reagents. Geographically, North America and Europe currently hold the largest market share, attributed to robust healthcare infrastructures, high healthcare spending, and advanced technological adoption. However, the Asia Pacific region is expected to experience the most rapid growth, driven by a burgeoning healthcare sector, increasing disposable incomes, and a strategic focus on enhancing diagnostic capabilities in emerging economies like China and India. Potential challenges include stringent regulatory approval processes, the high cost of advanced diagnostic equipment, and the requirement for skilled laboratory personnel. Nevertheless, the consistent demand for accurate and timely coagulation diagnostics in managing critical health conditions ensures a promising outlook for the blood coagulants market.
Blood Coagulants Industry Company Market Share
Comprehensive Blood Coagulants Market Report: Dynamics, Trends, and Future Outlook (2019-2033)
This in-depth report provides a strategic analysis of the global Blood Coagulants Market, forecasting its trajectory from 2019 to 2033, with a base year of 2025. Delve into market dynamics, growth drivers, regional dominance, product innovations, and competitive landscapes, leveraging precise data and industry insights. This report is essential for stakeholders seeking to understand and capitalize on the evolving blood diagnostics landscape, particularly in the realm of coagulation testing.
Blood Coagulants Industry Market Dynamics & Structure
The Blood Coagulants Industry is characterized by a moderately concentrated market, driven by significant technological innovation, stringent regulatory frameworks, and the constant evolution of competitive product substitutes. End-user demographics, primarily hospitals and diagnostic centers, are increasingly demanding for faster, more accurate, and point-of-care coagulation testing solutions. Merger and acquisition (M&A) trends, while not as prolific as in some other healthcare sectors, are significant, indicating consolidation and strategic alignment among key players.
- Market Concentration: Dominated by a few major global players alongside a growing number of specialized regional manufacturers, indicating a balance between established giants and emerging innovators.
- Technological Innovation Drivers: The demand for improved diagnostic accuracy, rapid results, and decentralized testing capabilities fuels innovation in analyzer technology and reagent development.
- Regulatory Frameworks: Strict FDA, CE, and other regional regulatory approvals are crucial for market entry and product validation, ensuring patient safety and diagnostic reliability.
- Competitive Product Substitutes: While direct substitutes are limited in core coagulation testing, advancements in alternative diagnostic methods and integrated testing platforms pose indirect competition.
- End-User Demographics: A growing aging population, increased prevalence of cardiovascular diseases and bleeding disorders, and a rise in minimally invasive surgical procedures are key drivers for demand.
- M&A Trends: Strategic acquisitions are focused on expanding product portfolios, geographical reach, and integrating advanced technologies, contributing to market consolidation. Estimated M&A deal volume in the broader in-vitro diagnostics (IVD) market, which includes coagulants, has seen a steady increase, with specific deal values for coagulants often undisclosed but indicative of strategic interest.
Blood Coagulants Industry Growth Trends & Insights
The global Blood Coagulants Market is poised for robust expansion, projected to witness a Compound Annual Growth Rate (CAGR) of approximately 7.5% during the forecast period of 2025–2033. This significant growth is underpinned by escalating healthcare expenditures, an increasing prevalence of coagulation disorders, and a growing emphasis on early disease detection and management. The adoption rate of advanced coagulation analyzers, particularly automated and point-of-care devices, is accelerating, driven by their ability to provide rapid and reliable results. Technological disruptions, such as the integration of artificial intelligence (AI) for data analysis and the development of novel diagnostic reagents, are further reshaping the market. Consumer behavior shifts are also playing a crucial role, with an increased preference for minimally invasive diagnostic procedures and a greater awareness among healthcare providers and patients about the importance of timely and accurate coagulation assessment. The market size evolution is characterized by a steady upward trend, from an estimated xx million units in 2019 to a projected xx million units by 2033. Market penetration is deepening as diagnostic capabilities expand to remote and underserved areas, supported by the development of more portable and user-friendly analyzers.
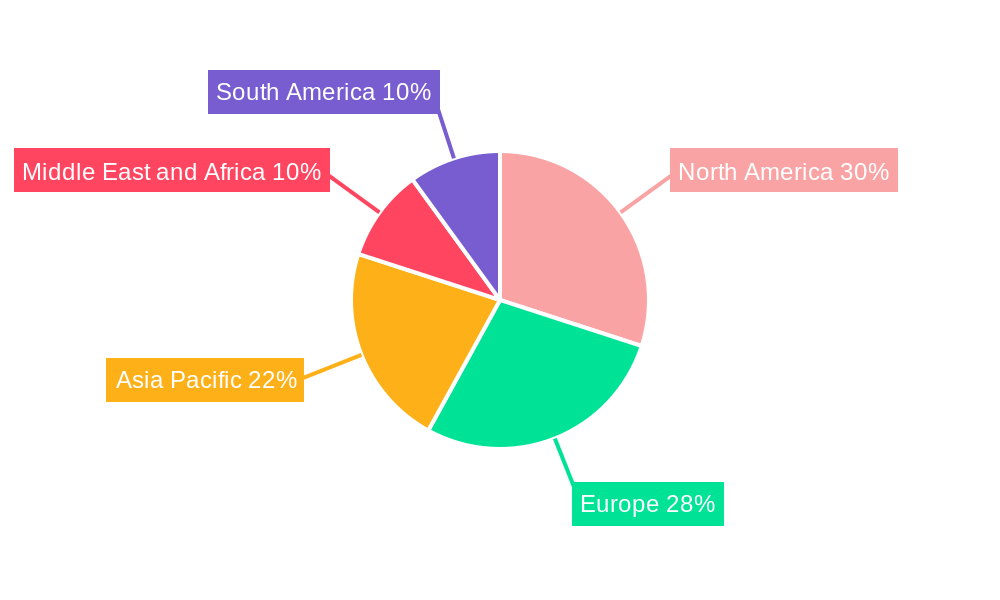
Dominant Regions, Countries, or Segments in Blood Coagulants Industry
The global Blood Coagulants Market exhibits distinct regional dominance and segment leadership, driven by a confluence of economic policies, healthcare infrastructure, and disease prevalence. North America, particularly the United States, and Europe, led by Germany and the UK, currently represent the largest market shares due to their well-established healthcare systems, high per capita healthcare spending, and advanced diagnostic laboratories.
Product Segment Dominance:
- Analyzers: Clinical Laboratory Analyzers hold the largest market share, accounting for an estimated 65% of the total analyzers market due to their widespread use in central laboratories. Point-of-Care Analyzers are experiencing rapid growth, driven by the demand for decentralized testing in emergency rooms, critical care units, and physician offices.
- Consumables: Reagents and other disposables constitute a significant portion of the market's recurring revenue, with an estimated 35% market share, directly correlating with the volume of tests performed.
Test Type Dominance:
- D-Dimer Testing: This segment is a major growth driver, fueled by the rising incidence of deep vein thrombosis (DVT) and pulmonary embolism (PE), holding approximately 30% of the test type market.
- Fibrinogen Testing: Essential for assessing clotting potential and diagnosing certain bleeding disorders, this segment represents around 25% of the market.
- Platelet Function Tests: Crucial for monitoring antiplatelet therapy and diagnosing platelet disorders, contributing about 20% of the market share.
- Other Coagulation Tests: This includes PT, aPTT, and others, collectively accounting for the remaining 25%.
Technology Dominance:
- Optical Technology: Dominates the market due to its established reliability, accuracy, and cost-effectiveness in detecting clot formation, representing approximately 55% of the technology market.
- Mechanical Technology: Remains relevant for specific applications and cost-sensitive markets, accounting for around 20%.
- Electrochemical Technology: Emerges as a rapidly growing segment, particularly in point-of-care devices, due to its potential for miniaturization and automation, holding about 15%.
End-User Dominance:
- Hospitals: Represent the largest end-user segment, consuming approximately 50% of blood coagulants products due to high patient volumes and complex diagnostic needs.
- Diagnostic Centers: Account for a substantial 40% of the market, benefiting from increasing outsourcing of laboratory testing and a focus on specialized diagnostics.
- Others: This includes research institutions and veterinary clinics, collectively holding a 10% share.
The Asia-Pacific region is emerging as a high-growth market, driven by increasing healthcare investments, improving diagnostic infrastructure, and a rising awareness of coagulation disorders in countries like China and India. Economic policies promoting healthcare accessibility and government initiatives for disease management are key factors propelling this growth.
Blood Coagulants Industry Product Landscape
The Blood Coagulants Industry is defined by continuous product innovation aimed at enhancing diagnostic accuracy, speed, and ease of use. Key product developments include the introduction of fully automated coagulation analyzers, offering improved throughput and reduced manual intervention. Point-of-care analyzers are increasingly sophisticated, enabling rapid bedside testing for critical conditions. Advancements in reagent formulations are leading to greater sensitivity and specificity for various coagulation tests like Fibrinogen Testing and D-Dimer Testing. Unique selling propositions often lie in the integration of advanced technologies, such as optical and electrochemical methods, for precise clot detection. The performance metrics emphasize reduced turnaround times, enhanced precision, and compatibility with diverse sample types, catering to the evolving needs of hospitals and diagnostic centers.
Key Drivers, Barriers & Challenges in Blood Coagulants Industry
The Blood Coagulants Industry is propelled by several key drivers, primarily the escalating prevalence of cardiovascular diseases, deep vein thrombosis, and pulmonary embolism globally. Advances in diagnostic technologies, leading to more accurate and faster testing, significantly boost market growth. The increasing demand for point-of-care testing solutions, driven by the need for immediate patient management, is another major catalyst. Furthermore, a growing aging population, more susceptible to coagulation-related disorders, contributes to sustained demand.
Conversely, the industry faces notable barriers and challenges. The high cost of sophisticated diagnostic analyzers and reagents can be a restraint, particularly in emerging economies. Stringent regulatory approvals and the need for extensive validation processes add to the time and expense of bringing new products to market. Supply chain disruptions for critical raw materials and components can impact manufacturing and availability. Intense competition among established players and the threat of technological obsolescence also pose significant challenges.
Emerging Opportunities in Blood Coagulants Industry
Emerging opportunities in the Blood Coagulants Industry lie in the development of novel biomarkers for predicting thrombotic risk and identifying specific coagulation pathway dysfunctions. The expansion of point-of-care testing into physician offices and remote healthcare settings presents a significant untapped market. Innovations in multiplexing technologies, allowing for the simultaneous testing of multiple coagulation parameters from a single sample, are gaining traction. Furthermore, the increasing integration of AI and machine learning in diagnostic platforms for enhanced data interpretation and predictive analytics offers substantial growth potential. Evolving consumer preferences for non-invasive or minimally invasive diagnostic methods will also drive innovation in sample collection and analysis techniques.
Growth Accelerators in the Blood Coagulants Industry Industry
Technological breakthroughs in automation and miniaturization are significant growth accelerators for the Blood Coagulants Industry. Strategic partnerships between analyzer manufacturers and reagent suppliers are fostering integrated solutions, enhancing product offerings and market reach. Market expansion into underserved regions, driven by rising healthcare awareness and improving economic conditions, is a key strategy for long-term growth. The development of highly specific and sensitive diagnostic assays for rare coagulation disorders also contributes to market expansion. Furthermore, the increasing adoption of laboratory information systems (LIS) and the trend towards digital health are creating opportunities for enhanced data management and connectivity within the coagulation testing workflow.
Key Players Shaping the Blood Coagulants Industry Market
- Beckman Coulter Inc
- Meril Life Science Pvt Ltd
- Siemens Healthcare
- F Hoffmann-La Roche Ltd
- Horiba
- Thermo Fisher Scientific Inc
- Trivitron Healthcare
- Eurolyser Diagnostica GmbH
- Abbott Laboratories
- Helena Laboratories
- Diagnostica Stago Sas
- Nihon Kohden Corporation
Notable Milestones in Blood Coagulants Industry Sector
- October 2021: Trivitron Healthcare launched a new line of Coagulation Analyzer products in India, manufactured by Diagon Ltd., expanding its diagnostic portfolio in a key emerging market.
- February 2021: Siemens Healthineers and Sysmex Corporation renewed their long-standing global supply, distributorship, sales, and service agreement for hemostasis products, including a multi-year extension. This agreement also covers the future distribution of Sysmex's CN-Series automated blood coagulation analyzers (CN-3000 and CN-6000) by Siemens Healthineers, aiming to bring next-generation, fully automated solutions for mid- and high-volume coagulation testing to laboratories.
In-Depth Blood Coagulants Industry Market Outlook
The Blood Coagulants Industry is on a strong growth trajectory, fueled by ongoing advancements in diagnostic technologies and a growing global demand for accurate and timely coagulation testing. Strategic partnerships and market expansion into emerging economies will continue to be key growth accelerators. The increasing focus on personalized medicine and the development of more sophisticated diagnostic tools for a wider range of coagulation disorders will unlock further market potential. Stakeholders can expect continued innovation in analyzer design, reagent development, and data integration, creating a dynamic and evolving landscape for this critical segment of the in-vitro diagnostics market.
Blood Coagulants Industry Segmentation
-
1. Product
-
1.1. Analyzers
- 1.1.1. Clinical Laboratory Analyzers
- 1.1.2. Point of Care Analyzers
- 1.2. Consumables
-
1.1. Analyzers
-
2. Test Type
- 2.1. Fibrinogen Testing
- 2.2. D-Dimer Testing
- 2.3. Platelet Function Tests
- 2.4. Other Coagulation Tests
-
3. Technology
- 3.1. Optical Technology
- 3.2. Mechanical Technology
- 3.3. Electrochemical Technology
- 3.4. Others
-
4. End User
- 4.1. Hospitals
- 4.2. Diagnostic Centers
- 4.3. Others
Blood Coagulants Industry Segmentation By Geography
-
1. North America
- 1.1. United States
- 1.2. Canada
- 1.3. Mexico
-
2. Europe
- 2.1. Germany
- 2.2. United Kingdom
- 2.3. France
- 2.4. Italy
- 2.5. Spain
- 2.6. Rest of Europe
-
3. Asia Pacific
- 3.1. China
- 3.2. Japan
- 3.3. India
- 3.4. Australia
- 3.5. South Korea
- 3.6. Rest of Asia Pacific
-
4. Middle East and Africa
- 4.1. GCC
- 4.2. South Africa
- 4.3. Rest of Middle East and Africa
-
5. South America
- 5.1. Brazil
- 5.2. Argentina
- 5.3. Rest of South America
Blood Coagulants Industry Regional Market Share
Geographic Coverage of Blood Coagulants Industry
Blood Coagulants Industry REPORT HIGHLIGHTS
| Aspects | Details |
|---|---|
| Study Period | 2020-2034 |
| Base Year | 2025 |
| Estimated Year | 2026 |
| Forecast Period | 2026-2034 |
| Historical Period | 2020-2025 |
| Growth Rate | CAGR of 6.7% from 2020-2034 |
| Segmentation |
|
Table of Contents
- 1. Introduction
- 1.1. Research Scope
- 1.2. Market Segmentation
- 1.3. Research Objective
- 1.4. Definitions and Assumptions
- 2. Executive Summary
- 2.1. Market Snapshot
- 3. Market Dynamics
- 3.1. Market Drivers
- 3.2. Market Restrains
- 3.3. Market Trends
- 3.4. Market Opportunities
- 4. Market Factor Analysis
- 4.1. Porters Five Forces
- 4.1.1. Bargaining Power of Suppliers
- 4.1.2. Bargaining Power of Buyers
- 4.1.3. Threat of New Entrants
- 4.1.4. Threat of Substitutes
- 4.1.5. Competitive Rivalry
- 4.2. PESTEL analysis
- 4.3. BCG Analysis
- 4.3.1. Stars (High Growth, High Market Share)
- 4.3.2. Cash Cows (Low Growth, High Market Share)
- 4.3.3. Question Mark (High Growth, Low Market Share)
- 4.3.4. Dogs (Low Growth, Low Market Share)
- 4.4. Ansoff Matrix Analysis
- 4.5. Supply Chain Analysis
- 4.6. Regulatory Landscape
- 4.7. Current Market Potential and Opportunity Assessment (TAM–SAM–SOM Framework)
- 4.8. VDR Analyst Note
- 4.1. Porters Five Forces
- 5. Market Analysis, Insights and Forecast 2021-2033
- 5.1. Market Analysis, Insights and Forecast - by Product
- 5.1.1. Analyzers
- 5.1.1.1. Clinical Laboratory Analyzers
- 5.1.1.2. Point of Care Analyzers
- 5.1.2. Consumables
- 5.1.1. Analyzers
- 5.2. Market Analysis, Insights and Forecast - by Test Type
- 5.2.1. Fibrinogen Testing
- 5.2.2. D-Dimer Testing
- 5.2.3. Platelet Function Tests
- 5.2.4. Other Coagulation Tests
- 5.3. Market Analysis, Insights and Forecast - by Technology
- 5.3.1. Optical Technology
- 5.3.2. Mechanical Technology
- 5.3.3. Electrochemical Technology
- 5.3.4. Others
- 5.4. Market Analysis, Insights and Forecast - by End User
- 5.4.1. Hospitals
- 5.4.2. Diagnostic Centers
- 5.4.3. Others
- 5.5. Market Analysis, Insights and Forecast - by Region
- 5.5.1. North America
- 5.5.2. Europe
- 5.5.3. Asia Pacific
- 5.5.4. Middle East and Africa
- 5.5.5. South America
- 5.1. Market Analysis, Insights and Forecast - by Product
- 6. Global Blood Coagulants Industry Analysis, Insights and Forecast, 2021-2033
- 6.1. Market Analysis, Insights and Forecast - by Product
- 6.1.1. Analyzers
- 6.1.1.1. Clinical Laboratory Analyzers
- 6.1.1.2. Point of Care Analyzers
- 6.1.2. Consumables
- 6.1.1. Analyzers
- 6.2. Market Analysis, Insights and Forecast - by Test Type
- 6.2.1. Fibrinogen Testing
- 6.2.2. D-Dimer Testing
- 6.2.3. Platelet Function Tests
- 6.2.4. Other Coagulation Tests
- 6.3. Market Analysis, Insights and Forecast - by Technology
- 6.3.1. Optical Technology
- 6.3.2. Mechanical Technology
- 6.3.3. Electrochemical Technology
- 6.3.4. Others
- 6.4. Market Analysis, Insights and Forecast - by End User
- 6.4.1. Hospitals
- 6.4.2. Diagnostic Centers
- 6.4.3. Others
- 6.1. Market Analysis, Insights and Forecast - by Product
- 7. North America Blood Coagulants Industry Analysis, Insights and Forecast, 2021-2033
- 7.1. Market Analysis, Insights and Forecast - by Product
- 7.1.1. Analyzers
- 7.1.1.1. Clinical Laboratory Analyzers
- 7.1.1.2. Point of Care Analyzers
- 7.1.2. Consumables
- 7.1.1. Analyzers
- 7.2. Market Analysis, Insights and Forecast - by Test Type
- 7.2.1. Fibrinogen Testing
- 7.2.2. D-Dimer Testing
- 7.2.3. Platelet Function Tests
- 7.2.4. Other Coagulation Tests
- 7.3. Market Analysis, Insights and Forecast - by Technology
- 7.3.1. Optical Technology
- 7.3.2. Mechanical Technology
- 7.3.3. Electrochemical Technology
- 7.3.4. Others
- 7.4. Market Analysis, Insights and Forecast - by End User
- 7.4.1. Hospitals
- 7.4.2. Diagnostic Centers
- 7.4.3. Others
- 7.1. Market Analysis, Insights and Forecast - by Product
- 8. Europe Blood Coagulants Industry Analysis, Insights and Forecast, 2021-2033
- 8.1. Market Analysis, Insights and Forecast - by Product
- 8.1.1. Analyzers
- 8.1.1.1. Clinical Laboratory Analyzers
- 8.1.1.2. Point of Care Analyzers
- 8.1.2. Consumables
- 8.1.1. Analyzers
- 8.2. Market Analysis, Insights and Forecast - by Test Type
- 8.2.1. Fibrinogen Testing
- 8.2.2. D-Dimer Testing
- 8.2.3. Platelet Function Tests
- 8.2.4. Other Coagulation Tests
- 8.3. Market Analysis, Insights and Forecast - by Technology
- 8.3.1. Optical Technology
- 8.3.2. Mechanical Technology
- 8.3.3. Electrochemical Technology
- 8.3.4. Others
- 8.4. Market Analysis, Insights and Forecast - by End User
- 8.4.1. Hospitals
- 8.4.2. Diagnostic Centers
- 8.4.3. Others
- 8.1. Market Analysis, Insights and Forecast - by Product
- 9. Asia Pacific Blood Coagulants Industry Analysis, Insights and Forecast, 2021-2033
- 9.1. Market Analysis, Insights and Forecast - by Product
- 9.1.1. Analyzers
- 9.1.1.1. Clinical Laboratory Analyzers
- 9.1.1.2. Point of Care Analyzers
- 9.1.2. Consumables
- 9.1.1. Analyzers
- 9.2. Market Analysis, Insights and Forecast - by Test Type
- 9.2.1. Fibrinogen Testing
- 9.2.2. D-Dimer Testing
- 9.2.3. Platelet Function Tests
- 9.2.4. Other Coagulation Tests
- 9.3. Market Analysis, Insights and Forecast - by Technology
- 9.3.1. Optical Technology
- 9.3.2. Mechanical Technology
- 9.3.3. Electrochemical Technology
- 9.3.4. Others
- 9.4. Market Analysis, Insights and Forecast - by End User
- 9.4.1. Hospitals
- 9.4.2. Diagnostic Centers
- 9.4.3. Others
- 9.1. Market Analysis, Insights and Forecast - by Product
- 10. Middle East and Africa Blood Coagulants Industry Analysis, Insights and Forecast, 2021-2033
- 10.1. Market Analysis, Insights and Forecast - by Product
- 10.1.1. Analyzers
- 10.1.1.1. Clinical Laboratory Analyzers
- 10.1.1.2. Point of Care Analyzers
- 10.1.2. Consumables
- 10.1.1. Analyzers
- 10.2. Market Analysis, Insights and Forecast - by Test Type
- 10.2.1. Fibrinogen Testing
- 10.2.2. D-Dimer Testing
- 10.2.3. Platelet Function Tests
- 10.2.4. Other Coagulation Tests
- 10.3. Market Analysis, Insights and Forecast - by Technology
- 10.3.1. Optical Technology
- 10.3.2. Mechanical Technology
- 10.3.3. Electrochemical Technology
- 10.3.4. Others
- 10.4. Market Analysis, Insights and Forecast - by End User
- 10.4.1. Hospitals
- 10.4.2. Diagnostic Centers
- 10.4.3. Others
- 10.1. Market Analysis, Insights and Forecast - by Product
- 11. South America Blood Coagulants Industry Analysis, Insights and Forecast, 2021-2033
- 11.1. Market Analysis, Insights and Forecast - by Product
- 11.1.1. Analyzers
- 11.1.1.1. Clinical Laboratory Analyzers
- 11.1.1.2. Point of Care Analyzers
- 11.1.2. Consumables
- 11.1.1. Analyzers
- 11.2. Market Analysis, Insights and Forecast - by Test Type
- 11.2.1. Fibrinogen Testing
- 11.2.2. D-Dimer Testing
- 11.2.3. Platelet Function Tests
- 11.2.4. Other Coagulation Tests
- 11.3. Market Analysis, Insights and Forecast - by Technology
- 11.3.1. Optical Technology
- 11.3.2. Mechanical Technology
- 11.3.3. Electrochemical Technology
- 11.3.4. Others
- 11.4. Market Analysis, Insights and Forecast - by End User
- 11.4.1. Hospitals
- 11.4.2. Diagnostic Centers
- 11.4.3. Others
- 11.1. Market Analysis, Insights and Forecast - by Product
- 12. Competitive Analysis
- 12.1. Company Profiles
- 12.1.1 Beckman Coulter Inc
- 12.1.1.1. Company Overview
- 12.1.1.2. Products
- 12.1.1.3. Company Financials
- 12.1.1.4. SWOT Analysis
- 12.1.2 Meril Life Science Pvt Ltd
- 12.1.2.1. Company Overview
- 12.1.2.2. Products
- 12.1.2.3. Company Financials
- 12.1.2.4. SWOT Analysis
- 12.1.3 Siemens Healthcare
- 12.1.3.1. Company Overview
- 12.1.3.2. Products
- 12.1.3.3. Company Financials
- 12.1.3.4. SWOT Analysis
- 12.1.4 F Hoffmann-La Roche Ltd
- 12.1.4.1. Company Overview
- 12.1.4.2. Products
- 12.1.4.3. Company Financials
- 12.1.4.4. SWOT Analysis
- 12.1.5 Horiba
- 12.1.5.1. Company Overview
- 12.1.5.2. Products
- 12.1.5.3. Company Financials
- 12.1.5.4. SWOT Analysis
- 12.1.6 Thermo Fisher Scientific Inc
- 12.1.6.1. Company Overview
- 12.1.6.2. Products
- 12.1.6.3. Company Financials
- 12.1.6.4. SWOT Analysis
- 12.1.7 Trivitron Healthcare
- 12.1.7.1. Company Overview
- 12.1.7.2. Products
- 12.1.7.3. Company Financials
- 12.1.7.4. SWOT Analysis
- 12.1.8 Eurolyser Diagnostica GmbH
- 12.1.8.1. Company Overview
- 12.1.8.2. Products
- 12.1.8.3. Company Financials
- 12.1.8.4. SWOT Analysis
- 12.1.9 Abbott Laboratories
- 12.1.9.1. Company Overview
- 12.1.9.2. Products
- 12.1.9.3. Company Financials
- 12.1.9.4. SWOT Analysis
- 12.1.10 Helena Laboratories
- 12.1.10.1. Company Overview
- 12.1.10.2. Products
- 12.1.10.3. Company Financials
- 12.1.10.4. SWOT Analysis
- 12.1.11 Diagnostica Stago Sas
- 12.1.11.1. Company Overview
- 12.1.11.2. Products
- 12.1.11.3. Company Financials
- 12.1.11.4. SWOT Analysis
- 12.1.12 Nihon Kohden Corporation
- 12.1.12.1. Company Overview
- 12.1.12.2. Products
- 12.1.12.3. Company Financials
- 12.1.12.4. SWOT Analysis
- 12.1.1 Beckman Coulter Inc
- 12.2. Market Entropy
- 12.2.1 Company's Key Areas Served
- 12.2.2 Recent Developments
- 12.3. Company Market Share Analysis 2025
- 12.3.1 Top 5 Companies Market Share Analysis
- 12.3.2 Top 3 Companies Market Share Analysis
- 12.4. List of Potential Customers
- 13. Research Methodology
List of Figures
- Figure 1: Global Blood Coagulants Industry Revenue Breakdown (million, %) by Region 2025 & 2033
- Figure 2: Global Blood Coagulants Industry Volume Breakdown (K Unit, %) by Region 2025 & 2033
- Figure 3: North America Blood Coagulants Industry Revenue (million), by Product 2025 & 2033
- Figure 4: North America Blood Coagulants Industry Volume (K Unit), by Product 2025 & 2033
- Figure 5: North America Blood Coagulants Industry Revenue Share (%), by Product 2025 & 2033
- Figure 6: North America Blood Coagulants Industry Volume Share (%), by Product 2025 & 2033
- Figure 7: North America Blood Coagulants Industry Revenue (million), by Test Type 2025 & 2033
- Figure 8: North America Blood Coagulants Industry Volume (K Unit), by Test Type 2025 & 2033
- Figure 9: North America Blood Coagulants Industry Revenue Share (%), by Test Type 2025 & 2033
- Figure 10: North America Blood Coagulants Industry Volume Share (%), by Test Type 2025 & 2033
- Figure 11: North America Blood Coagulants Industry Revenue (million), by Technology 2025 & 2033
- Figure 12: North America Blood Coagulants Industry Volume (K Unit), by Technology 2025 & 2033
- Figure 13: North America Blood Coagulants Industry Revenue Share (%), by Technology 2025 & 2033
- Figure 14: North America Blood Coagulants Industry Volume Share (%), by Technology 2025 & 2033
- Figure 15: North America Blood Coagulants Industry Revenue (million), by End User 2025 & 2033
- Figure 16: North America Blood Coagulants Industry Volume (K Unit), by End User 2025 & 2033
- Figure 17: North America Blood Coagulants Industry Revenue Share (%), by End User 2025 & 2033
- Figure 18: North America Blood Coagulants Industry Volume Share (%), by End User 2025 & 2033
- Figure 19: North America Blood Coagulants Industry Revenue (million), by Country 2025 & 2033
- Figure 20: North America Blood Coagulants Industry Volume (K Unit), by Country 2025 & 2033
- Figure 21: North America Blood Coagulants Industry Revenue Share (%), by Country 2025 & 2033
- Figure 22: North America Blood Coagulants Industry Volume Share (%), by Country 2025 & 2033
- Figure 23: Europe Blood Coagulants Industry Revenue (million), by Product 2025 & 2033
- Figure 24: Europe Blood Coagulants Industry Volume (K Unit), by Product 2025 & 2033
- Figure 25: Europe Blood Coagulants Industry Revenue Share (%), by Product 2025 & 2033
- Figure 26: Europe Blood Coagulants Industry Volume Share (%), by Product 2025 & 2033
- Figure 27: Europe Blood Coagulants Industry Revenue (million), by Test Type 2025 & 2033
- Figure 28: Europe Blood Coagulants Industry Volume (K Unit), by Test Type 2025 & 2033
- Figure 29: Europe Blood Coagulants Industry Revenue Share (%), by Test Type 2025 & 2033
- Figure 30: Europe Blood Coagulants Industry Volume Share (%), by Test Type 2025 & 2033
- Figure 31: Europe Blood Coagulants Industry Revenue (million), by Technology 2025 & 2033
- Figure 32: Europe Blood Coagulants Industry Volume (K Unit), by Technology 2025 & 2033
- Figure 33: Europe Blood Coagulants Industry Revenue Share (%), by Technology 2025 & 2033
- Figure 34: Europe Blood Coagulants Industry Volume Share (%), by Technology 2025 & 2033
- Figure 35: Europe Blood Coagulants Industry Revenue (million), by End User 2025 & 2033
- Figure 36: Europe Blood Coagulants Industry Volume (K Unit), by End User 2025 & 2033
- Figure 37: Europe Blood Coagulants Industry Revenue Share (%), by End User 2025 & 2033
- Figure 38: Europe Blood Coagulants Industry Volume Share (%), by End User 2025 & 2033
- Figure 39: Europe Blood Coagulants Industry Revenue (million), by Country 2025 & 2033
- Figure 40: Europe Blood Coagulants Industry Volume (K Unit), by Country 2025 & 2033
- Figure 41: Europe Blood Coagulants Industry Revenue Share (%), by Country 2025 & 2033
- Figure 42: Europe Blood Coagulants Industry Volume Share (%), by Country 2025 & 2033
- Figure 43: Asia Pacific Blood Coagulants Industry Revenue (million), by Product 2025 & 2033
- Figure 44: Asia Pacific Blood Coagulants Industry Volume (K Unit), by Product 2025 & 2033
- Figure 45: Asia Pacific Blood Coagulants Industry Revenue Share (%), by Product 2025 & 2033
- Figure 46: Asia Pacific Blood Coagulants Industry Volume Share (%), by Product 2025 & 2033
- Figure 47: Asia Pacific Blood Coagulants Industry Revenue (million), by Test Type 2025 & 2033
- Figure 48: Asia Pacific Blood Coagulants Industry Volume (K Unit), by Test Type 2025 & 2033
- Figure 49: Asia Pacific Blood Coagulants Industry Revenue Share (%), by Test Type 2025 & 2033
- Figure 50: Asia Pacific Blood Coagulants Industry Volume Share (%), by Test Type 2025 & 2033
- Figure 51: Asia Pacific Blood Coagulants Industry Revenue (million), by Technology 2025 & 2033
- Figure 52: Asia Pacific Blood Coagulants Industry Volume (K Unit), by Technology 2025 & 2033
- Figure 53: Asia Pacific Blood Coagulants Industry Revenue Share (%), by Technology 2025 & 2033
- Figure 54: Asia Pacific Blood Coagulants Industry Volume Share (%), by Technology 2025 & 2033
- Figure 55: Asia Pacific Blood Coagulants Industry Revenue (million), by End User 2025 & 2033
- Figure 56: Asia Pacific Blood Coagulants Industry Volume (K Unit), by End User 2025 & 2033
- Figure 57: Asia Pacific Blood Coagulants Industry Revenue Share (%), by End User 2025 & 2033
- Figure 58: Asia Pacific Blood Coagulants Industry Volume Share (%), by End User 2025 & 2033
- Figure 59: Asia Pacific Blood Coagulants Industry Revenue (million), by Country 2025 & 2033
- Figure 60: Asia Pacific Blood Coagulants Industry Volume (K Unit), by Country 2025 & 2033
- Figure 61: Asia Pacific Blood Coagulants Industry Revenue Share (%), by Country 2025 & 2033
- Figure 62: Asia Pacific Blood Coagulants Industry Volume Share (%), by Country 2025 & 2033
- Figure 63: Middle East and Africa Blood Coagulants Industry Revenue (million), by Product 2025 & 2033
- Figure 64: Middle East and Africa Blood Coagulants Industry Volume (K Unit), by Product 2025 & 2033
- Figure 65: Middle East and Africa Blood Coagulants Industry Revenue Share (%), by Product 2025 & 2033
- Figure 66: Middle East and Africa Blood Coagulants Industry Volume Share (%), by Product 2025 & 2033
- Figure 67: Middle East and Africa Blood Coagulants Industry Revenue (million), by Test Type 2025 & 2033
- Figure 68: Middle East and Africa Blood Coagulants Industry Volume (K Unit), by Test Type 2025 & 2033
- Figure 69: Middle East and Africa Blood Coagulants Industry Revenue Share (%), by Test Type 2025 & 2033
- Figure 70: Middle East and Africa Blood Coagulants Industry Volume Share (%), by Test Type 2025 & 2033
- Figure 71: Middle East and Africa Blood Coagulants Industry Revenue (million), by Technology 2025 & 2033
- Figure 72: Middle East and Africa Blood Coagulants Industry Volume (K Unit), by Technology 2025 & 2033
- Figure 73: Middle East and Africa Blood Coagulants Industry Revenue Share (%), by Technology 2025 & 2033
- Figure 74: Middle East and Africa Blood Coagulants Industry Volume Share (%), by Technology 2025 & 2033
- Figure 75: Middle East and Africa Blood Coagulants Industry Revenue (million), by End User 2025 & 2033
- Figure 76: Middle East and Africa Blood Coagulants Industry Volume (K Unit), by End User 2025 & 2033
- Figure 77: Middle East and Africa Blood Coagulants Industry Revenue Share (%), by End User 2025 & 2033
- Figure 78: Middle East and Africa Blood Coagulants Industry Volume Share (%), by End User 2025 & 2033
- Figure 79: Middle East and Africa Blood Coagulants Industry Revenue (million), by Country 2025 & 2033
- Figure 80: Middle East and Africa Blood Coagulants Industry Volume (K Unit), by Country 2025 & 2033
- Figure 81: Middle East and Africa Blood Coagulants Industry Revenue Share (%), by Country 2025 & 2033
- Figure 82: Middle East and Africa Blood Coagulants Industry Volume Share (%), by Country 2025 & 2033
- Figure 83: South America Blood Coagulants Industry Revenue (million), by Product 2025 & 2033
- Figure 84: South America Blood Coagulants Industry Volume (K Unit), by Product 2025 & 2033
- Figure 85: South America Blood Coagulants Industry Revenue Share (%), by Product 2025 & 2033
- Figure 86: South America Blood Coagulants Industry Volume Share (%), by Product 2025 & 2033
- Figure 87: South America Blood Coagulants Industry Revenue (million), by Test Type 2025 & 2033
- Figure 88: South America Blood Coagulants Industry Volume (K Unit), by Test Type 2025 & 2033
- Figure 89: South America Blood Coagulants Industry Revenue Share (%), by Test Type 2025 & 2033
- Figure 90: South America Blood Coagulants Industry Volume Share (%), by Test Type 2025 & 2033
- Figure 91: South America Blood Coagulants Industry Revenue (million), by Technology 2025 & 2033
- Figure 92: South America Blood Coagulants Industry Volume (K Unit), by Technology 2025 & 2033
- Figure 93: South America Blood Coagulants Industry Revenue Share (%), by Technology 2025 & 2033
- Figure 94: South America Blood Coagulants Industry Volume Share (%), by Technology 2025 & 2033
- Figure 95: South America Blood Coagulants Industry Revenue (million), by End User 2025 & 2033
- Figure 96: South America Blood Coagulants Industry Volume (K Unit), by End User 2025 & 2033
- Figure 97: South America Blood Coagulants Industry Revenue Share (%), by End User 2025 & 2033
- Figure 98: South America Blood Coagulants Industry Volume Share (%), by End User 2025 & 2033
- Figure 99: South America Blood Coagulants Industry Revenue (million), by Country 2025 & 2033
- Figure 100: South America Blood Coagulants Industry Volume (K Unit), by Country 2025 & 2033
- Figure 101: South America Blood Coagulants Industry Revenue Share (%), by Country 2025 & 2033
- Figure 102: South America Blood Coagulants Industry Volume Share (%), by Country 2025 & 2033
List of Tables
- Table 1: Global Blood Coagulants Industry Revenue million Forecast, by Product 2020 & 2033
- Table 2: Global Blood Coagulants Industry Volume K Unit Forecast, by Product 2020 & 2033
- Table 3: Global Blood Coagulants Industry Revenue million Forecast, by Test Type 2020 & 2033
- Table 4: Global Blood Coagulants Industry Volume K Unit Forecast, by Test Type 2020 & 2033
- Table 5: Global Blood Coagulants Industry Revenue million Forecast, by Technology 2020 & 2033
- Table 6: Global Blood Coagulants Industry Volume K Unit Forecast, by Technology 2020 & 2033
- Table 7: Global Blood Coagulants Industry Revenue million Forecast, by End User 2020 & 2033
- Table 8: Global Blood Coagulants Industry Volume K Unit Forecast, by End User 2020 & 2033
- Table 9: Global Blood Coagulants Industry Revenue million Forecast, by Region 2020 & 2033
- Table 10: Global Blood Coagulants Industry Volume K Unit Forecast, by Region 2020 & 2033
- Table 11: Global Blood Coagulants Industry Revenue million Forecast, by Product 2020 & 2033
- Table 12: Global Blood Coagulants Industry Volume K Unit Forecast, by Product 2020 & 2033
- Table 13: Global Blood Coagulants Industry Revenue million Forecast, by Test Type 2020 & 2033
- Table 14: Global Blood Coagulants Industry Volume K Unit Forecast, by Test Type 2020 & 2033
- Table 15: Global Blood Coagulants Industry Revenue million Forecast, by Technology 2020 & 2033
- Table 16: Global Blood Coagulants Industry Volume K Unit Forecast, by Technology 2020 & 2033
- Table 17: Global Blood Coagulants Industry Revenue million Forecast, by End User 2020 & 2033
- Table 18: Global Blood Coagulants Industry Volume K Unit Forecast, by End User 2020 & 2033
- Table 19: Global Blood Coagulants Industry Revenue million Forecast, by Country 2020 & 2033
- Table 20: Global Blood Coagulants Industry Volume K Unit Forecast, by Country 2020 & 2033
- Table 21: United States Blood Coagulants Industry Revenue (million) Forecast, by Application 2020 & 2033
- Table 22: United States Blood Coagulants Industry Volume (K Unit) Forecast, by Application 2020 & 2033
- Table 23: Canada Blood Coagulants Industry Revenue (million) Forecast, by Application 2020 & 2033
- Table 24: Canada Blood Coagulants Industry Volume (K Unit) Forecast, by Application 2020 & 2033
- Table 25: Mexico Blood Coagulants Industry Revenue (million) Forecast, by Application 2020 & 2033
- Table 26: Mexico Blood Coagulants Industry Volume (K Unit) Forecast, by Application 2020 & 2033
- Table 27: Global Blood Coagulants Industry Revenue million Forecast, by Product 2020 & 2033
- Table 28: Global Blood Coagulants Industry Volume K Unit Forecast, by Product 2020 & 2033
- Table 29: Global Blood Coagulants Industry Revenue million Forecast, by Test Type 2020 & 2033
- Table 30: Global Blood Coagulants Industry Volume K Unit Forecast, by Test Type 2020 & 2033
- Table 31: Global Blood Coagulants Industry Revenue million Forecast, by Technology 2020 & 2033
- Table 32: Global Blood Coagulants Industry Volume K Unit Forecast, by Technology 2020 & 2033
- Table 33: Global Blood Coagulants Industry Revenue million Forecast, by End User 2020 & 2033
- Table 34: Global Blood Coagulants Industry Volume K Unit Forecast, by End User 2020 & 2033
- Table 35: Global Blood Coagulants Industry Revenue million Forecast, by Country 2020 & 2033
- Table 36: Global Blood Coagulants Industry Volume K Unit Forecast, by Country 2020 & 2033
- Table 37: Germany Blood Coagulants Industry Revenue (million) Forecast, by Application 2020 & 2033
- Table 38: Germany Blood Coagulants Industry Volume (K Unit) Forecast, by Application 2020 & 2033
- Table 39: United Kingdom Blood Coagulants Industry Revenue (million) Forecast, by Application 2020 & 2033
- Table 40: United Kingdom Blood Coagulants Industry Volume (K Unit) Forecast, by Application 2020 & 2033
- Table 41: France Blood Coagulants Industry Revenue (million) Forecast, by Application 2020 & 2033
- Table 42: France Blood Coagulants Industry Volume (K Unit) Forecast, by Application 2020 & 2033
- Table 43: Italy Blood Coagulants Industry Revenue (million) Forecast, by Application 2020 & 2033
- Table 44: Italy Blood Coagulants Industry Volume (K Unit) Forecast, by Application 2020 & 2033
- Table 45: Spain Blood Coagulants Industry Revenue (million) Forecast, by Application 2020 & 2033
- Table 46: Spain Blood Coagulants Industry Volume (K Unit) Forecast, by Application 2020 & 2033
- Table 47: Rest of Europe Blood Coagulants Industry Revenue (million) Forecast, by Application 2020 & 2033
- Table 48: Rest of Europe Blood Coagulants Industry Volume (K Unit) Forecast, by Application 2020 & 2033
- Table 49: Global Blood Coagulants Industry Revenue million Forecast, by Product 2020 & 2033
- Table 50: Global Blood Coagulants Industry Volume K Unit Forecast, by Product 2020 & 2033
- Table 51: Global Blood Coagulants Industry Revenue million Forecast, by Test Type 2020 & 2033
- Table 52: Global Blood Coagulants Industry Volume K Unit Forecast, by Test Type 2020 & 2033
- Table 53: Global Blood Coagulants Industry Revenue million Forecast, by Technology 2020 & 2033
- Table 54: Global Blood Coagulants Industry Volume K Unit Forecast, by Technology 2020 & 2033
- Table 55: Global Blood Coagulants Industry Revenue million Forecast, by End User 2020 & 2033
- Table 56: Global Blood Coagulants Industry Volume K Unit Forecast, by End User 2020 & 2033
- Table 57: Global Blood Coagulants Industry Revenue million Forecast, by Country 2020 & 2033
- Table 58: Global Blood Coagulants Industry Volume K Unit Forecast, by Country 2020 & 2033
- Table 59: China Blood Coagulants Industry Revenue (million) Forecast, by Application 2020 & 2033
- Table 60: China Blood Coagulants Industry Volume (K Unit) Forecast, by Application 2020 & 2033
- Table 61: Japan Blood Coagulants Industry Revenue (million) Forecast, by Application 2020 & 2033
- Table 62: Japan Blood Coagulants Industry Volume (K Unit) Forecast, by Application 2020 & 2033
- Table 63: India Blood Coagulants Industry Revenue (million) Forecast, by Application 2020 & 2033
- Table 64: India Blood Coagulants Industry Volume (K Unit) Forecast, by Application 2020 & 2033
- Table 65: Australia Blood Coagulants Industry Revenue (million) Forecast, by Application 2020 & 2033
- Table 66: Australia Blood Coagulants Industry Volume (K Unit) Forecast, by Application 2020 & 2033
- Table 67: South Korea Blood Coagulants Industry Revenue (million) Forecast, by Application 2020 & 2033
- Table 68: South Korea Blood Coagulants Industry Volume (K Unit) Forecast, by Application 2020 & 2033
- Table 69: Rest of Asia Pacific Blood Coagulants Industry Revenue (million) Forecast, by Application 2020 & 2033
- Table 70: Rest of Asia Pacific Blood Coagulants Industry Volume (K Unit) Forecast, by Application 2020 & 2033
- Table 71: Global Blood Coagulants Industry Revenue million Forecast, by Product 2020 & 2033
- Table 72: Global Blood Coagulants Industry Volume K Unit Forecast, by Product 2020 & 2033
- Table 73: Global Blood Coagulants Industry Revenue million Forecast, by Test Type 2020 & 2033
- Table 74: Global Blood Coagulants Industry Volume K Unit Forecast, by Test Type 2020 & 2033
- Table 75: Global Blood Coagulants Industry Revenue million Forecast, by Technology 2020 & 2033
- Table 76: Global Blood Coagulants Industry Volume K Unit Forecast, by Technology 2020 & 2033
- Table 77: Global Blood Coagulants Industry Revenue million Forecast, by End User 2020 & 2033
- Table 78: Global Blood Coagulants Industry Volume K Unit Forecast, by End User 2020 & 2033
- Table 79: Global Blood Coagulants Industry Revenue million Forecast, by Country 2020 & 2033
- Table 80: Global Blood Coagulants Industry Volume K Unit Forecast, by Country 2020 & 2033
- Table 81: GCC Blood Coagulants Industry Revenue (million) Forecast, by Application 2020 & 2033
- Table 82: GCC Blood Coagulants Industry Volume (K Unit) Forecast, by Application 2020 & 2033
- Table 83: South Africa Blood Coagulants Industry Revenue (million) Forecast, by Application 2020 & 2033
- Table 84: South Africa Blood Coagulants Industry Volume (K Unit) Forecast, by Application 2020 & 2033
- Table 85: Rest of Middle East and Africa Blood Coagulants Industry Revenue (million) Forecast, by Application 2020 & 2033
- Table 86: Rest of Middle East and Africa Blood Coagulants Industry Volume (K Unit) Forecast, by Application 2020 & 2033
- Table 87: Global Blood Coagulants Industry Revenue million Forecast, by Product 2020 & 2033
- Table 88: Global Blood Coagulants Industry Volume K Unit Forecast, by Product 2020 & 2033
- Table 89: Global Blood Coagulants Industry Revenue million Forecast, by Test Type 2020 & 2033
- Table 90: Global Blood Coagulants Industry Volume K Unit Forecast, by Test Type 2020 & 2033
- Table 91: Global Blood Coagulants Industry Revenue million Forecast, by Technology 2020 & 2033
- Table 92: Global Blood Coagulants Industry Volume K Unit Forecast, by Technology 2020 & 2033
- Table 93: Global Blood Coagulants Industry Revenue million Forecast, by End User 2020 & 2033
- Table 94: Global Blood Coagulants Industry Volume K Unit Forecast, by End User 2020 & 2033
- Table 95: Global Blood Coagulants Industry Revenue million Forecast, by Country 2020 & 2033
- Table 96: Global Blood Coagulants Industry Volume K Unit Forecast, by Country 2020 & 2033
- Table 97: Brazil Blood Coagulants Industry Revenue (million) Forecast, by Application 2020 & 2033
- Table 98: Brazil Blood Coagulants Industry Volume (K Unit) Forecast, by Application 2020 & 2033
- Table 99: Argentina Blood Coagulants Industry Revenue (million) Forecast, by Application 2020 & 2033
- Table 100: Argentina Blood Coagulants Industry Volume (K Unit) Forecast, by Application 2020 & 2033
- Table 101: Rest of South America Blood Coagulants Industry Revenue (million) Forecast, by Application 2020 & 2033
- Table 102: Rest of South America Blood Coagulants Industry Volume (K Unit) Forecast, by Application 2020 & 2033
Frequently Asked Questions
1. What is the projected Compound Annual Growth Rate (CAGR) of the Blood Coagulants Industry?
The projected CAGR is approximately 6.7%.
2. Which companies are prominent players in the Blood Coagulants Industry?
Key companies in the market include Beckman Coulter Inc, Meril Life Science Pvt Ltd, Siemens Healthcare, F Hoffmann-La Roche Ltd, Horiba, Thermo Fisher Scientific Inc, Trivitron Healthcare, Eurolyser Diagnostica GmbH, Abbott Laboratories, Helena Laboratories, Diagnostica Stago Sas, Nihon Kohden Corporation.
3. What are the main segments of the Blood Coagulants Industry?
The market segments include Product, Test Type, Technology, End User.
4. Can you provide details about the market size?
The market size is estimated to be USD 472 million as of 2022.
5. What are some drivers contributing to market growth?
Increasing Prevalence of Chronic Blood Disorders; Rising Geriatric Population Coupled with Increasing Prevalence of Chronic Diseases; Increasing Laboratory Automation.
6. What are the notable trends driving market growth?
D-Dimer Testing Segment is Expected to Dominate the Market During the Forecast Period.
7. Are there any restraints impacting market growth?
Slow Adoption Rate in Underdeveloped Economies; High Cost of Test for Fully Automated Analyzers.
8. Can you provide examples of recent developments in the market?
In October 2021, Trivitron Healthcare, a medical devices company launched a new line of Coagulation Analyzer products in India manufactured by Diagon Ltd.
9. What pricing options are available for accessing the report?
Pricing options include single-user, multi-user, and enterprise licenses priced at USD 4750, USD 5250, and USD 8750 respectively.
10. Is the market size provided in terms of value or volume?
The market size is provided in terms of value, measured in million and volume, measured in K Unit.
11. Are there any specific market keywords associated with the report?
Yes, the market keyword associated with the report is "Blood Coagulants Industry," which aids in identifying and referencing the specific market segment covered.
12. How do I determine which pricing option suits my needs best?
The pricing options vary based on user requirements and access needs. Individual users may opt for single-user licenses, while businesses requiring broader access may choose multi-user or enterprise licenses for cost-effective access to the report.
13. Are there any additional resources or data provided in the Blood Coagulants Industry report?
While the report offers comprehensive insights, it's advisable to review the specific contents or supplementary materials provided to ascertain if additional resources or data are available.
14. How can I stay updated on further developments or reports in the Blood Coagulants Industry?
To stay informed about further developments, trends, and reports in the Blood Coagulants Industry, consider subscribing to industry newsletters, following relevant companies and organizations, or regularly checking reputable industry news sources and publications.
Methodology
Step 1 - Identification of Relevant Samples Size from Population Database


Step 2 - Approaches for Defining Global Market Size (Value, Volume* & Price*)

Note*: In applicable scenarios
Step 3 - Data Sources
Primary Research
- Web Analytics
- Survey Reports
- Research Institute
- Latest Research Reports
- Opinion Leaders
Secondary Research
- Annual Reports
- White Paper
- Latest Press Release
- Industry Association
- Paid Database
- Investor Presentations

Step 4 - Data Triangulation
Involves using different sources of information in order to increase the validity of a study
These sources are likely to be stakeholders in a program - participants, other researchers, program staff, other community members, and so on.
Then we put all data in single framework & apply various statistical tools to find out the dynamic on the market.
During the analysis stage, feedback from the stakeholder groups would be compared to determine areas of agreement as well as areas of divergence