
Key Insights
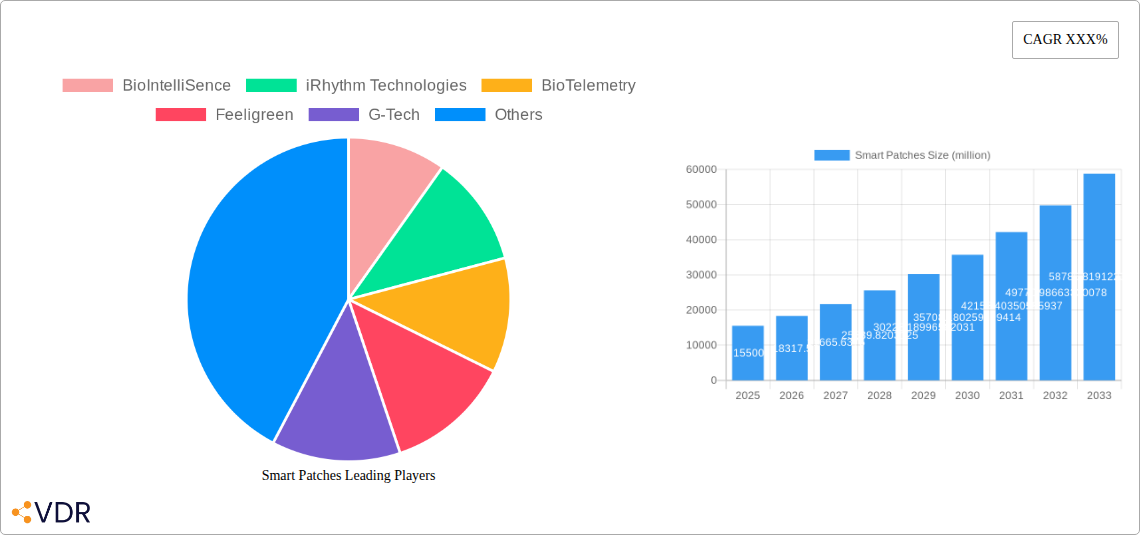
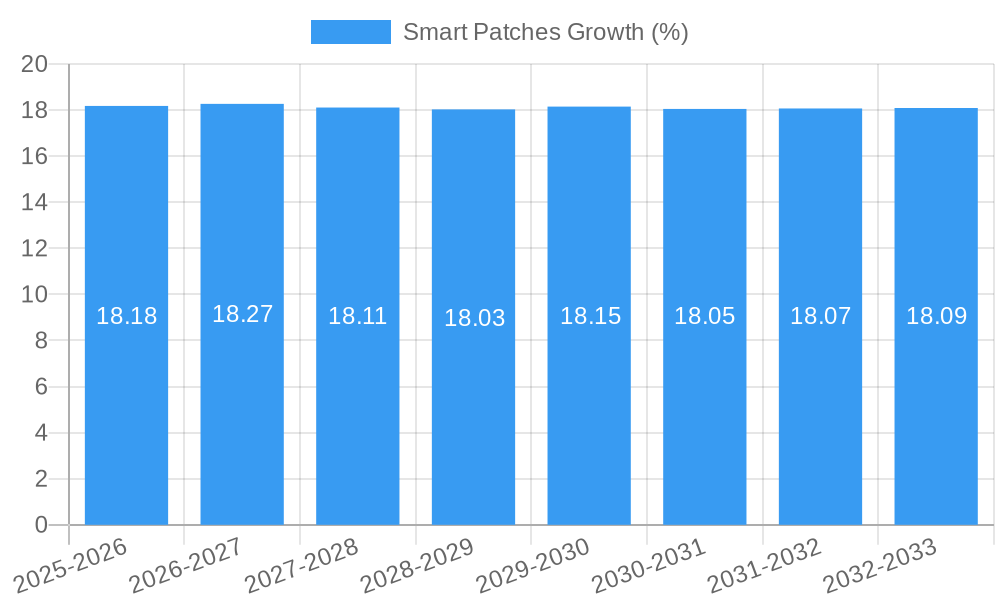
The global Smart Patches market is poised for significant expansion, projected to reach an estimated $15,500 million by 2025, with a projected compound annual growth rate (CAGR) of 18.5% through 2033. This robust growth is fueled by an increasing demand for continuous, non-invasive health monitoring solutions and advancements in wearable technology. Key drivers include the rising prevalence of chronic diseases, an aging global population, and a growing consumer interest in proactive health management and personalized medicine. The integration of smart patches with sophisticated AI algorithms for data analysis and predictive diagnostics further enhances their appeal. Furthermore, the expanding applications in drug delivery, offering precise and targeted therapeutic interventions, are contributing to market momentum. The market's trajectory is strongly influenced by the growing adoption of smart patches for applications like remote patient monitoring, post-operative care, and chronic condition management, all of which underscore the shift towards digital health and telehealth services.
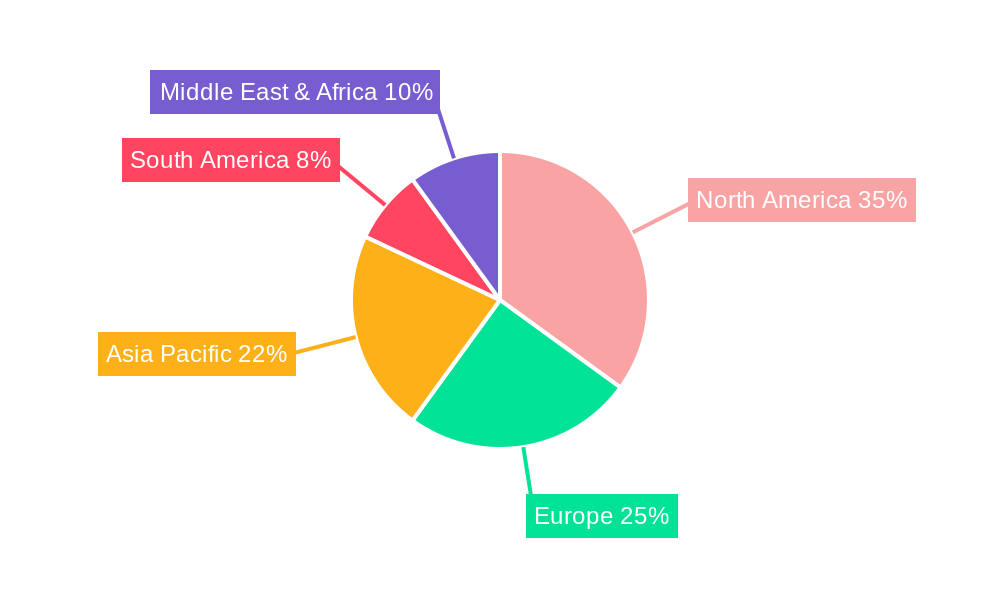
The market is segmented into distinct application and type categories, reflecting diverse user needs and technological capabilities. In terms of applications, Health Monitoring is expected to dominate, driven by the widespread use of biosensors for tracking vital signs, activity levels, and physiological parameters. Drug Delivery is another rapidly growing segment, offering innovative solutions for transdermal drug administration. The diagnosis segment is also gaining traction as smart patches evolve to incorporate diagnostic capabilities. Geographically, North America, particularly the United States, is anticipated to lead the market, owing to its advanced healthcare infrastructure, high disposable income, and early adoption of new technologies. Asia Pacific is projected to witness the fastest growth, propelled by increasing healthcare expenditure, a large population base, and the burgeoning digital health ecosystem. While the market exhibits strong growth prospects, challenges such as data privacy concerns, regulatory hurdles, and the cost of advanced sensors may pose some restraint. However, ongoing research and development focused on miniaturization, improved sensor accuracy, and enhanced battery life are expected to mitigate these challenges and unlock further market potential.
Smart Patches Market Dynamics & Structure
The smart patches market is characterized by a dynamic landscape driven by continuous technological innovation and increasing demand for non-invasive health monitoring and drug delivery solutions. Market concentration is moderate, with key players like BioIntelliSence, iRhythm Technologies, and BioTelemetry holding significant shares, while emerging companies like Feeligreen and G-Tech are carving out niches. Technological innovation is a primary driver, fueled by advancements in biosensors, wireless communication, and miniaturization, enabling the development of sophisticated patch-based devices. Regulatory frameworks, while sometimes a barrier, also foster trust and adoption by ensuring product safety and efficacy. Competitive product substitutes, such as wearable devices and implantable sensors, are present but often lack the targeted, real-time data delivery capabilities of smart patches. End-user demographics are expanding beyond the traditional healthcare sector to include a growing consumer interest in personal wellness and preventative health. Mergers and acquisitions (M&A) are a notable trend, with larger companies acquiring innovative startups to expand their product portfolios and market reach. Tracxn Technologies and VivaLNK are actively involved in this ecosystem.
- Market Concentration: Moderate, with a blend of established players and emerging innovators.
- Technological Innovation Drivers: Advancements in biosensing, IoT connectivity, and miniaturization.
- Regulatory Frameworks: FDA and CE marking approvals are critical for market entry and user confidence.
- Competitive Product Substitutes: Smartwatches, fitness trackers, implantable devices.
- End-User Demographics: Patients with chronic conditions, athletes, elderly individuals, general wellness consumers.
- M&A Trends: Strategic acquisitions by larger medical device companies to enhance technological capabilities and market penetration.
Smart Patches Growth Trends & Insights
The global smart patches market is poised for substantial growth, projected to evolve from an estimated 3,500 million units in the base year 2025 to over 8,000 million units by 2033, exhibiting a robust Compound Annual Growth Rate (CAGR) of approximately 11%. This upward trajectory is underpinned by escalating adoption rates across healthcare, driven by the demand for continuous, remote patient monitoring and personalized treatment regimens. The historical period (2019-2024) witnessed initial market penetration, with early adopters embracing the convenience and data-rich insights offered by smart patch technology. As we move into the forecast period (2025-2033), technological disruptions will continue to reshape the market. Miniaturization of sensors, enhanced power efficiency, and the integration of artificial intelligence (AI) for predictive analytics are key advancements expected to accelerate adoption. Consumer behavior shifts towards proactive health management and a preference for non-intrusive wearable solutions further bolster market expansion. The ability of smart patches to capture real-time physiological data for conditions like cardiovascular diseases, diabetes management (e.g., Insulet Corporation's advancements), and neurological disorders is a significant catalyst. Furthermore, the development of smart patches for targeted drug delivery, offering precise dosing and reduced side effects, is opening new avenues for market growth. The increasing prevalence of chronic diseases globally, coupled with an aging population, creates a sustained demand for effective monitoring and treatment solutions, positioning smart patches as a pivotal technology in the future of healthcare. The market penetration is expected to move from approximately 15% in 2025 to over 30% by 2033, as awareness and affordability increase.
Dominant Regions, Countries, or Segments in Smart Patches
The Health Monitoring application segment is the dominant force driving the smart patches market globally, projected to command over 60% of the market share by 2033. This dominance is primarily fueled by the burgeoning demand for continuous and remote patient monitoring, especially for chronic conditions such as cardiovascular diseases, diabetes, and respiratory ailments. North America, particularly the United States, leads this segment due to its advanced healthcare infrastructure, high disposable income, and early adoption of innovative medical technologies. The region's robust reimbursement policies for remote patient monitoring further incentivize both healthcare providers and patients to utilize smart patch solutions.
- North America Dominance: High adoption rates driven by strong healthcare systems, favorable reimbursement policies, and a high prevalence of chronic diseases. The US market alone is expected to account for approximately 45% of global smart patch consumption by 2033.
- Europe's Growing Influence: A significant contributor to market growth, driven by an aging population, a strong emphasis on preventative healthcare, and increasing investment in digital health solutions. Countries like Germany, the UK, and France are at the forefront.
- Asia Pacific's Rapid Expansion: The fastest-growing region, propelled by a large and aging population, increasing healthcare expenditure, and a growing middle class with a greater awareness of health and wellness. China and India are key markets within this region.
Within the Health Monitoring application, the Body Wear type is gaining significant traction due to its versatility and ability to capture a wider range of physiological data compared to wrist-worn devices. While Wrist/Hand Wear holds a substantial market share currently, the convenience and discreetness of body-worn patches for continuous monitoring of vital signs, ECG, and temperature are expected to drive their faster growth.
- Body Wear Growth Drivers: Superior data acquisition capabilities for comprehensive health tracking, comfort for continuous wear, and suitability for diverse patient populations, including elderly and immobile individuals. This segment is projected to grow at a CAGR of 13% from 2025-2033.
- Wrist/Hand Wear Market Share: Continues to be a significant segment due to its established presence in the wearable market and user familiarity. However, its growth rate is expected to be slightly lower than body wear, around 9% CAGR.
- Application Dominance Factors: The critical need for early detection, personalized treatment, and efficient management of chronic diseases makes health monitoring the primary application. Diagnosis and drug delivery segments, while important, are still in earlier stages of widespread adoption for patch-based solutions.
Smart Patches Product Landscape
The smart patches market is defined by a diverse range of product innovations focused on enhanced functionality, user comfort, and data accuracy. Companies are developing advanced biosensors capable of real-time measurement of vital signs, biochemical markers, and even neurological activity. These patches are increasingly characterized by their miniaturized form factor, flexible materials, and wireless connectivity, enabling seamless data transmission to smartphones or cloud platforms for analysis. Notable technological advancements include the integration of AI for predictive diagnostics and personalized treatment recommendations, improving the overall performance and utility of these devices. The unique selling propositions often revolve around non-invasiveness, continuous monitoring capabilities, and the ability to provide actionable health insights.
Key Drivers, Barriers & Challenges in Smart Patches
The smart patches market is propelled by several key drivers, including the escalating global prevalence of chronic diseases, an aging population demanding continuous health monitoring, and a growing consumer inclination towards preventative healthcare and personalized wellness. Technological advancements in miniaturized sensors, wireless connectivity, and AI for data analysis further fuel market expansion. The increasing acceptance of telemedicine and remote patient monitoring by healthcare providers and payers also acts as a significant growth accelerator.
However, the market faces notable barriers and challenges. High manufacturing costs associated with advanced sensors and materials can limit affordability and widespread adoption, particularly in developing economies. Stringent regulatory approval processes for medical devices, while essential for safety, can lead to prolonged market entry timelines. Data privacy and security concerns surrounding the collection and transmission of sensitive health information are also critical challenges that need to be addressed to build user trust. Furthermore, competition from established wearable device manufacturers and the need for effective user education on the proper use and benefits of smart patches present ongoing hurdles. Supply chain disruptions for critical components can also impact production and availability.
Emerging Opportunities in Smart Patches
Emerging opportunities in the smart patches market lie in the expansion of applications beyond traditional health monitoring. The development of patches for pain management, wound healing, and mental wellness tracking presents significant untapped potential. The integration of smart patches with advanced drug delivery systems, offering real-time feedback and automated dosing adjustments, is another promising avenue. Furthermore, the increasing demand for personalized medicine and preventative care creates a fertile ground for highly specialized patches tailored to individual genetic predispositions or specific lifestyle needs. Collaborations between technology companies, pharmaceutical firms, and research institutions are expected to unlock new applications and enhance product capabilities. The growth of the digital health ecosystem and the increasing comfort of consumers with wearable technology will continue to drive innovation and adoption.
Growth Accelerators in the Smart Patches Industry
Several catalysts are driving long-term growth in the smart patches industry. Continuous technological breakthroughs in biosensor accuracy, power efficiency, and miniaturization are making patches more sophisticated and user-friendly. Strategic partnerships between medical device manufacturers, pharmaceutical companies, and technology giants are accelerating product development and market penetration, fostering cross-industry innovation. The increasing adoption of value-based healthcare models, which emphasize outcomes and patient engagement, further incentivizes the use of smart patches for proactive health management and chronic disease care. Market expansion into emerging economies, coupled with a growing awareness of digital health solutions, will also contribute significantly to sustained growth.
Key Players Shaping the Smart Patches Market
- BioIntelliSence
- iRhythm Technologies
- BioTelemetry
- Feeligreen
- G-Tech
- GENTAG
- The IONTO Team
- Insulet Corporation
- Tracxn Technologies
- VivaLNK
Notable Milestones in Smart Patches Sector
- 2021: iRhythm Technologies receives FDA clearance for its Zio Patch XT, enabling continuous cardiac monitoring for up to 14 days.
- 2022: BioIntelliSence launches its Viita Patch, a wearable device for continuous multi-vital sign monitoring.
- 2022: Insulet Corporation advances its Omnipod system, integrating patch pump technology with continuous glucose monitoring.
- 2023: Feeligreen introduces its innovative pain management patches utilizing microcurrent technology.
- 2023: G-Tech and GENTAG collaborate on developing advanced wearable solutions for infectious disease monitoring.
- 2024: The IONTO Team showcases advancements in transdermal drug delivery patches with enhanced absorption capabilities.
- 2024: VivaLNK announces new partnerships to expand its flexible sensor technology into broader healthcare applications.
In-Depth Smart Patches Market Outlook
The future of the smart patches market is exceptionally promising, driven by an unrelenting pursuit of innovation and an increasing global demand for personalized, proactive healthcare solutions. Growth accelerators such as breakthroughs in wearable sensor technology, seamless integration with AI-powered analytics platforms, and strategic alliances between industry leaders will continue to propel the market forward. The shift towards remote patient monitoring and telehealth, further solidified by recent global health events, provides a strong foundation for the widespread adoption of smart patches. Untapped markets in chronic disease management, preventative wellness, and even specialized therapeutic applications offer significant avenues for expansion. The market is poised to move beyond mere data collection to delivering actionable insights and personalized interventions, truly revolutionizing how individuals manage their health and well-being.
Smart Patches Segmentation
-
1. Application
- 1.1. Health Monitoring
- 1.2. Drug Delivery
- 1.3. Diagnosis
-
2. Type
- 2.1. Wrist/Hand Wear
- 2.2. Body Wear
Smart Patches Segmentation By Geography
-
1. North America
- 1.1. United States
- 1.2. Canada
- 1.3. Mexico
-
2. South America
- 2.1. Brazil
- 2.2. Argentina
- 2.3. Rest of South America
-
3. Europe
- 3.1. United Kingdom
- 3.2. Germany
- 3.3. France
- 3.4. Italy
- 3.5. Spain
- 3.6. Russia
- 3.7. Benelux
- 3.8. Nordics
- 3.9. Rest of Europe
-
4. Middle East & Africa
- 4.1. Turkey
- 4.2. Israel
- 4.3. GCC
- 4.4. North Africa
- 4.5. South Africa
- 4.6. Rest of Middle East & Africa
-
5. Asia Pacific
- 5.1. China
- 5.2. India
- 5.3. Japan
- 5.4. South Korea
- 5.5. ASEAN
- 5.6. Oceania
- 5.7. Rest of Asia Pacific
Smart Patches REPORT HIGHLIGHTS
| Aspects | Details |
|---|---|
| Study Period | 2019-2033 |
| Base Year | 2024 |
| Estimated Year | 2025 |
| Forecast Period | 2025-2033 |
| Historical Period | 2019-2024 |
| Growth Rate | CAGR of XXX% from 2019-2033 |
| Segmentation |
|
Table of Contents
- 1. Introduction
- 1.1. Research Scope
- 1.2. Market Segmentation
- 1.3. Research Methodology
- 1.4. Definitions and Assumptions
- 2. Executive Summary
- 2.1. Introduction
- 3. Market Dynamics
- 3.1. Introduction
- 3.2. Market Drivers
- 3.3. Market Restrains
- 3.4. Market Trends
- 4. Market Factor Analysis
- 4.1. Porters Five Forces
- 4.2. Supply/Value Chain
- 4.3. PESTEL analysis
- 4.4. Market Entropy
- 4.5. Patent/Trademark Analysis
- 5. Global Smart Patches Analysis, Insights and Forecast, 2019-2031
- 5.1. Market Analysis, Insights and Forecast - by Application
- 5.1.1. Health Monitoring
- 5.1.2. Drug Delivery
- 5.1.3. Diagnosis
- 5.2. Market Analysis, Insights and Forecast - by Type
- 5.2.1. Wrist/Hand Wear
- 5.2.2. Body Wear
- 5.3. Market Analysis, Insights and Forecast - by Region
- 5.3.1. North America
- 5.3.2. South America
- 5.3.3. Europe
- 5.3.4. Middle East & Africa
- 5.3.5. Asia Pacific
- 5.1. Market Analysis, Insights and Forecast - by Application
- 6. North America Smart Patches Analysis, Insights and Forecast, 2019-2031
- 6.1. Market Analysis, Insights and Forecast - by Application
- 6.1.1. Health Monitoring
- 6.1.2. Drug Delivery
- 6.1.3. Diagnosis
- 6.2. Market Analysis, Insights and Forecast - by Type
- 6.2.1. Wrist/Hand Wear
- 6.2.2. Body Wear
- 6.1. Market Analysis, Insights and Forecast - by Application
- 7. South America Smart Patches Analysis, Insights and Forecast, 2019-2031
- 7.1. Market Analysis, Insights and Forecast - by Application
- 7.1.1. Health Monitoring
- 7.1.2. Drug Delivery
- 7.1.3. Diagnosis
- 7.2. Market Analysis, Insights and Forecast - by Type
- 7.2.1. Wrist/Hand Wear
- 7.2.2. Body Wear
- 7.1. Market Analysis, Insights and Forecast - by Application
- 8. Europe Smart Patches Analysis, Insights and Forecast, 2019-2031
- 8.1. Market Analysis, Insights and Forecast - by Application
- 8.1.1. Health Monitoring
- 8.1.2. Drug Delivery
- 8.1.3. Diagnosis
- 8.2. Market Analysis, Insights and Forecast - by Type
- 8.2.1. Wrist/Hand Wear
- 8.2.2. Body Wear
- 8.1. Market Analysis, Insights and Forecast - by Application
- 9. Middle East & Africa Smart Patches Analysis, Insights and Forecast, 2019-2031
- 9.1. Market Analysis, Insights and Forecast - by Application
- 9.1.1. Health Monitoring
- 9.1.2. Drug Delivery
- 9.1.3. Diagnosis
- 9.2. Market Analysis, Insights and Forecast - by Type
- 9.2.1. Wrist/Hand Wear
- 9.2.2. Body Wear
- 9.1. Market Analysis, Insights and Forecast - by Application
- 10. Asia Pacific Smart Patches Analysis, Insights and Forecast, 2019-2031
- 10.1. Market Analysis, Insights and Forecast - by Application
- 10.1.1. Health Monitoring
- 10.1.2. Drug Delivery
- 10.1.3. Diagnosis
- 10.2. Market Analysis, Insights and Forecast - by Type
- 10.2.1. Wrist/Hand Wear
- 10.2.2. Body Wear
- 10.1. Market Analysis, Insights and Forecast - by Application
- 11. Competitive Analysis
- 11.1. Global Market Share Analysis 2024
- 11.2. Company Profiles
- 11.2.1 BioIntelliSence
- 11.2.1.1. Overview
- 11.2.1.2. Products
- 11.2.1.3. SWOT Analysis
- 11.2.1.4. Recent Developments
- 11.2.1.5. Financials (Based on Availability)
- 11.2.2 iRhythm Technologies
- 11.2.2.1. Overview
- 11.2.2.2. Products
- 11.2.2.3. SWOT Analysis
- 11.2.2.4. Recent Developments
- 11.2.2.5. Financials (Based on Availability)
- 11.2.3 BioTelemetry
- 11.2.3.1. Overview
- 11.2.3.2. Products
- 11.2.3.3. SWOT Analysis
- 11.2.3.4. Recent Developments
- 11.2.3.5. Financials (Based on Availability)
- 11.2.4 Feeligreen
- 11.2.4.1. Overview
- 11.2.4.2. Products
- 11.2.4.3. SWOT Analysis
- 11.2.4.4. Recent Developments
- 11.2.4.5. Financials (Based on Availability)
- 11.2.5 G-Tech
- 11.2.5.1. Overview
- 11.2.5.2. Products
- 11.2.5.3. SWOT Analysis
- 11.2.5.4. Recent Developments
- 11.2.5.5. Financials (Based on Availability)
- 11.2.6 GENTAG
- 11.2.6.1. Overview
- 11.2.6.2. Products
- 11.2.6.3. SWOT Analysis
- 11.2.6.4. Recent Developments
- 11.2.6.5. Financials (Based on Availability)
- 11.2.7 The IONTO Team
- 11.2.7.1. Overview
- 11.2.7.2. Products
- 11.2.7.3. SWOT Analysis
- 11.2.7.4. Recent Developments
- 11.2.7.5. Financials (Based on Availability)
- 11.2.8 Insulet Corporation
- 11.2.8.1. Overview
- 11.2.8.2. Products
- 11.2.8.3. SWOT Analysis
- 11.2.8.4. Recent Developments
- 11.2.8.5. Financials (Based on Availability)
- 11.2.9 Tracxn Technologies
- 11.2.9.1. Overview
- 11.2.9.2. Products
- 11.2.9.3. SWOT Analysis
- 11.2.9.4. Recent Developments
- 11.2.9.5. Financials (Based on Availability)
- 11.2.10 VivaLNK
- 11.2.10.1. Overview
- 11.2.10.2. Products
- 11.2.10.3. SWOT Analysis
- 11.2.10.4. Recent Developments
- 11.2.10.5. Financials (Based on Availability)
- 11.2.1 BioIntelliSence
List of Figures
- Figure 1: Global Smart Patches Revenue Breakdown (million, %) by Region 2024 & 2032
- Figure 2: North America Smart Patches Revenue (million), by Application 2024 & 2032
- Figure 3: North America Smart Patches Revenue Share (%), by Application 2024 & 2032
- Figure 4: North America Smart Patches Revenue (million), by Type 2024 & 2032
- Figure 5: North America Smart Patches Revenue Share (%), by Type 2024 & 2032
- Figure 6: North America Smart Patches Revenue (million), by Country 2024 & 2032
- Figure 7: North America Smart Patches Revenue Share (%), by Country 2024 & 2032
- Figure 8: South America Smart Patches Revenue (million), by Application 2024 & 2032
- Figure 9: South America Smart Patches Revenue Share (%), by Application 2024 & 2032
- Figure 10: South America Smart Patches Revenue (million), by Type 2024 & 2032
- Figure 11: South America Smart Patches Revenue Share (%), by Type 2024 & 2032
- Figure 12: South America Smart Patches Revenue (million), by Country 2024 & 2032
- Figure 13: South America Smart Patches Revenue Share (%), by Country 2024 & 2032
- Figure 14: Europe Smart Patches Revenue (million), by Application 2024 & 2032
- Figure 15: Europe Smart Patches Revenue Share (%), by Application 2024 & 2032
- Figure 16: Europe Smart Patches Revenue (million), by Type 2024 & 2032
- Figure 17: Europe Smart Patches Revenue Share (%), by Type 2024 & 2032
- Figure 18: Europe Smart Patches Revenue (million), by Country 2024 & 2032
- Figure 19: Europe Smart Patches Revenue Share (%), by Country 2024 & 2032
- Figure 20: Middle East & Africa Smart Patches Revenue (million), by Application 2024 & 2032
- Figure 21: Middle East & Africa Smart Patches Revenue Share (%), by Application 2024 & 2032
- Figure 22: Middle East & Africa Smart Patches Revenue (million), by Type 2024 & 2032
- Figure 23: Middle East & Africa Smart Patches Revenue Share (%), by Type 2024 & 2032
- Figure 24: Middle East & Africa Smart Patches Revenue (million), by Country 2024 & 2032
- Figure 25: Middle East & Africa Smart Patches Revenue Share (%), by Country 2024 & 2032
- Figure 26: Asia Pacific Smart Patches Revenue (million), by Application 2024 & 2032
- Figure 27: Asia Pacific Smart Patches Revenue Share (%), by Application 2024 & 2032
- Figure 28: Asia Pacific Smart Patches Revenue (million), by Type 2024 & 2032
- Figure 29: Asia Pacific Smart Patches Revenue Share (%), by Type 2024 & 2032
- Figure 30: Asia Pacific Smart Patches Revenue (million), by Country 2024 & 2032
- Figure 31: Asia Pacific Smart Patches Revenue Share (%), by Country 2024 & 2032
List of Tables
- Table 1: Global Smart Patches Revenue million Forecast, by Region 2019 & 2032
- Table 2: Global Smart Patches Revenue million Forecast, by Application 2019 & 2032
- Table 3: Global Smart Patches Revenue million Forecast, by Type 2019 & 2032
- Table 4: Global Smart Patches Revenue million Forecast, by Region 2019 & 2032
- Table 5: Global Smart Patches Revenue million Forecast, by Application 2019 & 2032
- Table 6: Global Smart Patches Revenue million Forecast, by Type 2019 & 2032
- Table 7: Global Smart Patches Revenue million Forecast, by Country 2019 & 2032
- Table 8: United States Smart Patches Revenue (million) Forecast, by Application 2019 & 2032
- Table 9: Canada Smart Patches Revenue (million) Forecast, by Application 2019 & 2032
- Table 10: Mexico Smart Patches Revenue (million) Forecast, by Application 2019 & 2032
- Table 11: Global Smart Patches Revenue million Forecast, by Application 2019 & 2032
- Table 12: Global Smart Patches Revenue million Forecast, by Type 2019 & 2032
- Table 13: Global Smart Patches Revenue million Forecast, by Country 2019 & 2032
- Table 14: Brazil Smart Patches Revenue (million) Forecast, by Application 2019 & 2032
- Table 15: Argentina Smart Patches Revenue (million) Forecast, by Application 2019 & 2032
- Table 16: Rest of South America Smart Patches Revenue (million) Forecast, by Application 2019 & 2032
- Table 17: Global Smart Patches Revenue million Forecast, by Application 2019 & 2032
- Table 18: Global Smart Patches Revenue million Forecast, by Type 2019 & 2032
- Table 19: Global Smart Patches Revenue million Forecast, by Country 2019 & 2032
- Table 20: United Kingdom Smart Patches Revenue (million) Forecast, by Application 2019 & 2032
- Table 21: Germany Smart Patches Revenue (million) Forecast, by Application 2019 & 2032
- Table 22: France Smart Patches Revenue (million) Forecast, by Application 2019 & 2032
- Table 23: Italy Smart Patches Revenue (million) Forecast, by Application 2019 & 2032
- Table 24: Spain Smart Patches Revenue (million) Forecast, by Application 2019 & 2032
- Table 25: Russia Smart Patches Revenue (million) Forecast, by Application 2019 & 2032
- Table 26: Benelux Smart Patches Revenue (million) Forecast, by Application 2019 & 2032
- Table 27: Nordics Smart Patches Revenue (million) Forecast, by Application 2019 & 2032
- Table 28: Rest of Europe Smart Patches Revenue (million) Forecast, by Application 2019 & 2032
- Table 29: Global Smart Patches Revenue million Forecast, by Application 2019 & 2032
- Table 30: Global Smart Patches Revenue million Forecast, by Type 2019 & 2032
- Table 31: Global Smart Patches Revenue million Forecast, by Country 2019 & 2032
- Table 32: Turkey Smart Patches Revenue (million) Forecast, by Application 2019 & 2032
- Table 33: Israel Smart Patches Revenue (million) Forecast, by Application 2019 & 2032
- Table 34: GCC Smart Patches Revenue (million) Forecast, by Application 2019 & 2032
- Table 35: North Africa Smart Patches Revenue (million) Forecast, by Application 2019 & 2032
- Table 36: South Africa Smart Patches Revenue (million) Forecast, by Application 2019 & 2032
- Table 37: Rest of Middle East & Africa Smart Patches Revenue (million) Forecast, by Application 2019 & 2032
- Table 38: Global Smart Patches Revenue million Forecast, by Application 2019 & 2032
- Table 39: Global Smart Patches Revenue million Forecast, by Type 2019 & 2032
- Table 40: Global Smart Patches Revenue million Forecast, by Country 2019 & 2032
- Table 41: China Smart Patches Revenue (million) Forecast, by Application 2019 & 2032
- Table 42: India Smart Patches Revenue (million) Forecast, by Application 2019 & 2032
- Table 43: Japan Smart Patches Revenue (million) Forecast, by Application 2019 & 2032
- Table 44: South Korea Smart Patches Revenue (million) Forecast, by Application 2019 & 2032
- Table 45: ASEAN Smart Patches Revenue (million) Forecast, by Application 2019 & 2032
- Table 46: Oceania Smart Patches Revenue (million) Forecast, by Application 2019 & 2032
- Table 47: Rest of Asia Pacific Smart Patches Revenue (million) Forecast, by Application 2019 & 2032
Frequently Asked Questions
1. What is the projected Compound Annual Growth Rate (CAGR) of the Smart Patches?
The projected CAGR is approximately XXX%.
2. Which companies are prominent players in the Smart Patches?
Key companies in the market include BioIntelliSence, iRhythm Technologies, BioTelemetry, Feeligreen, G-Tech, GENTAG, The IONTO Team, Insulet Corporation, Tracxn Technologies, VivaLNK.
3. What are the main segments of the Smart Patches?
The market segments include Application, Type.
4. Can you provide details about the market size?
The market size is estimated to be USD XXX million as of 2022.
5. What are some drivers contributing to market growth?
N/A
6. What are the notable trends driving market growth?
N/A
7. Are there any restraints impacting market growth?
N/A
8. Can you provide examples of recent developments in the market?
N/A
9. What pricing options are available for accessing the report?
Pricing options include single-user, multi-user, and enterprise licenses priced at USD 4250.00, USD 6375.00, and USD 8500.00 respectively.
10. Is the market size provided in terms of value or volume?
The market size is provided in terms of value, measured in million.
11. Are there any specific market keywords associated with the report?
Yes, the market keyword associated with the report is "Smart Patches," which aids in identifying and referencing the specific market segment covered.
12. How do I determine which pricing option suits my needs best?
The pricing options vary based on user requirements and access needs. Individual users may opt for single-user licenses, while businesses requiring broader access may choose multi-user or enterprise licenses for cost-effective access to the report.
13. Are there any additional resources or data provided in the Smart Patches report?
While the report offers comprehensive insights, it's advisable to review the specific contents or supplementary materials provided to ascertain if additional resources or data are available.
14. How can I stay updated on further developments or reports in the Smart Patches?
To stay informed about further developments, trends, and reports in the Smart Patches, consider subscribing to industry newsletters, following relevant companies and organizations, or regularly checking reputable industry news sources and publications.
Methodology
Step 1 - Identification of Relevant Samples Size from Population Database


Step 2 - Approaches for Defining Global Market Size (Value, Volume* & Price*)

Note*: In applicable scenarios
Step 3 - Data Sources
Primary Research
- Web Analytics
- Survey Reports
- Research Institute
- Latest Research Reports
- Opinion Leaders
Secondary Research
- Annual Reports
- White Paper
- Latest Press Release
- Industry Association
- Paid Database
- Investor Presentations

Step 4 - Data Triangulation
Involves using different sources of information in order to increase the validity of a study
These sources are likely to be stakeholders in a program - participants, other researchers, program staff, other community members, and so on.
Then we put all data in single framework & apply various statistical tools to find out the dynamic on the market.
During the analysis stage, feedback from the stakeholder groups would be compared to determine areas of agreement as well as areas of divergence


