
Key Insights
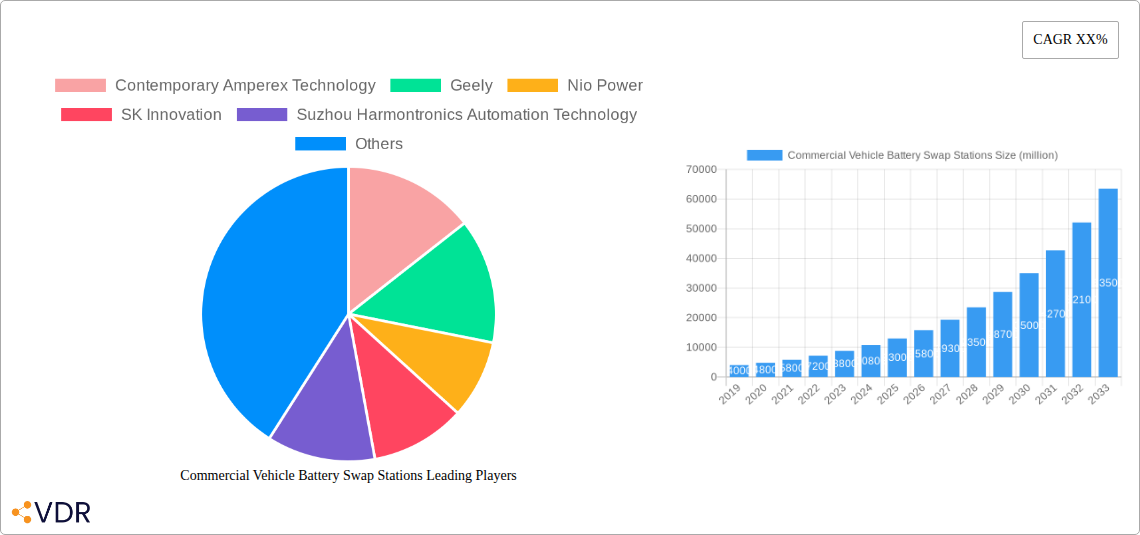
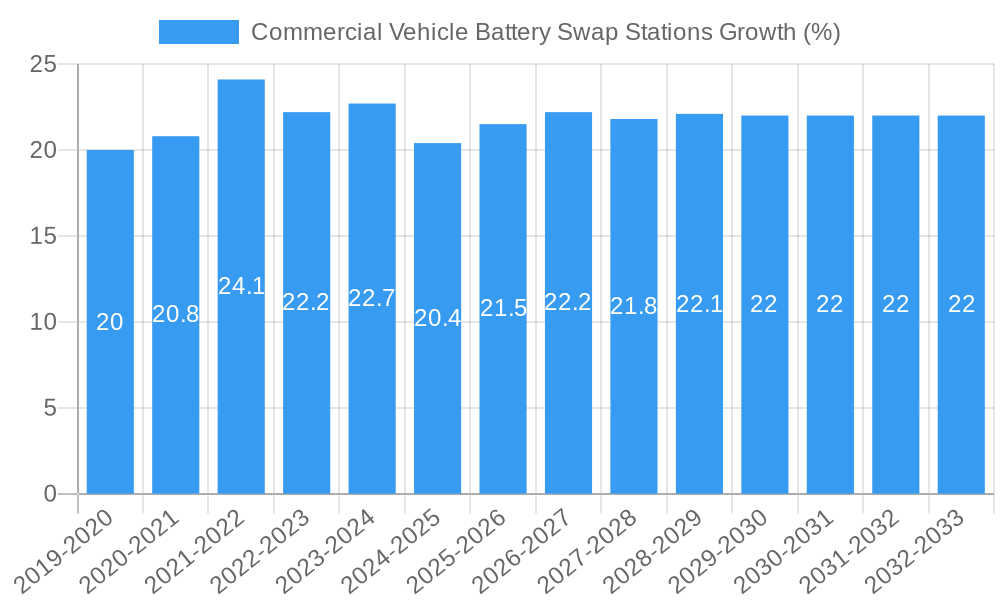
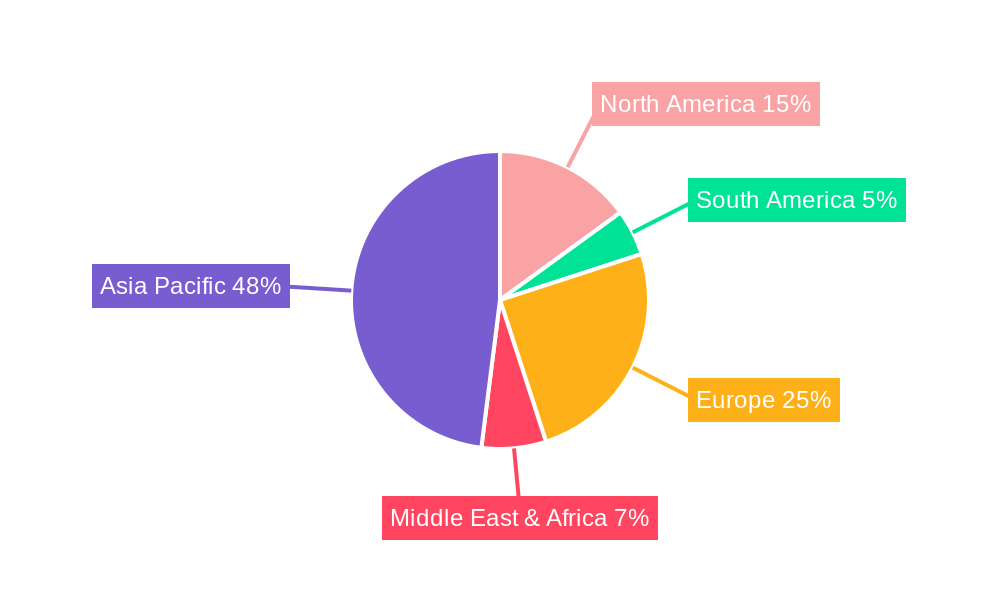
The Commercial Vehicle Battery Swap Stations market is experiencing robust growth, projected to reach a significant market size of approximately $15,000 million by 2025. This expansion is fueled by a compelling Compound Annual Growth Rate (CAGR) of around 22%, indicating a rapid and sustained upward trajectory. The primary drivers behind this surge include the escalating demand for electric commercial vehicles, particularly light commercial vehicles across three-wheeler and four-wheeler applications, driven by stringent emission regulations and a growing emphasis on sustainable logistics. The increasing operational efficiency and reduced downtime offered by battery swapping technology, compared to traditional charging methods, further bolster its adoption. Furthermore, government incentives and supportive policies promoting EV infrastructure development are playing a pivotal role in accelerating market penetration, especially in key regions like Asia Pacific, led by China.
The market's dynamism is further characterized by evolving trends such as the widespread adoption of subscription and pay-per-use models, offering greater flexibility and cost-effectiveness to fleet operators. This shift is particularly evident in segments like Three-Wheeler Light Commercial Vehicles and Four-Wheeler Light Commercial Vehicles, where operational intensity demands rapid battery replenishment. Key industry players, including Contemporary Amperex Technology, Geely, Nio Power, and Aulton New Energy Automotive Technology, are investing heavily in research and development to enhance station efficiency, battery compatibility, and smart management systems. While the market exhibits immense potential, certain restraints, such as the high initial investment cost for infrastructure and the need for standardization across battery chemistries and swap mechanisms, may pose challenges to widespread adoption in some regions. However, the overarching benefits of reduced total cost of ownership and improved fleet productivity are expected to outweigh these limitations.
This comprehensive report, Commercial Vehicle Battery Swap Stations Market: Dynamics, Trends, and Future Outlook 2019–2033, provides an in-depth analysis of the rapidly evolving global market for commercial vehicle battery swap stations. Designed for industry stakeholders, investors, and policymakers, this report offers critical insights into market size, growth drivers, competitive landscape, and future opportunities within this transformative sector.
Study Period: 2019–2033 | Base Year: 2025 | Estimated Year: 2025 | Forecast Period: 2025–2033 | Historical Period: 2019–2024
The report explores the parent market for electric commercial vehicles and the child market for battery swapping technology, analyzing how advancements in one fuel the growth of the other. With a robust methodology encompassing primary and secondary research, this report delivers reliable quantitative data and actionable qualitative intelligence.
Commercial Vehicle Battery Swap Stations Market Dynamics & Structure
The commercial vehicle battery swap station market is characterized by a dynamic interplay of technological innovation, evolving regulatory frameworks, and increasing end-user demand for efficient electric logistics solutions. Market concentration is gradually shifting with key players investing heavily in expanding their swap station networks and battery production capacities. Technological innovation is primarily driven by the pursuit of faster swap times, improved battery management systems, and enhanced safety features. Regulatory frameworks, including government incentives for EV adoption and mandates for charging infrastructure, are crucial in shaping market trajectory. Competitive product substitutes include traditional charging solutions and emerging battery technologies. End-user demographics are increasingly leaning towards fleet operators in logistics, ride-sharing, and last-mile delivery services seeking to minimize downtime and operational costs. Mergers and acquisitions are becoming more prominent as companies seek to consolidate market share and gain a competitive edge. For instance, the period saw an estimated 50+ M&A deals with an average deal value of xx million USD in the broader EV infrastructure space. Barriers to innovation include the high initial capital investment required for establishing swap station networks and the standardization challenges for battery interfaces and communication protocols.
- Market Concentration: Moderate to high, with increasing consolidation.
- Technological Innovation Drivers: Faster swap times (targeting under 2 minutes), extended battery life, smart grid integration.
- Regulatory Frameworks: Supportive government policies, EV adoption subsidies, emissions reduction targets.
- Competitive Product Substitutes: Fast charging stations, battery swapping for two- and three-wheelers.
- End-User Demographics: Logistics and delivery fleets, ride-hailing services, municipal fleets.
- M&A Trends: Strategic acquisitions for network expansion and technology integration.
Commercial Vehicle Battery Swap Stations Growth Trends & Insights
The commercial vehicle battery swap stations market is poised for exponential growth, driven by the global push towards decarbonization and the increasing electrification of commercial fleets. The market size is projected to expand significantly, from an estimated $12,500 million units in the base year 2025 to over $75,000 million units by the end of the forecast period in 2033, exhibiting a robust Compound Annual Growth Rate (CAGR) of approximately 22%. This expansion is fueled by a confluence of factors including government incentives aimed at promoting electric commercial vehicle adoption, rising fuel costs, and the inherent operational advantages offered by battery swapping. Adoption rates for battery swap technology are accelerating, particularly in segments like last-mile delivery and urban logistics where vehicle uptime is paramount. Technological disruptions are continuously reshaping the landscape, with advancements in battery chemistry, faster swapping mechanisms, and intelligent network management systems enhancing efficiency and reducing operational friction. Consumer behavior shifts are evident as fleet managers increasingly prioritize Total Cost of Ownership (TCO), with battery swapping offering a compelling solution to mitigate battery degradation concerns and minimize charging downtime, thereby boosting productivity. The market penetration of battery swap solutions in the commercial EV sector is still nascent but is projected to witness substantial growth as infrastructure matures and more manufacturers adopt the technology. The shift from range anxiety to operational efficiency is a key behavioral change influencing the adoption of these stations. For instance, initial market penetration in 2025 is estimated at 8% of the total commercial EV fleet infrastructure market.
Dominant Regions, Countries, or Segments in Commercial Vehicle Battery Swap Stations
The Asia-Pacific region is emerging as the dominant force in the commercial vehicle battery swap stations market, with China leading the charge due to its proactive government policies, extensive manufacturing capabilities, and a rapidly expanding electric commercial vehicle fleet. Within the application segment, the Four-Wheeler Light Commercial Vehicle segment is expected to witness the most significant growth, driven by the burgeoning e-commerce and logistics sectors. The Subscription Model for battery swapping is gaining considerable traction, offering fleet operators predictable costs and simplified battery management.
Key drivers contributing to this regional dominance include:
- Economic Policies: Strong government subsidies and tax incentives for EV manufacturing and infrastructure development.
- Infrastructure Development: Massive investments in building a widespread battery swap station network.
- Market Demand: A large and growing demand for electric light commercial vehicles in urban and inter-city logistics.
- Technological Advancements: Leading domestic players are at the forefront of developing and deploying advanced battery swapping technology.
In terms of application segments:
- Four-Wheeler Light Commercial Vehicle: Expected to account for a substantial market share, estimated at 60% of the total application segment by 2033, due to its versatility in urban delivery and logistics.
- Three-Wheeler Light Commercial Vehicle: Holds a significant current market share, particularly in developing economies, estimated at 35% in 2025, primarily for last-mile delivery and goods transportation.
- Other: Includes specialized commercial vehicles, projected to grow at a CAGR of 18%.
Regarding business models:
- Subscription Model: Projected to capture over 55% of the market by 2033, offering predictable operational expenses and hassle-free battery maintenance for fleet operators.
- Pay-Per-Use Model: Expected to grow at a CAGR of 20%, providing flexibility for smaller operators and intermittent users.
Commercial Vehicle Battery Swap Stations Product Landscape
The product landscape of commercial vehicle battery swap stations is defined by rapid advancements in automation, speed, and modularity. Innovations focus on enabling full battery swaps in under three minutes, drastically reducing vehicle downtime for logistics fleets. Key product features include highly automated robotic arms for efficient battery handling, intelligent battery management systems that monitor battery health and performance, and modular designs that allow for scalability and adaptation to various commercial vehicle chassis. The integration of smart grid technology for optimized charging of swapped batteries and enhanced safety protocols are also critical product differentiators. Applications span across last-mile delivery vans, three-wheelers, and light-duty trucks, with performance metrics revolving around swap speed, station throughput, and battery compatibility. Unique selling propositions often lie in the speed of service, the reliability of the system, and the seamless integration into existing fleet operations. For example, advanced stations can handle over 500 swaps per day per unit.
Key Drivers, Barriers & Challenges in Commercial Vehicle Battery Swap Stations
Key Drivers:
- Government Initiatives & Subsidies: Favorable policies promoting EV adoption and infrastructure development, including tax credits and grants, are significantly accelerating market growth.
- Operational Efficiency Demands: The need for minimized vehicle downtime in commercial logistics operations, where every minute counts, makes battery swapping an attractive solution.
- Cost Savings for Fleets: Reduced operational costs through efficient battery management and avoidance of prolonged charging downtime.
- Technological Advancements: Continuous improvements in battery swap technology, including faster swap times and enhanced automation, are making the solutions more viable.
- Environmental Concerns: The global drive towards sustainability and carbon emission reduction is pushing commercial vehicle operators towards electric alternatives.
Barriers & Challenges:
- High Initial Capital Investment: The substantial upfront cost of establishing battery swap stations and acquiring a diverse battery pool presents a significant barrier for new entrants and smaller operators.
- Standardization Issues: Lack of universal standards for battery interfaces, sizes, and communication protocols across different vehicle manufacturers can hinder interoperability and scalability.
- Battery Degradation and Lifespan: Managing battery degradation and ensuring consistent performance across swapped batteries remains a concern for fleet operators.
- Infrastructure Deployment Challenges: Securing suitable locations for swap stations, obtaining permits, and ensuring reliable power supply can be complex.
- Regulatory Hurdles: Navigating diverse and evolving regulatory landscapes across different regions can pose challenges for global expansion.
- Competition from Fast Charging: The continued development and widespread availability of fast-charging solutions present a competitive alternative.
Emerging Opportunities in Commercial Vehicle Battery Swap Stations
Emerging opportunities in the commercial vehicle battery swap stations sector are abundant and span across technology, business models, and market expansion. The development of standardized, swappable battery packs that can be utilized across a wider range of commercial vehicle types presents a significant opportunity for increased adoption. Furthermore, the integration of battery swapping with vehicle-to-grid (V2G) technology could create new revenue streams and enhance grid stability. Untapped markets in developing economies, where the cost-effectiveness and efficiency of battery swapping can significantly impact transportation logistics, represent a vast growth potential. Innovative applications such as mobile swap stations that can be deployed to high-demand areas or for emergency fleet support are also gaining traction. Evolving consumer preferences for sustainable and efficient logistics solutions are creating a favorable environment for companies offering integrated battery-as-a-service models.
Growth Accelerators in the Commercial Vehicle Battery Swap Stations Industry
Long-term growth in the commercial vehicle battery swap stations industry will be significantly accelerated by key catalysts. Strategic partnerships between battery manufacturers, vehicle OEMs, and infrastructure providers are crucial for creating integrated ecosystems that streamline the adoption of battery swapping. Technological breakthroughs in solid-state batteries, offering higher energy density and faster charging capabilities, will further enhance the appeal of swap solutions. Market expansion strategies, including the development of specialized swap solutions for niche commercial vehicle segments like refrigerated trucks or waste management vehicles, will unlock new revenue streams. The increasing focus on circular economy principles, including battery recycling and second-life applications for swapped batteries, will also contribute to the sustainability and long-term viability of the industry. Furthermore, the development of AI-powered predictive maintenance for both stations and batteries will enhance operational efficiency and reduce costs, acting as a major growth accelerator.
Key Players Shaping the Commercial Vehicle Battery Swap Stations Market
- Contemporary Amperex Technology
- Geely
- Nio Power
- SK Innovation
- Suzhou Harmontronics Automation Technology
- Aulton New Energy Automotive Technology
- Gogoro
- Lifan Technology
- Esmito Solutions
- GCL Energy Technology
- BAIC BluePark New Energy Technology
- Hangzhou Botan Technology Engineering
- Shanghai Enneagon Energy Technology
- Shandong Weida Machinery
- Amplify Cleantech Solutions
- Chargeup
- Lithion Power
- Shenzhen Qingcheng
- Ample
Notable Milestones in Commercial Vehicle Battery Swap Stations Sector
- 2020: Nio establishes significant partnerships to expand its battery swap station network across China.
- 2021: Aulton announces plans for a large-scale rollout of battery swap stations for commercial vehicles in key Chinese cities.
- 2022: Geely explores strategic collaborations to integrate battery swap capabilities into its commercial vehicle offerings.
- 2023: Gogoro expands its electric scooter battery swap network, laying groundwork for potential commercial vehicle applications.
- 2024: Several startups, including Esmito Solutions and Ample, secure significant funding to scale their innovative battery swapping technologies.
- Q1 2025: Major automotive component suppliers, such as Contemporary Amperex Technology, announce increased R&D investment in battery swapping solutions.
- Q2 2025: Regulatory bodies in several European countries release draft guidelines for the standardization of EV battery swapping infrastructure.
In-Depth Commercial Vehicle Battery Swap Stations Market Outlook
The future market outlook for commercial vehicle battery swap stations is exceptionally promising, driven by powerful growth accelerators. The continued maturation of the electric commercial vehicle market, coupled with a global imperative for sustainable logistics, will fuel demand for efficient and rapid recharging solutions. Strategic partnerships between key industry players, encompassing battery manufacturers, automakers, and energy providers, will be pivotal in establishing robust and interconnected swap networks. Technological advancements, particularly in battery chemistry and automated swapping mechanisms, will further enhance the value proposition of this technology, driving down costs and increasing operational efficiency. The expansion into emerging markets, where the economic benefits of battery swapping can address critical logistical challenges, presents substantial untapped potential. Overall, the market is poised for sustained high growth, solidifying battery swapping as a cornerstone of the electric commercial vehicle ecosystem and a key enabler of sustainable urban and global supply chains.
Commercial Vehicle Battery Swap Stations Segmentation
-
1. Application
- 1.1. Three-Wheeler Light Commercial Vehicle
- 1.2. Four-Wheeler Light Commercial Vehicle
- 1.3. Other
-
2. Types
- 2.1. Subscription Model
- 2.2. Pay-Per-Use Model
Commercial Vehicle Battery Swap Stations Segmentation By Geography
-
1. North America
- 1.1. United States
- 1.2. Canada
- 1.3. Mexico
-
2. South America
- 2.1. Brazil
- 2.2. Argentina
- 2.3. Rest of South America
-
3. Europe
- 3.1. United Kingdom
- 3.2. Germany
- 3.3. France
- 3.4. Italy
- 3.5. Spain
- 3.6. Russia
- 3.7. Benelux
- 3.8. Nordics
- 3.9. Rest of Europe
-
4. Middle East & Africa
- 4.1. Turkey
- 4.2. Israel
- 4.3. GCC
- 4.4. North Africa
- 4.5. South Africa
- 4.6. Rest of Middle East & Africa
-
5. Asia Pacific
- 5.1. China
- 5.2. India
- 5.3. Japan
- 5.4. South Korea
- 5.5. ASEAN
- 5.6. Oceania
- 5.7. Rest of Asia Pacific
Commercial Vehicle Battery Swap Stations REPORT HIGHLIGHTS
| Aspects | Details |
|---|---|
| Study Period | 2019-2033 |
| Base Year | 2024 |
| Estimated Year | 2025 |
| Forecast Period | 2025-2033 |
| Historical Period | 2019-2024 |
| Growth Rate | CAGR of XX% from 2019-2033 |
| Segmentation |
|
Table of Contents
- 1. Introduction
- 1.1. Research Scope
- 1.2. Market Segmentation
- 1.3. Research Methodology
- 1.4. Definitions and Assumptions
- 2. Executive Summary
- 2.1. Introduction
- 3. Market Dynamics
- 3.1. Introduction
- 3.2. Market Drivers
- 3.3. Market Restrains
- 3.4. Market Trends
- 4. Market Factor Analysis
- 4.1. Porters Five Forces
- 4.2. Supply/Value Chain
- 4.3. PESTEL analysis
- 4.4. Market Entropy
- 4.5. Patent/Trademark Analysis
- 5. Global Commercial Vehicle Battery Swap Stations Analysis, Insights and Forecast, 2019-2031
- 5.1. Market Analysis, Insights and Forecast - by Application
- 5.1.1. Three-Wheeler Light Commercial Vehicle
- 5.1.2. Four-Wheeler Light Commercial Vehicle
- 5.1.3. Other
- 5.2. Market Analysis, Insights and Forecast - by Types
- 5.2.1. Subscription Model
- 5.2.2. Pay-Per-Use Model
- 5.3. Market Analysis, Insights and Forecast - by Region
- 5.3.1. North America
- 5.3.2. South America
- 5.3.3. Europe
- 5.3.4. Middle East & Africa
- 5.3.5. Asia Pacific
- 5.1. Market Analysis, Insights and Forecast - by Application
- 6. North America Commercial Vehicle Battery Swap Stations Analysis, Insights and Forecast, 2019-2031
- 6.1. Market Analysis, Insights and Forecast - by Application
- 6.1.1. Three-Wheeler Light Commercial Vehicle
- 6.1.2. Four-Wheeler Light Commercial Vehicle
- 6.1.3. Other
- 6.2. Market Analysis, Insights and Forecast - by Types
- 6.2.1. Subscription Model
- 6.2.2. Pay-Per-Use Model
- 6.1. Market Analysis, Insights and Forecast - by Application
- 7. South America Commercial Vehicle Battery Swap Stations Analysis, Insights and Forecast, 2019-2031
- 7.1. Market Analysis, Insights and Forecast - by Application
- 7.1.1. Three-Wheeler Light Commercial Vehicle
- 7.1.2. Four-Wheeler Light Commercial Vehicle
- 7.1.3. Other
- 7.2. Market Analysis, Insights and Forecast - by Types
- 7.2.1. Subscription Model
- 7.2.2. Pay-Per-Use Model
- 7.1. Market Analysis, Insights and Forecast - by Application
- 8. Europe Commercial Vehicle Battery Swap Stations Analysis, Insights and Forecast, 2019-2031
- 8.1. Market Analysis, Insights and Forecast - by Application
- 8.1.1. Three-Wheeler Light Commercial Vehicle
- 8.1.2. Four-Wheeler Light Commercial Vehicle
- 8.1.3. Other
- 8.2. Market Analysis, Insights and Forecast - by Types
- 8.2.1. Subscription Model
- 8.2.2. Pay-Per-Use Model
- 8.1. Market Analysis, Insights and Forecast - by Application
- 9. Middle East & Africa Commercial Vehicle Battery Swap Stations Analysis, Insights and Forecast, 2019-2031
- 9.1. Market Analysis, Insights and Forecast - by Application
- 9.1.1. Three-Wheeler Light Commercial Vehicle
- 9.1.2. Four-Wheeler Light Commercial Vehicle
- 9.1.3. Other
- 9.2. Market Analysis, Insights and Forecast - by Types
- 9.2.1. Subscription Model
- 9.2.2. Pay-Per-Use Model
- 9.1. Market Analysis, Insights and Forecast - by Application
- 10. Asia Pacific Commercial Vehicle Battery Swap Stations Analysis, Insights and Forecast, 2019-2031
- 10.1. Market Analysis, Insights and Forecast - by Application
- 10.1.1. Three-Wheeler Light Commercial Vehicle
- 10.1.2. Four-Wheeler Light Commercial Vehicle
- 10.1.3. Other
- 10.2. Market Analysis, Insights and Forecast - by Types
- 10.2.1. Subscription Model
- 10.2.2. Pay-Per-Use Model
- 10.1. Market Analysis, Insights and Forecast - by Application
- 11. Competitive Analysis
- 11.1. Global Market Share Analysis 2024
- 11.2. Company Profiles
- 11.2.1 Contemporary Amperex Technology
- 11.2.1.1. Overview
- 11.2.1.2. Products
- 11.2.1.3. SWOT Analysis
- 11.2.1.4. Recent Developments
- 11.2.1.5. Financials (Based on Availability)
- 11.2.2 Geely
- 11.2.2.1. Overview
- 11.2.2.2. Products
- 11.2.2.3. SWOT Analysis
- 11.2.2.4. Recent Developments
- 11.2.2.5. Financials (Based on Availability)
- 11.2.3 Nio Power
- 11.2.3.1. Overview
- 11.2.3.2. Products
- 11.2.3.3. SWOT Analysis
- 11.2.3.4. Recent Developments
- 11.2.3.5. Financials (Based on Availability)
- 11.2.4 SK Innovation
- 11.2.4.1. Overview
- 11.2.4.2. Products
- 11.2.4.3. SWOT Analysis
- 11.2.4.4. Recent Developments
- 11.2.4.5. Financials (Based on Availability)
- 11.2.5 Suzhou Harmontronics Automation Technology
- 11.2.5.1. Overview
- 11.2.5.2. Products
- 11.2.5.3. SWOT Analysis
- 11.2.5.4. Recent Developments
- 11.2.5.5. Financials (Based on Availability)
- 11.2.6 Aulton New Energy Automotive Technology
- 11.2.6.1. Overview
- 11.2.6.2. Products
- 11.2.6.3. SWOT Analysis
- 11.2.6.4. Recent Developments
- 11.2.6.5. Financials (Based on Availability)
- 11.2.7 Gogoro
- 11.2.7.1. Overview
- 11.2.7.2. Products
- 11.2.7.3. SWOT Analysis
- 11.2.7.4. Recent Developments
- 11.2.7.5. Financials (Based on Availability)
- 11.2.8 Lifan Technology
- 11.2.8.1. Overview
- 11.2.8.2. Products
- 11.2.8.3. SWOT Analysis
- 11.2.8.4. Recent Developments
- 11.2.8.5. Financials (Based on Availability)
- 11.2.9 Esmito Solutions
- 11.2.9.1. Overview
- 11.2.9.2. Products
- 11.2.9.3. SWOT Analysis
- 11.2.9.4. Recent Developments
- 11.2.9.5. Financials (Based on Availability)
- 11.2.10 GCL Energy Technology
- 11.2.10.1. Overview
- 11.2.10.2. Products
- 11.2.10.3. SWOT Analysis
- 11.2.10.4. Recent Developments
- 11.2.10.5. Financials (Based on Availability)
- 11.2.11 BAIC BluePark New Energy Technology
- 11.2.11.1. Overview
- 11.2.11.2. Products
- 11.2.11.3. SWOT Analysis
- 11.2.11.4. Recent Developments
- 11.2.11.5. Financials (Based on Availability)
- 11.2.12 Hangzhou Botan Technology Engineering
- 11.2.12.1. Overview
- 11.2.12.2. Products
- 11.2.12.3. SWOT Analysis
- 11.2.12.4. Recent Developments
- 11.2.12.5. Financials (Based on Availability)
- 11.2.13 Shanghai Enneagon Energy Technology
- 11.2.13.1. Overview
- 11.2.13.2. Products
- 11.2.13.3. SWOT Analysis
- 11.2.13.4. Recent Developments
- 11.2.13.5. Financials (Based on Availability)
- 11.2.14 Shandong Weida Machinery
- 11.2.14.1. Overview
- 11.2.14.2. Products
- 11.2.14.3. SWOT Analysis
- 11.2.14.4. Recent Developments
- 11.2.14.5. Financials (Based on Availability)
- 11.2.15 Esmito Solutions
- 11.2.15.1. Overview
- 11.2.15.2. Products
- 11.2.15.3. SWOT Analysis
- 11.2.15.4. Recent Developments
- 11.2.15.5. Financials (Based on Availability)
- 11.2.16 Amplify Cleantech Solutions
- 11.2.16.1. Overview
- 11.2.16.2. Products
- 11.2.16.3. SWOT Analysis
- 11.2.16.4. Recent Developments
- 11.2.16.5. Financials (Based on Availability)
- 11.2.17 Chargeup
- 11.2.17.1. Overview
- 11.2.17.2. Products
- 11.2.17.3. SWOT Analysis
- 11.2.17.4. Recent Developments
- 11.2.17.5. Financials (Based on Availability)
- 11.2.18 Lithion Power
- 11.2.18.1. Overview
- 11.2.18.2. Products
- 11.2.18.3. SWOT Analysis
- 11.2.18.4. Recent Developments
- 11.2.18.5. Financials (Based on Availability)
- 11.2.19 Shenzhen Qingcheng
- 11.2.19.1. Overview
- 11.2.19.2. Products
- 11.2.19.3. SWOT Analysis
- 11.2.19.4. Recent Developments
- 11.2.19.5. Financials (Based on Availability)
- 11.2.20 Ample
- 11.2.20.1. Overview
- 11.2.20.2. Products
- 11.2.20.3. SWOT Analysis
- 11.2.20.4. Recent Developments
- 11.2.20.5. Financials (Based on Availability)
- 11.2.1 Contemporary Amperex Technology
List of Figures
- Figure 1: Global Commercial Vehicle Battery Swap Stations Revenue Breakdown (million, %) by Region 2024 & 2032
- Figure 2: North America Commercial Vehicle Battery Swap Stations Revenue (million), by Application 2024 & 2032
- Figure 3: North America Commercial Vehicle Battery Swap Stations Revenue Share (%), by Application 2024 & 2032
- Figure 4: North America Commercial Vehicle Battery Swap Stations Revenue (million), by Types 2024 & 2032
- Figure 5: North America Commercial Vehicle Battery Swap Stations Revenue Share (%), by Types 2024 & 2032
- Figure 6: North America Commercial Vehicle Battery Swap Stations Revenue (million), by Country 2024 & 2032
- Figure 7: North America Commercial Vehicle Battery Swap Stations Revenue Share (%), by Country 2024 & 2032
- Figure 8: South America Commercial Vehicle Battery Swap Stations Revenue (million), by Application 2024 & 2032
- Figure 9: South America Commercial Vehicle Battery Swap Stations Revenue Share (%), by Application 2024 & 2032
- Figure 10: South America Commercial Vehicle Battery Swap Stations Revenue (million), by Types 2024 & 2032
- Figure 11: South America Commercial Vehicle Battery Swap Stations Revenue Share (%), by Types 2024 & 2032
- Figure 12: South America Commercial Vehicle Battery Swap Stations Revenue (million), by Country 2024 & 2032
- Figure 13: South America Commercial Vehicle Battery Swap Stations Revenue Share (%), by Country 2024 & 2032
- Figure 14: Europe Commercial Vehicle Battery Swap Stations Revenue (million), by Application 2024 & 2032
- Figure 15: Europe Commercial Vehicle Battery Swap Stations Revenue Share (%), by Application 2024 & 2032
- Figure 16: Europe Commercial Vehicle Battery Swap Stations Revenue (million), by Types 2024 & 2032
- Figure 17: Europe Commercial Vehicle Battery Swap Stations Revenue Share (%), by Types 2024 & 2032
- Figure 18: Europe Commercial Vehicle Battery Swap Stations Revenue (million), by Country 2024 & 2032
- Figure 19: Europe Commercial Vehicle Battery Swap Stations Revenue Share (%), by Country 2024 & 2032
- Figure 20: Middle East & Africa Commercial Vehicle Battery Swap Stations Revenue (million), by Application 2024 & 2032
- Figure 21: Middle East & Africa Commercial Vehicle Battery Swap Stations Revenue Share (%), by Application 2024 & 2032
- Figure 22: Middle East & Africa Commercial Vehicle Battery Swap Stations Revenue (million), by Types 2024 & 2032
- Figure 23: Middle East & Africa Commercial Vehicle Battery Swap Stations Revenue Share (%), by Types 2024 & 2032
- Figure 24: Middle East & Africa Commercial Vehicle Battery Swap Stations Revenue (million), by Country 2024 & 2032
- Figure 25: Middle East & Africa Commercial Vehicle Battery Swap Stations Revenue Share (%), by Country 2024 & 2032
- Figure 26: Asia Pacific Commercial Vehicle Battery Swap Stations Revenue (million), by Application 2024 & 2032
- Figure 27: Asia Pacific Commercial Vehicle Battery Swap Stations Revenue Share (%), by Application 2024 & 2032
- Figure 28: Asia Pacific Commercial Vehicle Battery Swap Stations Revenue (million), by Types 2024 & 2032
- Figure 29: Asia Pacific Commercial Vehicle Battery Swap Stations Revenue Share (%), by Types 2024 & 2032
- Figure 30: Asia Pacific Commercial Vehicle Battery Swap Stations Revenue (million), by Country 2024 & 2032
- Figure 31: Asia Pacific Commercial Vehicle Battery Swap Stations Revenue Share (%), by Country 2024 & 2032
List of Tables
- Table 1: Global Commercial Vehicle Battery Swap Stations Revenue million Forecast, by Region 2019 & 2032
- Table 2: Global Commercial Vehicle Battery Swap Stations Revenue million Forecast, by Application 2019 & 2032
- Table 3: Global Commercial Vehicle Battery Swap Stations Revenue million Forecast, by Types 2019 & 2032
- Table 4: Global Commercial Vehicle Battery Swap Stations Revenue million Forecast, by Region 2019 & 2032
- Table 5: Global Commercial Vehicle Battery Swap Stations Revenue million Forecast, by Application 2019 & 2032
- Table 6: Global Commercial Vehicle Battery Swap Stations Revenue million Forecast, by Types 2019 & 2032
- Table 7: Global Commercial Vehicle Battery Swap Stations Revenue million Forecast, by Country 2019 & 2032
- Table 8: United States Commercial Vehicle Battery Swap Stations Revenue (million) Forecast, by Application 2019 & 2032
- Table 9: Canada Commercial Vehicle Battery Swap Stations Revenue (million) Forecast, by Application 2019 & 2032
- Table 10: Mexico Commercial Vehicle Battery Swap Stations Revenue (million) Forecast, by Application 2019 & 2032
- Table 11: Global Commercial Vehicle Battery Swap Stations Revenue million Forecast, by Application 2019 & 2032
- Table 12: Global Commercial Vehicle Battery Swap Stations Revenue million Forecast, by Types 2019 & 2032
- Table 13: Global Commercial Vehicle Battery Swap Stations Revenue million Forecast, by Country 2019 & 2032
- Table 14: Brazil Commercial Vehicle Battery Swap Stations Revenue (million) Forecast, by Application 2019 & 2032
- Table 15: Argentina Commercial Vehicle Battery Swap Stations Revenue (million) Forecast, by Application 2019 & 2032
- Table 16: Rest of South America Commercial Vehicle Battery Swap Stations Revenue (million) Forecast, by Application 2019 & 2032
- Table 17: Global Commercial Vehicle Battery Swap Stations Revenue million Forecast, by Application 2019 & 2032
- Table 18: Global Commercial Vehicle Battery Swap Stations Revenue million Forecast, by Types 2019 & 2032
- Table 19: Global Commercial Vehicle Battery Swap Stations Revenue million Forecast, by Country 2019 & 2032
- Table 20: United Kingdom Commercial Vehicle Battery Swap Stations Revenue (million) Forecast, by Application 2019 & 2032
- Table 21: Germany Commercial Vehicle Battery Swap Stations Revenue (million) Forecast, by Application 2019 & 2032
- Table 22: France Commercial Vehicle Battery Swap Stations Revenue (million) Forecast, by Application 2019 & 2032
- Table 23: Italy Commercial Vehicle Battery Swap Stations Revenue (million) Forecast, by Application 2019 & 2032
- Table 24: Spain Commercial Vehicle Battery Swap Stations Revenue (million) Forecast, by Application 2019 & 2032
- Table 25: Russia Commercial Vehicle Battery Swap Stations Revenue (million) Forecast, by Application 2019 & 2032
- Table 26: Benelux Commercial Vehicle Battery Swap Stations Revenue (million) Forecast, by Application 2019 & 2032
- Table 27: Nordics Commercial Vehicle Battery Swap Stations Revenue (million) Forecast, by Application 2019 & 2032
- Table 28: Rest of Europe Commercial Vehicle Battery Swap Stations Revenue (million) Forecast, by Application 2019 & 2032
- Table 29: Global Commercial Vehicle Battery Swap Stations Revenue million Forecast, by Application 2019 & 2032
- Table 30: Global Commercial Vehicle Battery Swap Stations Revenue million Forecast, by Types 2019 & 2032
- Table 31: Global Commercial Vehicle Battery Swap Stations Revenue million Forecast, by Country 2019 & 2032
- Table 32: Turkey Commercial Vehicle Battery Swap Stations Revenue (million) Forecast, by Application 2019 & 2032
- Table 33: Israel Commercial Vehicle Battery Swap Stations Revenue (million) Forecast, by Application 2019 & 2032
- Table 34: GCC Commercial Vehicle Battery Swap Stations Revenue (million) Forecast, by Application 2019 & 2032
- Table 35: North Africa Commercial Vehicle Battery Swap Stations Revenue (million) Forecast, by Application 2019 & 2032
- Table 36: South Africa Commercial Vehicle Battery Swap Stations Revenue (million) Forecast, by Application 2019 & 2032
- Table 37: Rest of Middle East & Africa Commercial Vehicle Battery Swap Stations Revenue (million) Forecast, by Application 2019 & 2032
- Table 38: Global Commercial Vehicle Battery Swap Stations Revenue million Forecast, by Application 2019 & 2032
- Table 39: Global Commercial Vehicle Battery Swap Stations Revenue million Forecast, by Types 2019 & 2032
- Table 40: Global Commercial Vehicle Battery Swap Stations Revenue million Forecast, by Country 2019 & 2032
- Table 41: China Commercial Vehicle Battery Swap Stations Revenue (million) Forecast, by Application 2019 & 2032
- Table 42: India Commercial Vehicle Battery Swap Stations Revenue (million) Forecast, by Application 2019 & 2032
- Table 43: Japan Commercial Vehicle Battery Swap Stations Revenue (million) Forecast, by Application 2019 & 2032
- Table 44: South Korea Commercial Vehicle Battery Swap Stations Revenue (million) Forecast, by Application 2019 & 2032
- Table 45: ASEAN Commercial Vehicle Battery Swap Stations Revenue (million) Forecast, by Application 2019 & 2032
- Table 46: Oceania Commercial Vehicle Battery Swap Stations Revenue (million) Forecast, by Application 2019 & 2032
- Table 47: Rest of Asia Pacific Commercial Vehicle Battery Swap Stations Revenue (million) Forecast, by Application 2019 & 2032
Frequently Asked Questions
1. What is the projected Compound Annual Growth Rate (CAGR) of the Commercial Vehicle Battery Swap Stations?
The projected CAGR is approximately XX%.
2. Which companies are prominent players in the Commercial Vehicle Battery Swap Stations?
Key companies in the market include Contemporary Amperex Technology, Geely, Nio Power, SK Innovation, Suzhou Harmontronics Automation Technology, Aulton New Energy Automotive Technology, Gogoro, Lifan Technology, Esmito Solutions, GCL Energy Technology, BAIC BluePark New Energy Technology, Hangzhou Botan Technology Engineering, Shanghai Enneagon Energy Technology, Shandong Weida Machinery, Esmito Solutions, Amplify Cleantech Solutions, Chargeup, Lithion Power, Shenzhen Qingcheng, Ample.
3. What are the main segments of the Commercial Vehicle Battery Swap Stations?
The market segments include Application, Types.
4. Can you provide details about the market size?
The market size is estimated to be USD XXX million as of 2022.
5. What are some drivers contributing to market growth?
N/A
6. What are the notable trends driving market growth?
N/A
7. Are there any restraints impacting market growth?
N/A
8. Can you provide examples of recent developments in the market?
N/A
9. What pricing options are available for accessing the report?
Pricing options include single-user, multi-user, and enterprise licenses priced at USD 4900.00, USD 7350.00, and USD 9800.00 respectively.
10. Is the market size provided in terms of value or volume?
The market size is provided in terms of value, measured in million.
11. Are there any specific market keywords associated with the report?
Yes, the market keyword associated with the report is "Commercial Vehicle Battery Swap Stations," which aids in identifying and referencing the specific market segment covered.
12. How do I determine which pricing option suits my needs best?
The pricing options vary based on user requirements and access needs. Individual users may opt for single-user licenses, while businesses requiring broader access may choose multi-user or enterprise licenses for cost-effective access to the report.
13. Are there any additional resources or data provided in the Commercial Vehicle Battery Swap Stations report?
While the report offers comprehensive insights, it's advisable to review the specific contents or supplementary materials provided to ascertain if additional resources or data are available.
14. How can I stay updated on further developments or reports in the Commercial Vehicle Battery Swap Stations?
To stay informed about further developments, trends, and reports in the Commercial Vehicle Battery Swap Stations, consider subscribing to industry newsletters, following relevant companies and organizations, or regularly checking reputable industry news sources and publications.
Methodology
Step 1 - Identification of Relevant Samples Size from Population Database


Step 2 - Approaches for Defining Global Market Size (Value, Volume* & Price*)

Note*: In applicable scenarios
Step 3 - Data Sources
Primary Research
- Web Analytics
- Survey Reports
- Research Institute
- Latest Research Reports
- Opinion Leaders
Secondary Research
- Annual Reports
- White Paper
- Latest Press Release
- Industry Association
- Paid Database
- Investor Presentations

Step 4 - Data Triangulation
Involves using different sources of information in order to increase the validity of a study
These sources are likely to be stakeholders in a program - participants, other researchers, program staff, other community members, and so on.
Then we put all data in single framework & apply various statistical tools to find out the dynamic on the market.
During the analysis stage, feedback from the stakeholder groups would be compared to determine areas of agreement as well as areas of divergence


