

Key Insights
The Electronic Toll Collection (ETC) System market is experiencing robust growth, driven by increasing traffic congestion in urban areas and a global push towards efficient transportation management. The market's Compound Annual Growth Rate (CAGR) exceeding 8.00% from 2019 to 2024 indicates significant expansion, projected to continue through 2033. This growth is fueled by several key factors. The increasing adoption of electronic toll collection methods over traditional barrier systems reflects a preference for faster, more convenient travel experiences. Governments worldwide are actively investing in upgrading their infrastructure to accommodate ETC systems, enhancing overall traffic flow and reducing delays. Furthermore, the integration of advanced technologies like RFID, GPS, and AI within ETC systems offers opportunities for improved data analytics, enabling better traffic management, congestion mitigation, and revenue optimization. The market is segmented by toll collection type (barrier, entry/exit, electronic) and application type (bridges, roads, tunnels), providing diverse opportunities for market players. Electronic toll collection, in particular, is dominating growth due to its efficiency and convenience. While initial investment costs can be a restraint, the long-term benefits in terms of reduced operational costs and increased revenue generation are driving adoption. The Asia-Pacific region, with its rapidly developing infrastructure and expanding road networks, is expected to witness substantial market growth, followed by North America and Europe.
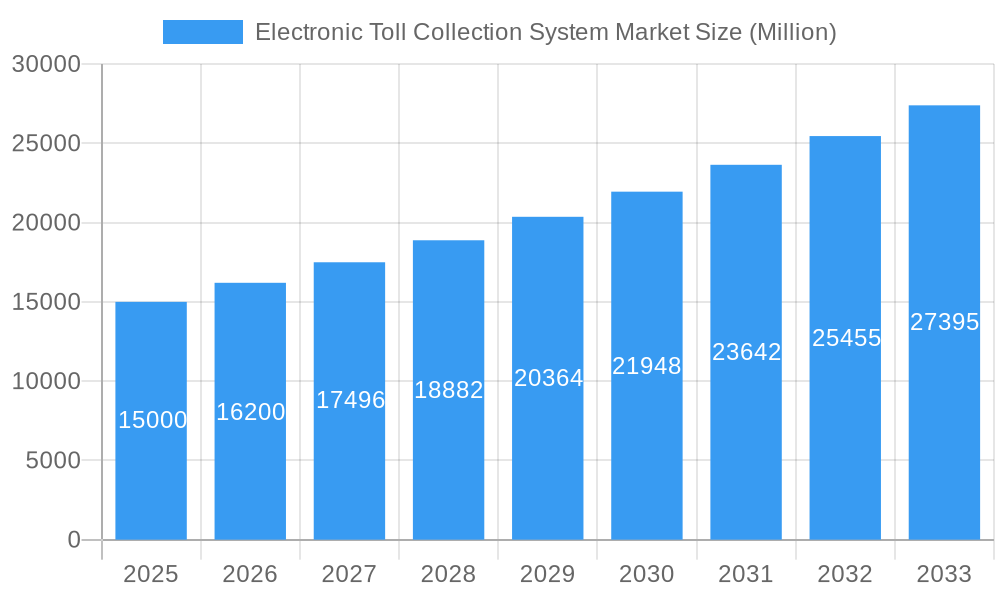
Electronic Toll Collection System Market Market Size (In Billion)
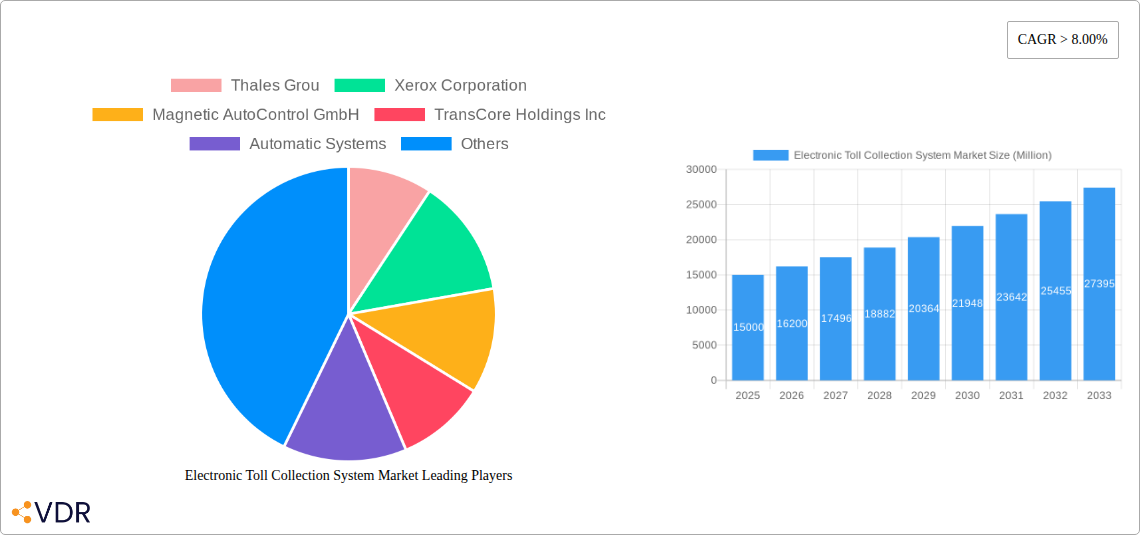
Leading companies in the ETC system market, such as Thales Group, Xerox Corporation, and TransCore Holdings Inc., are actively engaging in strategic partnerships, acquisitions, and technological advancements to maintain their competitive edge. Their focus on providing integrated, scalable, and secure ETC solutions is crucial in securing market share. Future growth will likely be shaped by the increasing integration of ETC systems with Intelligent Transportation Systems (ITS), enabling real-time traffic monitoring and management, improving safety, and enhancing the overall transportation experience. The ongoing development of interoperable ETC systems across different regions and countries will further stimulate market expansion and encourage broader adoption. The market is expected to witness consolidation as companies strive to offer comprehensive solutions and expand their geographical reach. This trend towards integrated, advanced systems further accelerates the overall market growth.
Electronic Toll Collection System Market Company Market Share
Electronic Toll Collection System Market Report: 2019-2033
This comprehensive report provides an in-depth analysis of the Electronic Toll Collection System market, encompassing market dynamics, growth trends, regional dominance, product landscape, key players, and future outlook. The study period covers 2019-2033, with a base year of 2025 and a forecast period of 2025-2033. The report segments the market by Toll Collection Type (Barrier Toll Collection, Entry/Exit Toll Collection, Electronic Toll Collection) and Application Type (Bridges, Roads, Tunnels), offering granular insights into each segment's performance and growth potential. The market size is presented in million units.
Electronic Toll Collection System Market Dynamics & Structure
The Electronic Toll Collection System market exhibits a moderately concentrated structure, with key players vying for market share through technological innovation and strategic acquisitions. The market is driven by increasing urbanization, growing traffic congestion, and the need for efficient transportation management. Stringent government regulations promoting electronic tolling and the rising adoption of intelligent transportation systems (ITS) further fuel market growth. However, high initial investment costs and the need for robust cybersecurity measures pose significant challenges. The competitive landscape is shaped by mergers & acquisitions (M&A) activities, with xx M&A deals recorded in the historical period (2019-2024). Major players are increasingly focusing on developing advanced technologies like RFID and ANPR systems to enhance efficiency and accuracy.
- Market Concentration: Moderately concentrated, with top 5 players holding xx% market share in 2025.
- Technological Innovation Drivers: RFID, ANPR, AI-powered analytics, cloud-based platforms.
- Regulatory Frameworks: Government initiatives promoting electronic tolling and smart city development.
- Competitive Product Substitutes: Manual toll collection systems (limited impact due to inefficiency).
- End-User Demographics: Primarily governmental agencies and private toll operators.
- M&A Trends: Strategic acquisitions to expand market reach and technological capabilities. xx M&A deals in 2019-2024, with an estimated xx deals predicted for 2025-2033.
Electronic Toll Collection System Market Growth Trends & Insights
The Electronic Toll Collection System market witnessed robust growth during the historical period (2019-2024), driven by increasing adoption of electronic toll collection systems across various applications. The market size expanded from xx million units in 2019 to xx million units in 2024, registering a CAGR of xx%. This growth is primarily attributed to the increasing need for efficient traffic management and reduced congestion in urban areas. The rising adoption of advanced technologies, such as Artificial Intelligence (AI) and Machine Learning (ML), further enhances the efficiency and accuracy of toll collection systems, driving market growth. Consumer behavior shifts towards cashless transactions and the growing demand for seamless travel experiences are also contributing factors. The forecast period (2025-2033) anticipates continued growth, reaching xx million units by 2033, with a projected CAGR of xx%. Market penetration is expected to reach xx% by 2033, driven by continuous government investments in infrastructure development and the expansion of electronic toll collection networks across regions.
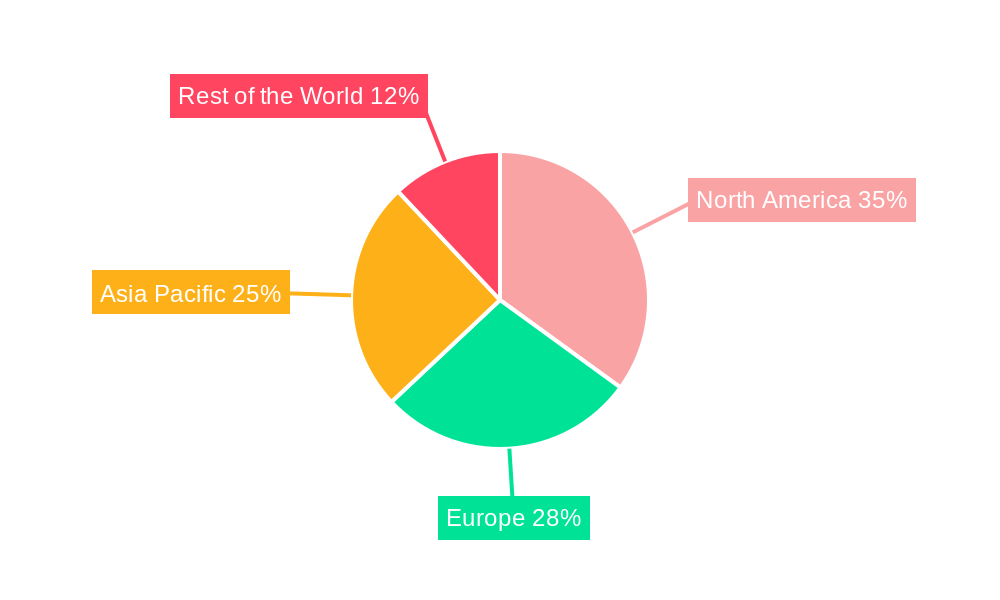
Dominant Regions, Countries, or Segments in Electronic Toll Collection System Market
North America currently holds the largest market share in the Electronic Toll Collection System market, driven by significant investments in infrastructure development and the early adoption of advanced technologies. Europe follows closely, with a rapidly growing market fueled by government initiatives promoting smart cities and the increasing adoption of electronic tolling systems. Within the segment breakdown, the Electronic Toll Collection type dominates the market due to its efficiency and convenience. Roads represent the largest application segment, owing to the extensive road networks in developed and developing countries.
- Key Drivers in North America: High adoption rates, substantial government funding for infrastructure projects, and technological advancements.
- Key Drivers in Europe: Government regulations promoting smart city initiatives and integration with ITS, coupled with the growth of private sector investments.
- Dominant Segment (Toll Collection Type): Electronic Toll Collection, due to its high efficiency and cost-effectiveness.
- Dominant Segment (Application Type): Roads, attributed to extensive road networks and high traffic volume.
- Market Share (2025): North America (xx%), Europe (xx%), Asia Pacific (xx%), Rest of World (xx%).
Electronic Toll Collection System Market Product Landscape
The Electronic Toll Collection System market offers a range of products, from simple barrier systems to sophisticated multi-lane free-flow systems employing RFID, ANPR, and other advanced technologies. These systems are designed to handle various traffic volumes and integrate seamlessly with existing transportation management systems. Key features include high accuracy, seamless integration with back-end systems, and robust security measures. Recent innovations focus on improving system reliability, enhancing data analytics capabilities, and ensuring interoperability across different systems. Unique selling propositions frequently involve real-time traffic monitoring, advanced analytics for traffic management, and reduced operational costs.
Key Drivers, Barriers & Challenges in Electronic Toll Collection System Market
Key Drivers:
- Increasing urbanization and traffic congestion.
- Government initiatives promoting smart cities and ITS.
- Rising demand for cashless transactions and convenient travel experiences.
- Technological advancements in RFID, ANPR, and AI-based analytics.
Challenges & Restraints:
- High initial investment costs for infrastructure and system implementation.
- Cybersecurity concerns and the need for robust data protection measures.
- Interoperability challenges between different systems and technologies.
- Potential for system failures and disruptions leading to traffic congestion. xx% downtime reported across all systems in 2024.
Emerging Opportunities in Electronic Toll Collection System Market
- Expansion into developing markets with growing infrastructure needs.
- Integration with other smart city applications, such as traffic management and parking systems.
- Development of new technologies, such as 5G connectivity and IoT-enabled devices for enhanced system performance.
- Focus on improving user experience through user-friendly interfaces and mobile applications.
Growth Accelerators in the Electronic Toll Collection System Market Industry
Long-term growth is accelerated by continuous technological advancements, strategic partnerships between system providers and infrastructure operators, and government policies favoring the adoption of electronic tolling. Investments in research and development are leading to more efficient, reliable, and secure toll collection systems. The expansion into new markets and integration with other smart city applications further propel market expansion.
Key Players Shaping the Electronic Toll Collection System Market Market
- Thales Group
- Xerox Corporation
- Magnetic AutoControl GmbH
- TransCore Holdings Inc
- Automatic Systems
- Feig Electronics
- TRMI Systems Integration
- Siemens AG
- Schneider Electric SE
- Nedap NV
- DENSO Corporation
- Mitsubishi Heavy Industries Ltd
Notable Milestones in Electronic Toll Collection System Sector
- 2021: Launch of a new AI-powered toll collection system by Thales Group.
- 2022: Acquisition of a smaller toll system provider by TransCore Holdings Inc.
- 2023: Introduction of a new multi-lane free-flow system by Automatic Systems.
- 2024: Significant investment in electronic toll infrastructure by the government of [Country Name].
In-Depth Electronic Toll Collection System Market Outlook
The Electronic Toll Collection System market is poised for continued strong growth over the forecast period, fueled by technological advancements, increasing infrastructure investments, and the growing adoption of electronic payment systems. Strategic partnerships, mergers and acquisitions, and expansion into untapped markets will drive further market expansion and enhance the overall efficiency and effectiveness of toll collection systems worldwide. The market's potential is particularly significant in developing economies, where there is substantial growth in vehicle ownership and infrastructure development.
Electronic Toll Collection System Market Segmentation
-
1. Toll Collection Type
- 1.1. Barrier Toll Collection
- 1.2. Entry/Exit Toll Collection
- 1.3. Electronic Toll Collection
-
2. Application Type
- 2.1. Bridges
- 2.2. Roads
- 2.3. Tunnels
Electronic Toll Collection System Market Segmentation By Geography
-
1. North America
- 1.1. United States
- 1.2. Canada
- 1.3. Mexico
-
2. Europe
- 2.1. Germany
- 2.2. United Kingdom
- 2.3. France
- 2.4. Italy
- 2.5. Rest of Europe
-
3. Asia Pacific
- 3.1. China
- 3.2. Japan
- 3.3. India
- 3.4. South Korea
- 3.5. Rest of Asia Pacific
-
4. Rest of the World
- 4.1. Brazil
- 4.2. South Africa
- 4.3. Other Countries
Electronic Toll Collection System Market Regional Market Share
Geographic Coverage of Electronic Toll Collection System Market
Electronic Toll Collection System Market REPORT HIGHLIGHTS
| Aspects | Details |
|---|---|
| Study Period | 2020-2034 |
| Base Year | 2025 |
| Estimated Year | 2026 |
| Forecast Period | 2026-2034 |
| Historical Period | 2020-2025 |
| Growth Rate | CAGR of 8.34% from 2020-2034 |
| Segmentation |
|
Table of Contents
- 1. Introduction
- 1.1. Research Scope
- 1.2. Market Segmentation
- 1.3. Research Objective
- 1.4. Definitions and Assumptions
- 2. Executive Summary
- 2.1. Market Snapshot
- 3. Market Dynamics
- 3.1. Market Drivers
- 3.2. Market Restrains
- 3.3. Market Trends
- 3.4. Market Opportunities
- 4. Market Factor Analysis
- 4.1. Porters Five Forces
- 4.1.1. Bargaining Power of Suppliers
- 4.1.2. Bargaining Power of Buyers
- 4.1.3. Threat of New Entrants
- 4.1.4. Threat of Substitutes
- 4.1.5. Competitive Rivalry
- 4.2. PESTEL analysis
- 4.3. BCG Analysis
- 4.3.1. Stars (High Growth, High Market Share)
- 4.3.2. Cash Cows (Low Growth, High Market Share)
- 4.3.3. Question Mark (High Growth, Low Market Share)
- 4.3.4. Dogs (Low Growth, Low Market Share)
- 4.4. Ansoff Matrix Analysis
- 4.5. Supply Chain Analysis
- 4.6. Regulatory Landscape
- 4.7. Current Market Potential and Opportunity Assessment (TAM–SAM–SOM Framework)
- 4.8. VDR Analyst Note
- 4.1. Porters Five Forces
- 5. Market Analysis, Insights and Forecast 2021-2033
- 5.1. Market Analysis, Insights and Forecast - by Toll Collection Type
- 5.1.1. Barrier Toll Collection
- 5.1.2. Entry/Exit Toll Collection
- 5.1.3. Electronic Toll Collection
- 5.2. Market Analysis, Insights and Forecast - by Application Type
- 5.2.1. Bridges
- 5.2.2. Roads
- 5.2.3. Tunnels
- 5.3. Market Analysis, Insights and Forecast - by Region
- 5.3.1. North America
- 5.3.2. Europe
- 5.3.3. Asia Pacific
- 5.3.4. Rest of the World
- 5.1. Market Analysis, Insights and Forecast - by Toll Collection Type
- 6. Global Electronic Toll Collection System Market Analysis, Insights and Forecast, 2021-2033
- 6.1. Market Analysis, Insights and Forecast - by Toll Collection Type
- 6.1.1. Barrier Toll Collection
- 6.1.2. Entry/Exit Toll Collection
- 6.1.3. Electronic Toll Collection
- 6.2. Market Analysis, Insights and Forecast - by Application Type
- 6.2.1. Bridges
- 6.2.2. Roads
- 6.2.3. Tunnels
- 6.1. Market Analysis, Insights and Forecast - by Toll Collection Type
- 7. North America Electronic Toll Collection System Market Analysis, Insights and Forecast, 2021-2033
- 7.1. Market Analysis, Insights and Forecast - by Toll Collection Type
- 7.1.1. Barrier Toll Collection
- 7.1.2. Entry/Exit Toll Collection
- 7.1.3. Electronic Toll Collection
- 7.2. Market Analysis, Insights and Forecast - by Application Type
- 7.2.1. Bridges
- 7.2.2. Roads
- 7.2.3. Tunnels
- 7.1. Market Analysis, Insights and Forecast - by Toll Collection Type
- 8. Europe Electronic Toll Collection System Market Analysis, Insights and Forecast, 2021-2033
- 8.1. Market Analysis, Insights and Forecast - by Toll Collection Type
- 8.1.1. Barrier Toll Collection
- 8.1.2. Entry/Exit Toll Collection
- 8.1.3. Electronic Toll Collection
- 8.2. Market Analysis, Insights and Forecast - by Application Type
- 8.2.1. Bridges
- 8.2.2. Roads
- 8.2.3. Tunnels
- 8.1. Market Analysis, Insights and Forecast - by Toll Collection Type
- 9. Asia Pacific Electronic Toll Collection System Market Analysis, Insights and Forecast, 2021-2033
- 9.1. Market Analysis, Insights and Forecast - by Toll Collection Type
- 9.1.1. Barrier Toll Collection
- 9.1.2. Entry/Exit Toll Collection
- 9.1.3. Electronic Toll Collection
- 9.2. Market Analysis, Insights and Forecast - by Application Type
- 9.2.1. Bridges
- 9.2.2. Roads
- 9.2.3. Tunnels
- 9.1. Market Analysis, Insights and Forecast - by Toll Collection Type
- 10. Rest of the World Electronic Toll Collection System Market Analysis, Insights and Forecast, 2021-2033
- 10.1. Market Analysis, Insights and Forecast - by Toll Collection Type
- 10.1.1. Barrier Toll Collection
- 10.1.2. Entry/Exit Toll Collection
- 10.1.3. Electronic Toll Collection
- 10.2. Market Analysis, Insights and Forecast - by Application Type
- 10.2.1. Bridges
- 10.2.2. Roads
- 10.2.3. Tunnels
- 10.1. Market Analysis, Insights and Forecast - by Toll Collection Type
- 11. Competitive Analysis
- 11.1. Company Profiles
- 11.1.1 Thales Grou
- 11.1.1.1. Company Overview
- 11.1.1.2. Products
- 11.1.1.3. Company Financials
- 11.1.1.4. SWOT Analysis
- 11.1.2 Xerox Corporation
- 11.1.2.1. Company Overview
- 11.1.2.2. Products
- 11.1.2.3. Company Financials
- 11.1.2.4. SWOT Analysis
- 11.1.3 Magnetic AutoControl GmbH
- 11.1.3.1. Company Overview
- 11.1.3.2. Products
- 11.1.3.3. Company Financials
- 11.1.3.4. SWOT Analysis
- 11.1.4 TransCore Holdings Inc
- 11.1.4.1. Company Overview
- 11.1.4.2. Products
- 11.1.4.3. Company Financials
- 11.1.4.4. SWOT Analysis
- 11.1.5 Automatic Systems
- 11.1.5.1. Company Overview
- 11.1.5.2. Products
- 11.1.5.3. Company Financials
- 11.1.5.4. SWOT Analysis
- 11.1.6 Feig Electronics
- 11.1.6.1. Company Overview
- 11.1.6.2. Products
- 11.1.6.3. Company Financials
- 11.1.6.4. SWOT Analysis
- 11.1.7 TRMI Systems Integration
- 11.1.7.1. Company Overview
- 11.1.7.2. Products
- 11.1.7.3. Company Financials
- 11.1.7.4. SWOT Analysis
- 11.1.8 Siemens AG
- 11.1.8.1. Company Overview
- 11.1.8.2. Products
- 11.1.8.3. Company Financials
- 11.1.8.4. SWOT Analysis
- 11.1.9 Schneider Electric SE
- 11.1.9.1. Company Overview
- 11.1.9.2. Products
- 11.1.9.3. Company Financials
- 11.1.9.4. SWOT Analysis
- 11.1.10 Nedap NV
- 11.1.10.1. Company Overview
- 11.1.10.2. Products
- 11.1.10.3. Company Financials
- 11.1.10.4. SWOT Analysis
- 11.1.11 DENSO Corporation
- 11.1.11.1. Company Overview
- 11.1.11.2. Products
- 11.1.11.3. Company Financials
- 11.1.11.4. SWOT Analysis
- 11.1.12 Mitsubishi Heavy Industries Ltd
- 11.1.12.1. Company Overview
- 11.1.12.2. Products
- 11.1.12.3. Company Financials
- 11.1.12.4. SWOT Analysis
- 11.1.1 Thales Grou
- 11.2. Market Entropy
- 11.2.1 Company's Key Areas Served
- 11.2.2 Recent Developments
- 11.3. Company Market Share Analysis 2025
- 11.3.1 Top 5 Companies Market Share Analysis
- 11.3.2 Top 3 Companies Market Share Analysis
- 11.4. List of Potential Customers
- 12. Research Methodology
List of Figures
- Figure 1: Global Electronic Toll Collection System Market Revenue Breakdown (billion, %) by Region 2025 & 2033
- Figure 2: North America Electronic Toll Collection System Market Revenue (billion), by Toll Collection Type 2025 & 2033
- Figure 3: North America Electronic Toll Collection System Market Revenue Share (%), by Toll Collection Type 2025 & 2033
- Figure 4: North America Electronic Toll Collection System Market Revenue (billion), by Application Type 2025 & 2033
- Figure 5: North America Electronic Toll Collection System Market Revenue Share (%), by Application Type 2025 & 2033
- Figure 6: North America Electronic Toll Collection System Market Revenue (billion), by Country 2025 & 2033
- Figure 7: North America Electronic Toll Collection System Market Revenue Share (%), by Country 2025 & 2033
- Figure 8: Europe Electronic Toll Collection System Market Revenue (billion), by Toll Collection Type 2025 & 2033
- Figure 9: Europe Electronic Toll Collection System Market Revenue Share (%), by Toll Collection Type 2025 & 2033
- Figure 10: Europe Electronic Toll Collection System Market Revenue (billion), by Application Type 2025 & 2033
- Figure 11: Europe Electronic Toll Collection System Market Revenue Share (%), by Application Type 2025 & 2033
- Figure 12: Europe Electronic Toll Collection System Market Revenue (billion), by Country 2025 & 2033
- Figure 13: Europe Electronic Toll Collection System Market Revenue Share (%), by Country 2025 & 2033
- Figure 14: Asia Pacific Electronic Toll Collection System Market Revenue (billion), by Toll Collection Type 2025 & 2033
- Figure 15: Asia Pacific Electronic Toll Collection System Market Revenue Share (%), by Toll Collection Type 2025 & 2033
- Figure 16: Asia Pacific Electronic Toll Collection System Market Revenue (billion), by Application Type 2025 & 2033
- Figure 17: Asia Pacific Electronic Toll Collection System Market Revenue Share (%), by Application Type 2025 & 2033
- Figure 18: Asia Pacific Electronic Toll Collection System Market Revenue (billion), by Country 2025 & 2033
- Figure 19: Asia Pacific Electronic Toll Collection System Market Revenue Share (%), by Country 2025 & 2033
- Figure 20: Rest of the World Electronic Toll Collection System Market Revenue (billion), by Toll Collection Type 2025 & 2033
- Figure 21: Rest of the World Electronic Toll Collection System Market Revenue Share (%), by Toll Collection Type 2025 & 2033
- Figure 22: Rest of the World Electronic Toll Collection System Market Revenue (billion), by Application Type 2025 & 2033
- Figure 23: Rest of the World Electronic Toll Collection System Market Revenue Share (%), by Application Type 2025 & 2033
- Figure 24: Rest of the World Electronic Toll Collection System Market Revenue (billion), by Country 2025 & 2033
- Figure 25: Rest of the World Electronic Toll Collection System Market Revenue Share (%), by Country 2025 & 2033
List of Tables
- Table 1: Global Electronic Toll Collection System Market Revenue billion Forecast, by Toll Collection Type 2020 & 2033
- Table 2: Global Electronic Toll Collection System Market Revenue billion Forecast, by Application Type 2020 & 2033
- Table 3: Global Electronic Toll Collection System Market Revenue billion Forecast, by Region 2020 & 2033
- Table 4: Global Electronic Toll Collection System Market Revenue billion Forecast, by Toll Collection Type 2020 & 2033
- Table 5: Global Electronic Toll Collection System Market Revenue billion Forecast, by Application Type 2020 & 2033
- Table 6: Global Electronic Toll Collection System Market Revenue billion Forecast, by Country 2020 & 2033
- Table 7: United States Electronic Toll Collection System Market Revenue (billion) Forecast, by Application 2020 & 2033
- Table 8: Canada Electronic Toll Collection System Market Revenue (billion) Forecast, by Application 2020 & 2033
- Table 9: Mexico Electronic Toll Collection System Market Revenue (billion) Forecast, by Application 2020 & 2033
- Table 10: Global Electronic Toll Collection System Market Revenue billion Forecast, by Toll Collection Type 2020 & 2033
- Table 11: Global Electronic Toll Collection System Market Revenue billion Forecast, by Application Type 2020 & 2033
- Table 12: Global Electronic Toll Collection System Market Revenue billion Forecast, by Country 2020 & 2033
- Table 13: Germany Electronic Toll Collection System Market Revenue (billion) Forecast, by Application 2020 & 2033
- Table 14: United Kingdom Electronic Toll Collection System Market Revenue (billion) Forecast, by Application 2020 & 2033
- Table 15: France Electronic Toll Collection System Market Revenue (billion) Forecast, by Application 2020 & 2033
- Table 16: Italy Electronic Toll Collection System Market Revenue (billion) Forecast, by Application 2020 & 2033
- Table 17: Rest of Europe Electronic Toll Collection System Market Revenue (billion) Forecast, by Application 2020 & 2033
- Table 18: Global Electronic Toll Collection System Market Revenue billion Forecast, by Toll Collection Type 2020 & 2033
- Table 19: Global Electronic Toll Collection System Market Revenue billion Forecast, by Application Type 2020 & 2033
- Table 20: Global Electronic Toll Collection System Market Revenue billion Forecast, by Country 2020 & 2033
- Table 21: China Electronic Toll Collection System Market Revenue (billion) Forecast, by Application 2020 & 2033
- Table 22: Japan Electronic Toll Collection System Market Revenue (billion) Forecast, by Application 2020 & 2033
- Table 23: India Electronic Toll Collection System Market Revenue (billion) Forecast, by Application 2020 & 2033
- Table 24: South Korea Electronic Toll Collection System Market Revenue (billion) Forecast, by Application 2020 & 2033
- Table 25: Rest of Asia Pacific Electronic Toll Collection System Market Revenue (billion) Forecast, by Application 2020 & 2033
- Table 26: Global Electronic Toll Collection System Market Revenue billion Forecast, by Toll Collection Type 2020 & 2033
- Table 27: Global Electronic Toll Collection System Market Revenue billion Forecast, by Application Type 2020 & 2033
- Table 28: Global Electronic Toll Collection System Market Revenue billion Forecast, by Country 2020 & 2033
- Table 29: Brazil Electronic Toll Collection System Market Revenue (billion) Forecast, by Application 2020 & 2033
- Table 30: South Africa Electronic Toll Collection System Market Revenue (billion) Forecast, by Application 2020 & 2033
- Table 31: Other Countries Electronic Toll Collection System Market Revenue (billion) Forecast, by Application 2020 & 2033
Frequently Asked Questions
1. What is the projected Compound Annual Growth Rate (CAGR) of the Electronic Toll Collection System Market?
The projected CAGR is approximately 8.34%.
2. Which companies are prominent players in the Electronic Toll Collection System Market?
Key companies in the market include Thales Grou, Xerox Corporation, Magnetic AutoControl GmbH, TransCore Holdings Inc, Automatic Systems, Feig Electronics, TRMI Systems Integration, Siemens AG, Schneider Electric SE, Nedap NV, DENSO Corporation, Mitsubishi Heavy Industries Ltd.
3. What are the main segments of the Electronic Toll Collection System Market?
The market segments include Toll Collection Type, Application Type.
4. Can you provide details about the market size?
The market size is estimated to be USD 10.94 billion as of 2022.
5. What are some drivers contributing to market growth?
Rising Automotive Vehicle Sales Anticipated to Drive the Market.
6. What are the notable trends driving market growth?
Electronic Toll Collection is Expected to Witness the Highest Growth Rate.
7. Are there any restraints impacting market growth?
High Initial Cost Acting as Barrier for the Market.
8. Can you provide examples of recent developments in the market?
N/A
9. What pricing options are available for accessing the report?
Pricing options include single-user, multi-user, and enterprise licenses priced at USD 4750, USD 5250, and USD 8750 respectively.
10. Is the market size provided in terms of value or volume?
The market size is provided in terms of value, measured in billion.
11. Are there any specific market keywords associated with the report?
Yes, the market keyword associated with the report is "Electronic Toll Collection System Market," which aids in identifying and referencing the specific market segment covered.
12. How do I determine which pricing option suits my needs best?
The pricing options vary based on user requirements and access needs. Individual users may opt for single-user licenses, while businesses requiring broader access may choose multi-user or enterprise licenses for cost-effective access to the report.
13. Are there any additional resources or data provided in the Electronic Toll Collection System Market report?
While the report offers comprehensive insights, it's advisable to review the specific contents or supplementary materials provided to ascertain if additional resources or data are available.
14. How can I stay updated on further developments or reports in the Electronic Toll Collection System Market?
To stay informed about further developments, trends, and reports in the Electronic Toll Collection System Market, consider subscribing to industry newsletters, following relevant companies and organizations, or regularly checking reputable industry news sources and publications.
Methodology
Step 1 - Identification of Relevant Samples Size from Population Database


Step 2 - Approaches for Defining Global Market Size (Value, Volume* & Price*)

Note*: In applicable scenarios
Step 3 - Data Sources
Primary Research
- Web Analytics
- Survey Reports
- Research Institute
- Latest Research Reports
- Opinion Leaders
Secondary Research
- Annual Reports
- White Paper
- Latest Press Release
- Industry Association
- Paid Database
- Investor Presentations

Step 4 - Data Triangulation
Involves using different sources of information in order to increase the validity of a study
These sources are likely to be stakeholders in a program - participants, other researchers, program staff, other community members, and so on.
Then we put all data in single framework & apply various statistical tools to find out the dynamic on the market.
During the analysis stage, feedback from the stakeholder groups would be compared to determine areas of agreement as well as areas of divergence