
Key Insights
The global cell line development market is experiencing robust growth, driven by the increasing demand for biopharmaceuticals, advancements in cell line engineering technologies, and the rising prevalence of chronic diseases. The market's Compound Annual Growth Rate (CAGR) of 10.60% from 2019 to 2024 suggests a significant expansion, projected to continue through 2033. Key drivers include the burgeoning biopharmaceutical industry's need for efficient and cost-effective cell line development for producing therapeutic proteins, antibodies, and vaccines. Technological advancements, such as CRISPR-Cas9 gene editing and other advanced cell engineering techniques, are further accelerating market expansion by enabling the creation of highly productive and stable cell lines. The increasing adoption of contract research organizations (CROs) by pharmaceutical and biotechnology companies also contributes to market growth by providing access to specialized expertise and infrastructure. Segmentation analysis reveals that mammalian cell lines dominate the source segment due to their ability to produce complex proteins. Recombinant protein expression is the leading application, followed by vaccine production and drug discovery. North America currently holds a significant market share due to the presence of major pharmaceutical companies and advanced research infrastructure, but the Asia-Pacific region is expected to witness substantial growth in the coming years, fueled by increasing investment in biotechnology and healthcare infrastructure.
While the market exhibits significant potential, certain restraints exist. High research and development costs associated with cell line development can hinder smaller companies' participation. Stringent regulatory approvals and compliance requirements also pose challenges. However, ongoing innovations in cell line engineering and the growing adoption of cost-effective technologies are mitigating these challenges. The competitive landscape includes both established players like Merck KGaA, Thermo Fisher Scientific, and Danaher Corporation, and emerging biotech companies offering specialized services and innovative solutions. The market is expected to witness increased strategic partnerships, mergers, and acquisitions in the coming years, driven by the need for expanded capabilities and market reach. The long-term outlook for the cell line development market remains highly promising, driven by the continued growth of the biopharmaceutical industry and technological advancements. Considering a 2025 market size of approximately $XX million (a value needs to be supplied to complete the analysis), the forecasted market size for 2033 can be reasonably projected based on the provided CAGR.
Cell Line Development Industry Market Report: 2019-2033
This comprehensive report provides an in-depth analysis of the Cell Line Development industry, encompassing market dynamics, growth trends, key players, and future outlook. The report covers the period from 2019 to 2033, with a focus on the forecast period of 2025-2033 and a base year of 2025. The report segments the market by end-user (Biotech and Pharmaceutical Companies, Academics and Research Institutes, Other End Users), product (Reagent and Media, Equipment, Finished Cells, Other Products), source (Mammalian Cell Line, Non-mammalian Cell Line), and application (Recombinant Protein Expression, Hybridomas Technology, Vaccine Production, Drug Discovery, Other Applications). The global market size is projected to reach xx million USD by 2033.
Cell Line Development Industry Market Dynamics & Structure
The Cell Line Development industry is characterized by a moderately consolidated market structure, with several key players dominating significant market share. Technological innovation, driven by advancements in gene editing, automation, and high-throughput screening, is a key growth driver. Stringent regulatory frameworks governing cell line development and manufacturing, particularly in the pharmaceutical sector, significantly influence market dynamics. The industry also witnesses considerable M&A activity, as larger companies acquire smaller firms to gain access to novel technologies or expand their service offerings. Competitive product substitutes, such as alternative protein expression systems, present challenges, although the demand for highly specific and efficient cell lines remains strong.
- Market Concentration: Highly concentrated, with top 10 players holding approximately xx% market share in 2025.
- Technological Innovation: Significant investments in gene editing (CRISPR-Cas9), automation, and AI-driven cell line optimization.
- Regulatory Framework: Stringent guidelines from agencies like the FDA and EMA, impacting manufacturing and quality control.
- M&A Activity: High volume of mergers and acquisitions, especially in the CDMO sector, resulting in an estimated xx deals between 2019-2024.
- End-User Demographics: Significant growth driven by the burgeoning biopharmaceutical industry and increased research funding in academia.
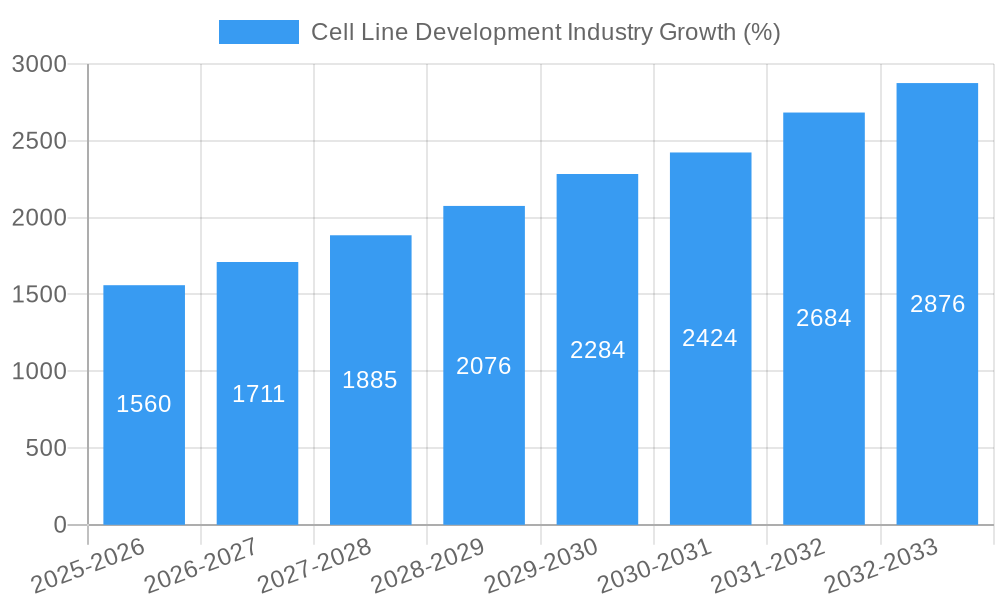
Cell Line Development Industry Growth Trends & Insights
The Cell Line Development market has experienced robust growth over the historical period (2019-2024), with a CAGR of xx%. This growth is primarily driven by the increasing demand for biologics, advanced therapies, and personalized medicine. The adoption rate of advanced cell line engineering technologies, like CRISPR-Cas9, is rapidly increasing, leading to the development of more efficient and cost-effective cell lines. Consumer behavior shifts toward personalized medicine and innovative therapies further fuel market expansion. The market is expected to maintain its strong growth trajectory during the forecast period (2025-2033), with a projected CAGR of xx%, driven by factors such as increasing R&D investments in the biopharmaceutical industry and the growing prevalence of chronic diseases. Market penetration of novel cell line development technologies is projected to reach xx% by 2033. Technological disruptions, like the development of next-generation sequencing and automated cell line screening platforms, will reshape the industry landscape.
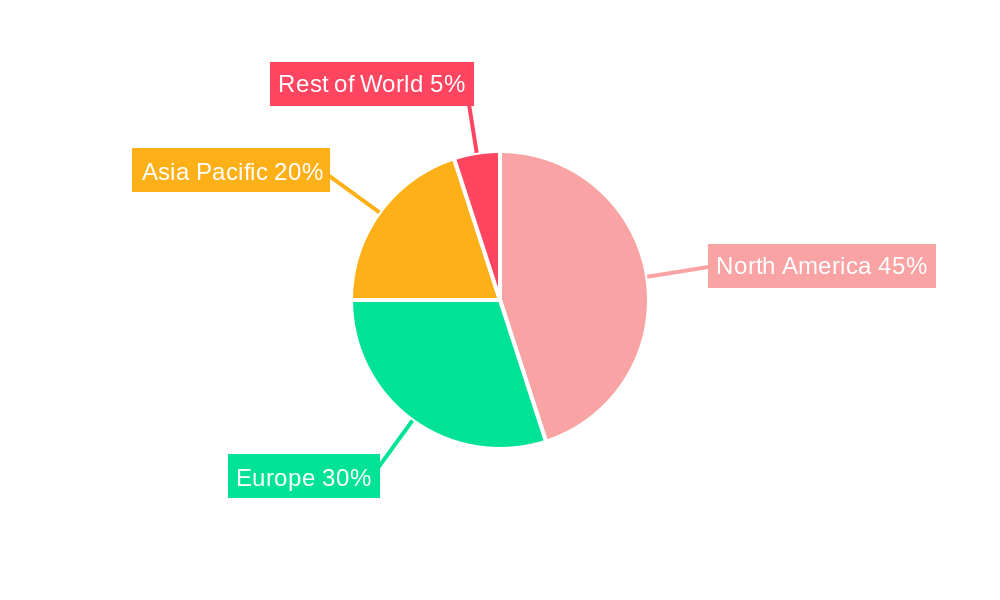
Dominant Regions, Countries, or Segments in Cell Line Development Industry
North America currently dominates the Cell Line Development market, driven by substantial R&D investments, a strong presence of major biopharmaceutical companies, and advanced regulatory frameworks. Europe follows as a significant market, benefitting from its robust life sciences ecosystem and increasing funding for research. Asia-Pacific is witnessing rapid growth fueled by a growing biopharmaceutical sector and increasing government support for R&D.
- Dominant End-User Segment: Biotech and Pharmaceutical Companies (holding approximately xx% market share in 2025).
- Dominant Product Segment: Reagent and Media (xx million USD in 2025).
- Dominant Source Segment: Mammalian Cell Line (holding a majority market share due to its suitability for complex protein expression)
- Dominant Application Segment: Recombinant Protein Expression (the largest application segment).
- Key Regional Drivers: Strong regulatory environment in North America, growing biopharmaceutical industry in Asia-Pacific, and well-established research infrastructure in Europe.
Cell Line Development Industry Product Landscape
The Cell Line Development industry offers a diverse range of products, including reagents and media, specialized equipment for cell culture and manipulation, and finished cell lines tailored for specific applications. Ongoing innovations focus on improving cell line performance, simplifying workflows, and enhancing scalability. These improvements involve the use of advanced gene editing tools, automation technologies, and sophisticated bioreactor systems. Unique selling propositions often center on the efficiency, yield, and consistency of the developed cell lines.
Key Drivers, Barriers & Challenges in Cell Line Development Industry
Key Drivers:
- Increasing demand for biologics and advanced therapies
- Advancements in gene editing technologies (e.g., CRISPR-Cas9)
- Growing investments in biotechnology and pharmaceutical R&D
Challenges & Restraints:
- High development costs and timelines
- Stringent regulatory requirements
- Intense competition among industry players, leading to pricing pressures. This is estimated to reduce overall profit margins by approximately xx% by 2033.
- Supply chain disruptions impacting the availability of critical raw materials.
Emerging Opportunities in Cell Line Development Industry
- Development of next-generation cell lines for personalized medicine
- Expansion into emerging markets in Asia-Pacific and Latin America
- Increased focus on sustainable and cost-effective cell line development processes
- Application of AI and machine learning for cell line optimization
Growth Accelerators in the Cell Line Development Industry
Technological advancements in gene editing, automation, and high-throughput screening are key growth catalysts. Strategic partnerships and collaborations between cell line development companies and biopharmaceutical firms are also driving market expansion. Furthermore, government initiatives aimed at promoting biotechnology and pharmaceutical R&D provide significant impetus.
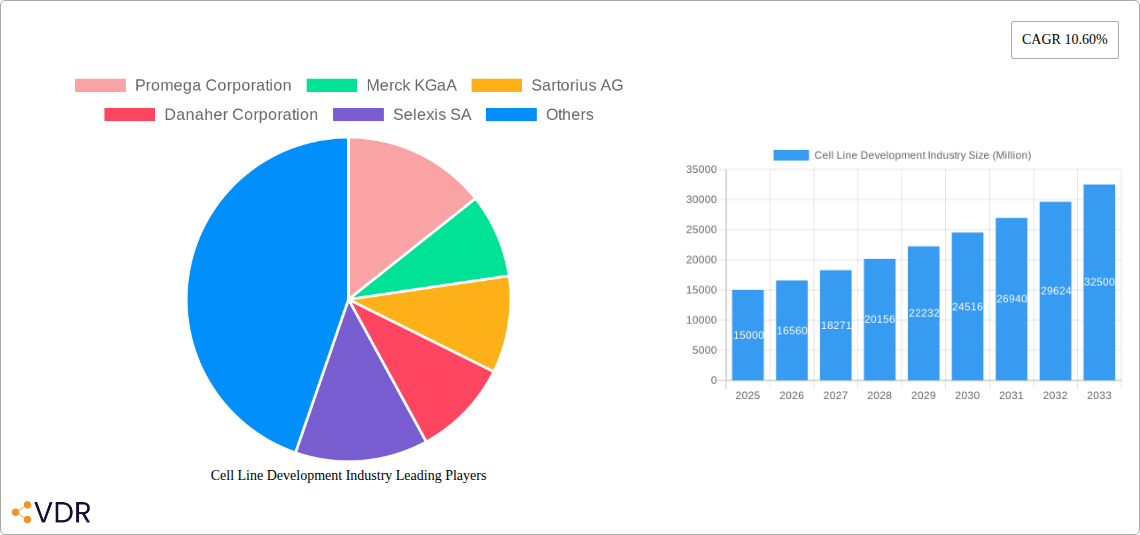
Key Players Shaping the Cell Line Development Industry Market
- Promega Corporation
- Merck KGaA
- Sartorius AG
- Danaher Corporation
- Selexis SA
- Fujifilm Corporation (Fujifilm Diosynth Biotechnologies)
- American Type Culture Collection (ATCC)
- WuXi Biologics
- Thermo Fisher Scientific
- Corning Incorporated
Notable Milestones in Cell Line Development Industry Sector
- July 2022: ProBioGen and Granite Bio collaborate to offer GMP manufacturing and cell line development services, focusing on a novel monoclonal antibody for autoimmune and cancer treatments using DirectedLuck transposase technology.
- June 2022: FUJIFILM Corporation invests USD 1.6 billion to expand FUJIFILM Diosynth Biotechnologies' cell culture manufacturing services.
In-Depth Cell Line Development Industry Market Outlook
The Cell Line Development industry is poised for continued strong growth, driven by technological advancements, increasing demand for biologics, and strategic collaborations. Significant opportunities exist in personalized medicine, advanced therapies, and emerging markets. Companies focusing on innovation, efficiency, and scalability will be best positioned to capitalize on the long-term growth potential.
Cell Line Development Industry Segmentation
-
1. Product
- 1.1. Reagent and Media
- 1.2. Equipment
- 1.3. Finished Cells
- 1.4. Other Products
-
2. Source
- 2.1. Mammalian Cell Line
- 2.2. Non-mammalian Cell Line
-
3. Application
- 3.1. Recombinant Protein Expression
- 3.2. Hybridomas Technology
- 3.3. Vaccine Production
- 3.4. Drug Discovery
- 3.5. Other Applications
-
4. End User
- 4.1. Biotech and Pharmaceutical Companies
- 4.2. Academics and Research Institutes
- 4.3. Other End Users
Cell Line Development Industry Segmentation By Geography
-
1. North America
- 1.1. United States
- 1.2. Canada
- 1.3. Mexico
-
2. Europe
- 2.1. Germany
- 2.2. United Kingdom
- 2.3. France
- 2.4. Italy
- 2.5. Spain
- 2.6. Rest of Europe
-
3. Asia Pacific
- 3.1. China
- 3.2. Japan
- 3.3. India
- 3.4. Australia
- 3.5. South Korea
- 3.6. Rest of Asia Pacific
-
4. Middle East and Africa
- 4.1. GCC
- 4.2. South Africa
- 4.3. Rest of Middle East and Africa
-
5. South America
- 5.1. Brazil
- 5.2. Argentina
- 5.3. Rest of South America
Cell Line Development Industry REPORT HIGHLIGHTS
| Aspects | Details |
|---|---|
| Study Period | 2019-2033 |
| Base Year | 2024 |
| Estimated Year | 2025 |
| Forecast Period | 2025-2033 |
| Historical Period | 2019-2024 |
| Growth Rate | CAGR of 10.60% from 2019-2033 |
| Segmentation |
|
Table of Contents
- 1. Introduction
- 1.1. Research Scope
- 1.2. Market Segmentation
- 1.3. Research Methodology
- 1.4. Definitions and Assumptions
- 2. Executive Summary
- 2.1. Introduction
- 3. Market Dynamics
- 3.1. Introduction
- 3.2. Market Drivers
- 3.2.1. Growing Biopharmaceutical Industry; Rising Demand for Monoclonal Antibodies and Cancer Therapeutics; Growing Production of Biosimilars Due to the Patent Expiry of Branded Therapeutics
- 3.3. Market Restrains
- 3.3.1. Strict Regulations; Time Taking Process
- 3.4. Market Trends
- 3.4.1. Mammalian Cell Line Development is Expected to Register Rapid Growth Over the Forecast Period
- 4. Market Factor Analysis
- 4.1. Porters Five Forces
- 4.2. Supply/Value Chain
- 4.3. PESTEL analysis
- 4.4. Market Entropy
- 4.5. Patent/Trademark Analysis
- 5. Global Cell Line Development Industry Analysis, Insights and Forecast, 2019-2031
- 5.1. Market Analysis, Insights and Forecast - by Product
- 5.1.1. Reagent and Media
- 5.1.2. Equipment
- 5.1.3. Finished Cells
- 5.1.4. Other Products
- 5.2. Market Analysis, Insights and Forecast - by Source
- 5.2.1. Mammalian Cell Line
- 5.2.2. Non-mammalian Cell Line
- 5.3. Market Analysis, Insights and Forecast - by Application
- 5.3.1. Recombinant Protein Expression
- 5.3.2. Hybridomas Technology
- 5.3.3. Vaccine Production
- 5.3.4. Drug Discovery
- 5.3.5. Other Applications
- 5.4. Market Analysis, Insights and Forecast - by End User
- 5.4.1. Biotech and Pharmaceutical Companies
- 5.4.2. Academics and Research Institutes
- 5.4.3. Other End Users
- 5.5. Market Analysis, Insights and Forecast - by Region
- 5.5.1. North America
- 5.5.2. Europe
- 5.5.3. Asia Pacific
- 5.5.4. Middle East and Africa
- 5.5.5. South America
- 5.1. Market Analysis, Insights and Forecast - by Product
- 6. North America Cell Line Development Industry Analysis, Insights and Forecast, 2019-2031
- 6.1. Market Analysis, Insights and Forecast - by Product
- 6.1.1. Reagent and Media
- 6.1.2. Equipment
- 6.1.3. Finished Cells
- 6.1.4. Other Products
- 6.2. Market Analysis, Insights and Forecast - by Source
- 6.2.1. Mammalian Cell Line
- 6.2.2. Non-mammalian Cell Line
- 6.3. Market Analysis, Insights and Forecast - by Application
- 6.3.1. Recombinant Protein Expression
- 6.3.2. Hybridomas Technology
- 6.3.3. Vaccine Production
- 6.3.4. Drug Discovery
- 6.3.5. Other Applications
- 6.4. Market Analysis, Insights and Forecast - by End User
- 6.4.1. Biotech and Pharmaceutical Companies
- 6.4.2. Academics and Research Institutes
- 6.4.3. Other End Users
- 6.1. Market Analysis, Insights and Forecast - by Product
- 7. Europe Cell Line Development Industry Analysis, Insights and Forecast, 2019-2031
- 7.1. Market Analysis, Insights and Forecast - by Product
- 7.1.1. Reagent and Media
- 7.1.2. Equipment
- 7.1.3. Finished Cells
- 7.1.4. Other Products
- 7.2. Market Analysis, Insights and Forecast - by Source
- 7.2.1. Mammalian Cell Line
- 7.2.2. Non-mammalian Cell Line
- 7.3. Market Analysis, Insights and Forecast - by Application
- 7.3.1. Recombinant Protein Expression
- 7.3.2. Hybridomas Technology
- 7.3.3. Vaccine Production
- 7.3.4. Drug Discovery
- 7.3.5. Other Applications
- 7.4. Market Analysis, Insights and Forecast - by End User
- 7.4.1. Biotech and Pharmaceutical Companies
- 7.4.2. Academics and Research Institutes
- 7.4.3. Other End Users
- 7.1. Market Analysis, Insights and Forecast - by Product
- 8. Asia Pacific Cell Line Development Industry Analysis, Insights and Forecast, 2019-2031
- 8.1. Market Analysis, Insights and Forecast - by Product
- 8.1.1. Reagent and Media
- 8.1.2. Equipment
- 8.1.3. Finished Cells
- 8.1.4. Other Products
- 8.2. Market Analysis, Insights and Forecast - by Source
- 8.2.1. Mammalian Cell Line
- 8.2.2. Non-mammalian Cell Line
- 8.3. Market Analysis, Insights and Forecast - by Application
- 8.3.1. Recombinant Protein Expression
- 8.3.2. Hybridomas Technology
- 8.3.3. Vaccine Production
- 8.3.4. Drug Discovery
- 8.3.5. Other Applications
- 8.4. Market Analysis, Insights and Forecast - by End User
- 8.4.1. Biotech and Pharmaceutical Companies
- 8.4.2. Academics and Research Institutes
- 8.4.3. Other End Users
- 8.1. Market Analysis, Insights and Forecast - by Product
- 9. Middle East and Africa Cell Line Development Industry Analysis, Insights and Forecast, 2019-2031
- 9.1. Market Analysis, Insights and Forecast - by Product
- 9.1.1. Reagent and Media
- 9.1.2. Equipment
- 9.1.3. Finished Cells
- 9.1.4. Other Products
- 9.2. Market Analysis, Insights and Forecast - by Source
- 9.2.1. Mammalian Cell Line
- 9.2.2. Non-mammalian Cell Line
- 9.3. Market Analysis, Insights and Forecast - by Application
- 9.3.1. Recombinant Protein Expression
- 9.3.2. Hybridomas Technology
- 9.3.3. Vaccine Production
- 9.3.4. Drug Discovery
- 9.3.5. Other Applications
- 9.4. Market Analysis, Insights and Forecast - by End User
- 9.4.1. Biotech and Pharmaceutical Companies
- 9.4.2. Academics and Research Institutes
- 9.4.3. Other End Users
- 9.1. Market Analysis, Insights and Forecast - by Product
- 10. South America Cell Line Development Industry Analysis, Insights and Forecast, 2019-2031
- 10.1. Market Analysis, Insights and Forecast - by Product
- 10.1.1. Reagent and Media
- 10.1.2. Equipment
- 10.1.3. Finished Cells
- 10.1.4. Other Products
- 10.2. Market Analysis, Insights and Forecast - by Source
- 10.2.1. Mammalian Cell Line
- 10.2.2. Non-mammalian Cell Line
- 10.3. Market Analysis, Insights and Forecast - by Application
- 10.3.1. Recombinant Protein Expression
- 10.3.2. Hybridomas Technology
- 10.3.3. Vaccine Production
- 10.3.4. Drug Discovery
- 10.3.5. Other Applications
- 10.4. Market Analysis, Insights and Forecast - by End User
- 10.4.1. Biotech and Pharmaceutical Companies
- 10.4.2. Academics and Research Institutes
- 10.4.3. Other End Users
- 10.1. Market Analysis, Insights and Forecast - by Product
- 11. North America Cell Line Development Industry Analysis, Insights and Forecast, 2019-2031
- 11.1. Market Analysis, Insights and Forecast - By Country/Sub-region
- 11.1.1 United States
- 11.1.2 Canada
- 11.1.3 Mexico
- 12. Europe Cell Line Development Industry Analysis, Insights and Forecast, 2019-2031
- 12.1. Market Analysis, Insights and Forecast - By Country/Sub-region
- 12.1.1 Germany
- 12.1.2 United Kingdom
- 12.1.3 France
- 12.1.4 Italy
- 12.1.5 Spain
- 12.1.6 Rest of Europe
- 13. Asia Pacific Cell Line Development Industry Analysis, Insights and Forecast, 2019-2031
- 13.1. Market Analysis, Insights and Forecast - By Country/Sub-region
- 13.1.1 China
- 13.1.2 Japan
- 13.1.3 India
- 13.1.4 Australia
- 13.1.5 South Korea
- 13.1.6 Rest of Asia Pacific
- 14. Middle East and Africa Cell Line Development Industry Analysis, Insights and Forecast, 2019-2031
- 14.1. Market Analysis, Insights and Forecast - By Country/Sub-region
- 14.1.1 GCC
- 14.1.2 South Africa
- 14.1.3 Rest of Middle East and Africa
- 15. South America Cell Line Development Industry Analysis, Insights and Forecast, 2019-2031
- 15.1. Market Analysis, Insights and Forecast - By Country/Sub-region
- 15.1.1 Brazil
- 15.1.2 Argentina
- 15.1.3 Rest of South America
- 16. Competitive Analysis
- 16.1. Global Market Share Analysis 2024
- 16.2. Company Profiles
- 16.2.1 Promega Corporation
- 16.2.1.1. Overview
- 16.2.1.2. Products
- 16.2.1.3. SWOT Analysis
- 16.2.1.4. Recent Developments
- 16.2.1.5. Financials (Based on Availability)
- 16.2.2 Merck KGaA
- 16.2.2.1. Overview
- 16.2.2.2. Products
- 16.2.2.3. SWOT Analysis
- 16.2.2.4. Recent Developments
- 16.2.2.5. Financials (Based on Availability)
- 16.2.3 Sartorius AG
- 16.2.3.1. Overview
- 16.2.3.2. Products
- 16.2.3.3. SWOT Analysis
- 16.2.3.4. Recent Developments
- 16.2.3.5. Financials (Based on Availability)
- 16.2.4 Danaher Corporation
- 16.2.4.1. Overview
- 16.2.4.2. Products
- 16.2.4.3. SWOT Analysis
- 16.2.4.4. Recent Developments
- 16.2.4.5. Financials (Based on Availability)
- 16.2.5 Selexis SA
- 16.2.5.1. Overview
- 16.2.5.2. Products
- 16.2.5.3. SWOT Analysis
- 16.2.5.4. Recent Developments
- 16.2.5.5. Financials (Based on Availability)
- 16.2.6 Fujifilm Corporation (Fujifilm Diosynth Biotechnologies)
- 16.2.6.1. Overview
- 16.2.6.2. Products
- 16.2.6.3. SWOT Analysis
- 16.2.6.4. Recent Developments
- 16.2.6.5. Financials (Based on Availability)
- 16.2.7 American Type Culture Collection (ATCC)
- 16.2.7.1. Overview
- 16.2.7.2. Products
- 16.2.7.3. SWOT Analysis
- 16.2.7.4. Recent Developments
- 16.2.7.5. Financials (Based on Availability)
- 16.2.8 WuXi Biologics
- 16.2.8.1. Overview
- 16.2.8.2. Products
- 16.2.8.3. SWOT Analysis
- 16.2.8.4. Recent Developments
- 16.2.8.5. Financials (Based on Availability)
- 16.2.9 Thermo Fisher Scientific
- 16.2.9.1. Overview
- 16.2.9.2. Products
- 16.2.9.3. SWOT Analysis
- 16.2.9.4. Recent Developments
- 16.2.9.5. Financials (Based on Availability)
- 16.2.10 Corning Incorporated
- 16.2.10.1. Overview
- 16.2.10.2. Products
- 16.2.10.3. SWOT Analysis
- 16.2.10.4. Recent Developments
- 16.2.10.5. Financials (Based on Availability)
- 16.2.1 Promega Corporation
List of Figures
- Figure 1: Global Cell Line Development Industry Revenue Breakdown (Million, %) by Region 2024 & 2032
- Figure 2: Global Cell Line Development Industry Volume Breakdown (K Unit, %) by Region 2024 & 2032
- Figure 3: North America Cell Line Development Industry Revenue (Million), by Country 2024 & 2032
- Figure 4: North America Cell Line Development Industry Volume (K Unit), by Country 2024 & 2032
- Figure 5: North America Cell Line Development Industry Revenue Share (%), by Country 2024 & 2032
- Figure 6: North America Cell Line Development Industry Volume Share (%), by Country 2024 & 2032
- Figure 7: Europe Cell Line Development Industry Revenue (Million), by Country 2024 & 2032
- Figure 8: Europe Cell Line Development Industry Volume (K Unit), by Country 2024 & 2032
- Figure 9: Europe Cell Line Development Industry Revenue Share (%), by Country 2024 & 2032
- Figure 10: Europe Cell Line Development Industry Volume Share (%), by Country 2024 & 2032
- Figure 11: Asia Pacific Cell Line Development Industry Revenue (Million), by Country 2024 & 2032
- Figure 12: Asia Pacific Cell Line Development Industry Volume (K Unit), by Country 2024 & 2032
- Figure 13: Asia Pacific Cell Line Development Industry Revenue Share (%), by Country 2024 & 2032
- Figure 14: Asia Pacific Cell Line Development Industry Volume Share (%), by Country 2024 & 2032
- Figure 15: Middle East and Africa Cell Line Development Industry Revenue (Million), by Country 2024 & 2032
- Figure 16: Middle East and Africa Cell Line Development Industry Volume (K Unit), by Country 2024 & 2032
- Figure 17: Middle East and Africa Cell Line Development Industry Revenue Share (%), by Country 2024 & 2032
- Figure 18: Middle East and Africa Cell Line Development Industry Volume Share (%), by Country 2024 & 2032
- Figure 19: South America Cell Line Development Industry Revenue (Million), by Country 2024 & 2032
- Figure 20: South America Cell Line Development Industry Volume (K Unit), by Country 2024 & 2032
- Figure 21: South America Cell Line Development Industry Revenue Share (%), by Country 2024 & 2032
- Figure 22: South America Cell Line Development Industry Volume Share (%), by Country 2024 & 2032
- Figure 23: North America Cell Line Development Industry Revenue (Million), by Product 2024 & 2032
- Figure 24: North America Cell Line Development Industry Volume (K Unit), by Product 2024 & 2032
- Figure 25: North America Cell Line Development Industry Revenue Share (%), by Product 2024 & 2032
- Figure 26: North America Cell Line Development Industry Volume Share (%), by Product 2024 & 2032
- Figure 27: North America Cell Line Development Industry Revenue (Million), by Source 2024 & 2032
- Figure 28: North America Cell Line Development Industry Volume (K Unit), by Source 2024 & 2032
- Figure 29: North America Cell Line Development Industry Revenue Share (%), by Source 2024 & 2032
- Figure 30: North America Cell Line Development Industry Volume Share (%), by Source 2024 & 2032
- Figure 31: North America Cell Line Development Industry Revenue (Million), by Application 2024 & 2032
- Figure 32: North America Cell Line Development Industry Volume (K Unit), by Application 2024 & 2032
- Figure 33: North America Cell Line Development Industry Revenue Share (%), by Application 2024 & 2032
- Figure 34: North America Cell Line Development Industry Volume Share (%), by Application 2024 & 2032
- Figure 35: North America Cell Line Development Industry Revenue (Million), by End User 2024 & 2032
- Figure 36: North America Cell Line Development Industry Volume (K Unit), by End User 2024 & 2032
- Figure 37: North America Cell Line Development Industry Revenue Share (%), by End User 2024 & 2032
- Figure 38: North America Cell Line Development Industry Volume Share (%), by End User 2024 & 2032
- Figure 39: North America Cell Line Development Industry Revenue (Million), by Country 2024 & 2032
- Figure 40: North America Cell Line Development Industry Volume (K Unit), by Country 2024 & 2032
- Figure 41: North America Cell Line Development Industry Revenue Share (%), by Country 2024 & 2032
- Figure 42: North America Cell Line Development Industry Volume Share (%), by Country 2024 & 2032
- Figure 43: Europe Cell Line Development Industry Revenue (Million), by Product 2024 & 2032
- Figure 44: Europe Cell Line Development Industry Volume (K Unit), by Product 2024 & 2032
- Figure 45: Europe Cell Line Development Industry Revenue Share (%), by Product 2024 & 2032
- Figure 46: Europe Cell Line Development Industry Volume Share (%), by Product 2024 & 2032
- Figure 47: Europe Cell Line Development Industry Revenue (Million), by Source 2024 & 2032
- Figure 48: Europe Cell Line Development Industry Volume (K Unit), by Source 2024 & 2032
- Figure 49: Europe Cell Line Development Industry Revenue Share (%), by Source 2024 & 2032
- Figure 50: Europe Cell Line Development Industry Volume Share (%), by Source 2024 & 2032
- Figure 51: Europe Cell Line Development Industry Revenue (Million), by Application 2024 & 2032
- Figure 52: Europe Cell Line Development Industry Volume (K Unit), by Application 2024 & 2032
- Figure 53: Europe Cell Line Development Industry Revenue Share (%), by Application 2024 & 2032
- Figure 54: Europe Cell Line Development Industry Volume Share (%), by Application 2024 & 2032
- Figure 55: Europe Cell Line Development Industry Revenue (Million), by End User 2024 & 2032
- Figure 56: Europe Cell Line Development Industry Volume (K Unit), by End User 2024 & 2032
- Figure 57: Europe Cell Line Development Industry Revenue Share (%), by End User 2024 & 2032
- Figure 58: Europe Cell Line Development Industry Volume Share (%), by End User 2024 & 2032
- Figure 59: Europe Cell Line Development Industry Revenue (Million), by Country 2024 & 2032
- Figure 60: Europe Cell Line Development Industry Volume (K Unit), by Country 2024 & 2032
- Figure 61: Europe Cell Line Development Industry Revenue Share (%), by Country 2024 & 2032
- Figure 62: Europe Cell Line Development Industry Volume Share (%), by Country 2024 & 2032
- Figure 63: Asia Pacific Cell Line Development Industry Revenue (Million), by Product 2024 & 2032
- Figure 64: Asia Pacific Cell Line Development Industry Volume (K Unit), by Product 2024 & 2032
- Figure 65: Asia Pacific Cell Line Development Industry Revenue Share (%), by Product 2024 & 2032
- Figure 66: Asia Pacific Cell Line Development Industry Volume Share (%), by Product 2024 & 2032
- Figure 67: Asia Pacific Cell Line Development Industry Revenue (Million), by Source 2024 & 2032
- Figure 68: Asia Pacific Cell Line Development Industry Volume (K Unit), by Source 2024 & 2032
- Figure 69: Asia Pacific Cell Line Development Industry Revenue Share (%), by Source 2024 & 2032
- Figure 70: Asia Pacific Cell Line Development Industry Volume Share (%), by Source 2024 & 2032
- Figure 71: Asia Pacific Cell Line Development Industry Revenue (Million), by Application 2024 & 2032
- Figure 72: Asia Pacific Cell Line Development Industry Volume (K Unit), by Application 2024 & 2032
- Figure 73: Asia Pacific Cell Line Development Industry Revenue Share (%), by Application 2024 & 2032
- Figure 74: Asia Pacific Cell Line Development Industry Volume Share (%), by Application 2024 & 2032
- Figure 75: Asia Pacific Cell Line Development Industry Revenue (Million), by End User 2024 & 2032
- Figure 76: Asia Pacific Cell Line Development Industry Volume (K Unit), by End User 2024 & 2032
- Figure 77: Asia Pacific Cell Line Development Industry Revenue Share (%), by End User 2024 & 2032
- Figure 78: Asia Pacific Cell Line Development Industry Volume Share (%), by End User 2024 & 2032
- Figure 79: Asia Pacific Cell Line Development Industry Revenue (Million), by Country 2024 & 2032
- Figure 80: Asia Pacific Cell Line Development Industry Volume (K Unit), by Country 2024 & 2032
- Figure 81: Asia Pacific Cell Line Development Industry Revenue Share (%), by Country 2024 & 2032
- Figure 82: Asia Pacific Cell Line Development Industry Volume Share (%), by Country 2024 & 2032
- Figure 83: Middle East and Africa Cell Line Development Industry Revenue (Million), by Product 2024 & 2032
- Figure 84: Middle East and Africa Cell Line Development Industry Volume (K Unit), by Product 2024 & 2032
- Figure 85: Middle East and Africa Cell Line Development Industry Revenue Share (%), by Product 2024 & 2032
- Figure 86: Middle East and Africa Cell Line Development Industry Volume Share (%), by Product 2024 & 2032
- Figure 87: Middle East and Africa Cell Line Development Industry Revenue (Million), by Source 2024 & 2032
- Figure 88: Middle East and Africa Cell Line Development Industry Volume (K Unit), by Source 2024 & 2032
- Figure 89: Middle East and Africa Cell Line Development Industry Revenue Share (%), by Source 2024 & 2032
- Figure 90: Middle East and Africa Cell Line Development Industry Volume Share (%), by Source 2024 & 2032
- Figure 91: Middle East and Africa Cell Line Development Industry Revenue (Million), by Application 2024 & 2032
- Figure 92: Middle East and Africa Cell Line Development Industry Volume (K Unit), by Application 2024 & 2032
- Figure 93: Middle East and Africa Cell Line Development Industry Revenue Share (%), by Application 2024 & 2032
- Figure 94: Middle East and Africa Cell Line Development Industry Volume Share (%), by Application 2024 & 2032
- Figure 95: Middle East and Africa Cell Line Development Industry Revenue (Million), by End User 2024 & 2032
- Figure 96: Middle East and Africa Cell Line Development Industry Volume (K Unit), by End User 2024 & 2032
- Figure 97: Middle East and Africa Cell Line Development Industry Revenue Share (%), by End User 2024 & 2032
- Figure 98: Middle East and Africa Cell Line Development Industry Volume Share (%), by End User 2024 & 2032
- Figure 99: Middle East and Africa Cell Line Development Industry Revenue (Million), by Country 2024 & 2032
- Figure 100: Middle East and Africa Cell Line Development Industry Volume (K Unit), by Country 2024 & 2032
- Figure 101: Middle East and Africa Cell Line Development Industry Revenue Share (%), by Country 2024 & 2032
- Figure 102: Middle East and Africa Cell Line Development Industry Volume Share (%), by Country 2024 & 2032
- Figure 103: South America Cell Line Development Industry Revenue (Million), by Product 2024 & 2032
- Figure 104: South America Cell Line Development Industry Volume (K Unit), by Product 2024 & 2032
- Figure 105: South America Cell Line Development Industry Revenue Share (%), by Product 2024 & 2032
- Figure 106: South America Cell Line Development Industry Volume Share (%), by Product 2024 & 2032
- Figure 107: South America Cell Line Development Industry Revenue (Million), by Source 2024 & 2032
- Figure 108: South America Cell Line Development Industry Volume (K Unit), by Source 2024 & 2032
- Figure 109: South America Cell Line Development Industry Revenue Share (%), by Source 2024 & 2032
- Figure 110: South America Cell Line Development Industry Volume Share (%), by Source 2024 & 2032
- Figure 111: South America Cell Line Development Industry Revenue (Million), by Application 2024 & 2032
- Figure 112: South America Cell Line Development Industry Volume (K Unit), by Application 2024 & 2032
- Figure 113: South America Cell Line Development Industry Revenue Share (%), by Application 2024 & 2032
- Figure 114: South America Cell Line Development Industry Volume Share (%), by Application 2024 & 2032
- Figure 115: South America Cell Line Development Industry Revenue (Million), by End User 2024 & 2032
- Figure 116: South America Cell Line Development Industry Volume (K Unit), by End User 2024 & 2032
- Figure 117: South America Cell Line Development Industry Revenue Share (%), by End User 2024 & 2032
- Figure 118: South America Cell Line Development Industry Volume Share (%), by End User 2024 & 2032
- Figure 119: South America Cell Line Development Industry Revenue (Million), by Country 2024 & 2032
- Figure 120: South America Cell Line Development Industry Volume (K Unit), by Country 2024 & 2032
- Figure 121: South America Cell Line Development Industry Revenue Share (%), by Country 2024 & 2032
- Figure 122: South America Cell Line Development Industry Volume Share (%), by Country 2024 & 2032
List of Tables
- Table 1: Global Cell Line Development Industry Revenue Million Forecast, by Region 2019 & 2032
- Table 2: Global Cell Line Development Industry Volume K Unit Forecast, by Region 2019 & 2032
- Table 3: Global Cell Line Development Industry Revenue Million Forecast, by Product 2019 & 2032
- Table 4: Global Cell Line Development Industry Volume K Unit Forecast, by Product 2019 & 2032
- Table 5: Global Cell Line Development Industry Revenue Million Forecast, by Source 2019 & 2032
- Table 6: Global Cell Line Development Industry Volume K Unit Forecast, by Source 2019 & 2032
- Table 7: Global Cell Line Development Industry Revenue Million Forecast, by Application 2019 & 2032
- Table 8: Global Cell Line Development Industry Volume K Unit Forecast, by Application 2019 & 2032
- Table 9: Global Cell Line Development Industry Revenue Million Forecast, by End User 2019 & 2032
- Table 10: Global Cell Line Development Industry Volume K Unit Forecast, by End User 2019 & 2032
- Table 11: Global Cell Line Development Industry Revenue Million Forecast, by Region 2019 & 2032
- Table 12: Global Cell Line Development Industry Volume K Unit Forecast, by Region 2019 & 2032
- Table 13: Global Cell Line Development Industry Revenue Million Forecast, by Country 2019 & 2032
- Table 14: Global Cell Line Development Industry Volume K Unit Forecast, by Country 2019 & 2032
- Table 15: United States Cell Line Development Industry Revenue (Million) Forecast, by Application 2019 & 2032
- Table 16: United States Cell Line Development Industry Volume (K Unit) Forecast, by Application 2019 & 2032
- Table 17: Canada Cell Line Development Industry Revenue (Million) Forecast, by Application 2019 & 2032
- Table 18: Canada Cell Line Development Industry Volume (K Unit) Forecast, by Application 2019 & 2032
- Table 19: Mexico Cell Line Development Industry Revenue (Million) Forecast, by Application 2019 & 2032
- Table 20: Mexico Cell Line Development Industry Volume (K Unit) Forecast, by Application 2019 & 2032
- Table 21: Global Cell Line Development Industry Revenue Million Forecast, by Country 2019 & 2032
- Table 22: Global Cell Line Development Industry Volume K Unit Forecast, by Country 2019 & 2032
- Table 23: Germany Cell Line Development Industry Revenue (Million) Forecast, by Application 2019 & 2032
- Table 24: Germany Cell Line Development Industry Volume (K Unit) Forecast, by Application 2019 & 2032
- Table 25: United Kingdom Cell Line Development Industry Revenue (Million) Forecast, by Application 2019 & 2032
- Table 26: United Kingdom Cell Line Development Industry Volume (K Unit) Forecast, by Application 2019 & 2032
- Table 27: France Cell Line Development Industry Revenue (Million) Forecast, by Application 2019 & 2032
- Table 28: France Cell Line Development Industry Volume (K Unit) Forecast, by Application 2019 & 2032
- Table 29: Italy Cell Line Development Industry Revenue (Million) Forecast, by Application 2019 & 2032
- Table 30: Italy Cell Line Development Industry Volume (K Unit) Forecast, by Application 2019 & 2032
- Table 31: Spain Cell Line Development Industry Revenue (Million) Forecast, by Application 2019 & 2032
- Table 32: Spain Cell Line Development Industry Volume (K Unit) Forecast, by Application 2019 & 2032
- Table 33: Rest of Europe Cell Line Development Industry Revenue (Million) Forecast, by Application 2019 & 2032
- Table 34: Rest of Europe Cell Line Development Industry Volume (K Unit) Forecast, by Application 2019 & 2032
- Table 35: Global Cell Line Development Industry Revenue Million Forecast, by Country 2019 & 2032
- Table 36: Global Cell Line Development Industry Volume K Unit Forecast, by Country 2019 & 2032
- Table 37: China Cell Line Development Industry Revenue (Million) Forecast, by Application 2019 & 2032
- Table 38: China Cell Line Development Industry Volume (K Unit) Forecast, by Application 2019 & 2032
- Table 39: Japan Cell Line Development Industry Revenue (Million) Forecast, by Application 2019 & 2032
- Table 40: Japan Cell Line Development Industry Volume (K Unit) Forecast, by Application 2019 & 2032
- Table 41: India Cell Line Development Industry Revenue (Million) Forecast, by Application 2019 & 2032
- Table 42: India Cell Line Development Industry Volume (K Unit) Forecast, by Application 2019 & 2032
- Table 43: Australia Cell Line Development Industry Revenue (Million) Forecast, by Application 2019 & 2032
- Table 44: Australia Cell Line Development Industry Volume (K Unit) Forecast, by Application 2019 & 2032
- Table 45: South Korea Cell Line Development Industry Revenue (Million) Forecast, by Application 2019 & 2032
- Table 46: South Korea Cell Line Development Industry Volume (K Unit) Forecast, by Application 2019 & 2032
- Table 47: Rest of Asia Pacific Cell Line Development Industry Revenue (Million) Forecast, by Application 2019 & 2032
- Table 48: Rest of Asia Pacific Cell Line Development Industry Volume (K Unit) Forecast, by Application 2019 & 2032
- Table 49: Global Cell Line Development Industry Revenue Million Forecast, by Country 2019 & 2032
- Table 50: Global Cell Line Development Industry Volume K Unit Forecast, by Country 2019 & 2032
- Table 51: GCC Cell Line Development Industry Revenue (Million) Forecast, by Application 2019 & 2032
- Table 52: GCC Cell Line Development Industry Volume (K Unit) Forecast, by Application 2019 & 2032
- Table 53: South Africa Cell Line Development Industry Revenue (Million) Forecast, by Application 2019 & 2032
- Table 54: South Africa Cell Line Development Industry Volume (K Unit) Forecast, by Application 2019 & 2032
- Table 55: Rest of Middle East and Africa Cell Line Development Industry Revenue (Million) Forecast, by Application 2019 & 2032
- Table 56: Rest of Middle East and Africa Cell Line Development Industry Volume (K Unit) Forecast, by Application 2019 & 2032
- Table 57: Global Cell Line Development Industry Revenue Million Forecast, by Country 2019 & 2032
- Table 58: Global Cell Line Development Industry Volume K Unit Forecast, by Country 2019 & 2032
- Table 59: Brazil Cell Line Development Industry Revenue (Million) Forecast, by Application 2019 & 2032
- Table 60: Brazil Cell Line Development Industry Volume (K Unit) Forecast, by Application 2019 & 2032
- Table 61: Argentina Cell Line Development Industry Revenue (Million) Forecast, by Application 2019 & 2032
- Table 62: Argentina Cell Line Development Industry Volume (K Unit) Forecast, by Application 2019 & 2032
- Table 63: Rest of South America Cell Line Development Industry Revenue (Million) Forecast, by Application 2019 & 2032
- Table 64: Rest of South America Cell Line Development Industry Volume (K Unit) Forecast, by Application 2019 & 2032
- Table 65: Global Cell Line Development Industry Revenue Million Forecast, by Product 2019 & 2032
- Table 66: Global Cell Line Development Industry Volume K Unit Forecast, by Product 2019 & 2032
- Table 67: Global Cell Line Development Industry Revenue Million Forecast, by Source 2019 & 2032
- Table 68: Global Cell Line Development Industry Volume K Unit Forecast, by Source 2019 & 2032
- Table 69: Global Cell Line Development Industry Revenue Million Forecast, by Application 2019 & 2032
- Table 70: Global Cell Line Development Industry Volume K Unit Forecast, by Application 2019 & 2032
- Table 71: Global Cell Line Development Industry Revenue Million Forecast, by End User 2019 & 2032
- Table 72: Global Cell Line Development Industry Volume K Unit Forecast, by End User 2019 & 2032
- Table 73: Global Cell Line Development Industry Revenue Million Forecast, by Country 2019 & 2032
- Table 74: Global Cell Line Development Industry Volume K Unit Forecast, by Country 2019 & 2032
- Table 75: United States Cell Line Development Industry Revenue (Million) Forecast, by Application 2019 & 2032
- Table 76: United States Cell Line Development Industry Volume (K Unit) Forecast, by Application 2019 & 2032
- Table 77: Canada Cell Line Development Industry Revenue (Million) Forecast, by Application 2019 & 2032
- Table 78: Canada Cell Line Development Industry Volume (K Unit) Forecast, by Application 2019 & 2032
- Table 79: Mexico Cell Line Development Industry Revenue (Million) Forecast, by Application 2019 & 2032
- Table 80: Mexico Cell Line Development Industry Volume (K Unit) Forecast, by Application 2019 & 2032
- Table 81: Global Cell Line Development Industry Revenue Million Forecast, by Product 2019 & 2032
- Table 82: Global Cell Line Development Industry Volume K Unit Forecast, by Product 2019 & 2032
- Table 83: Global Cell Line Development Industry Revenue Million Forecast, by Source 2019 & 2032
- Table 84: Global Cell Line Development Industry Volume K Unit Forecast, by Source 2019 & 2032
- Table 85: Global Cell Line Development Industry Revenue Million Forecast, by Application 2019 & 2032
- Table 86: Global Cell Line Development Industry Volume K Unit Forecast, by Application 2019 & 2032
- Table 87: Global Cell Line Development Industry Revenue Million Forecast, by End User 2019 & 2032
- Table 88: Global Cell Line Development Industry Volume K Unit Forecast, by End User 2019 & 2032
- Table 89: Global Cell Line Development Industry Revenue Million Forecast, by Country 2019 & 2032
- Table 90: Global Cell Line Development Industry Volume K Unit Forecast, by Country 2019 & 2032
- Table 91: Germany Cell Line Development Industry Revenue (Million) Forecast, by Application 2019 & 2032
- Table 92: Germany Cell Line Development Industry Volume (K Unit) Forecast, by Application 2019 & 2032
- Table 93: United Kingdom Cell Line Development Industry Revenue (Million) Forecast, by Application 2019 & 2032
- Table 94: United Kingdom Cell Line Development Industry Volume (K Unit) Forecast, by Application 2019 & 2032
- Table 95: France Cell Line Development Industry Revenue (Million) Forecast, by Application 2019 & 2032
- Table 96: France Cell Line Development Industry Volume (K Unit) Forecast, by Application 2019 & 2032
- Table 97: Italy Cell Line Development Industry Revenue (Million) Forecast, by Application 2019 & 2032
- Table 98: Italy Cell Line Development Industry Volume (K Unit) Forecast, by Application 2019 & 2032
- Table 99: Spain Cell Line Development Industry Revenue (Million) Forecast, by Application 2019 & 2032
- Table 100: Spain Cell Line Development Industry Volume (K Unit) Forecast, by Application 2019 & 2032
- Table 101: Rest of Europe Cell Line Development Industry Revenue (Million) Forecast, by Application 2019 & 2032
- Table 102: Rest of Europe Cell Line Development Industry Volume (K Unit) Forecast, by Application 2019 & 2032
- Table 103: Global Cell Line Development Industry Revenue Million Forecast, by Product 2019 & 2032
- Table 104: Global Cell Line Development Industry Volume K Unit Forecast, by Product 2019 & 2032
- Table 105: Global Cell Line Development Industry Revenue Million Forecast, by Source 2019 & 2032
- Table 106: Global Cell Line Development Industry Volume K Unit Forecast, by Source 2019 & 2032
- Table 107: Global Cell Line Development Industry Revenue Million Forecast, by Application 2019 & 2032
- Table 108: Global Cell Line Development Industry Volume K Unit Forecast, by Application 2019 & 2032
- Table 109: Global Cell Line Development Industry Revenue Million Forecast, by End User 2019 & 2032
- Table 110: Global Cell Line Development Industry Volume K Unit Forecast, by End User 2019 & 2032
- Table 111: Global Cell Line Development Industry Revenue Million Forecast, by Country 2019 & 2032
- Table 112: Global Cell Line Development Industry Volume K Unit Forecast, by Country 2019 & 2032
- Table 113: China Cell Line Development Industry Revenue (Million) Forecast, by Application 2019 & 2032
- Table 114: China Cell Line Development Industry Volume (K Unit) Forecast, by Application 2019 & 2032
- Table 115: Japan Cell Line Development Industry Revenue (Million) Forecast, by Application 2019 & 2032
- Table 116: Japan Cell Line Development Industry Volume (K Unit) Forecast, by Application 2019 & 2032
- Table 117: India Cell Line Development Industry Revenue (Million) Forecast, by Application 2019 & 2032
- Table 118: India Cell Line Development Industry Volume (K Unit) Forecast, by Application 2019 & 2032
- Table 119: Australia Cell Line Development Industry Revenue (Million) Forecast, by Application 2019 & 2032
- Table 120: Australia Cell Line Development Industry Volume (K Unit) Forecast, by Application 2019 & 2032
- Table 121: South Korea Cell Line Development Industry Revenue (Million) Forecast, by Application 2019 & 2032
- Table 122: South Korea Cell Line Development Industry Volume (K Unit) Forecast, by Application 2019 & 2032
- Table 123: Rest of Asia Pacific Cell Line Development Industry Revenue (Million) Forecast, by Application 2019 & 2032
- Table 124: Rest of Asia Pacific Cell Line Development Industry Volume (K Unit) Forecast, by Application 2019 & 2032
- Table 125: Global Cell Line Development Industry Revenue Million Forecast, by Product 2019 & 2032
- Table 126: Global Cell Line Development Industry Volume K Unit Forecast, by Product 2019 & 2032
- Table 127: Global Cell Line Development Industry Revenue Million Forecast, by Source 2019 & 2032
- Table 128: Global Cell Line Development Industry Volume K Unit Forecast, by Source 2019 & 2032
- Table 129: Global Cell Line Development Industry Revenue Million Forecast, by Application 2019 & 2032
- Table 130: Global Cell Line Development Industry Volume K Unit Forecast, by Application 2019 & 2032
- Table 131: Global Cell Line Development Industry Revenue Million Forecast, by End User 2019 & 2032
- Table 132: Global Cell Line Development Industry Volume K Unit Forecast, by End User 2019 & 2032
- Table 133: Global Cell Line Development Industry Revenue Million Forecast, by Country 2019 & 2032
- Table 134: Global Cell Line Development Industry Volume K Unit Forecast, by Country 2019 & 2032
- Table 135: GCC Cell Line Development Industry Revenue (Million) Forecast, by Application 2019 & 2032
- Table 136: GCC Cell Line Development Industry Volume (K Unit) Forecast, by Application 2019 & 2032
- Table 137: South Africa Cell Line Development Industry Revenue (Million) Forecast, by Application 2019 & 2032
- Table 138: South Africa Cell Line Development Industry Volume (K Unit) Forecast, by Application 2019 & 2032
- Table 139: Rest of Middle East and Africa Cell Line Development Industry Revenue (Million) Forecast, by Application 2019 & 2032
- Table 140: Rest of Middle East and Africa Cell Line Development Industry Volume (K Unit) Forecast, by Application 2019 & 2032
- Table 141: Global Cell Line Development Industry Revenue Million Forecast, by Product 2019 & 2032
- Table 142: Global Cell Line Development Industry Volume K Unit Forecast, by Product 2019 & 2032
- Table 143: Global Cell Line Development Industry Revenue Million Forecast, by Source 2019 & 2032
- Table 144: Global Cell Line Development Industry Volume K Unit Forecast, by Source 2019 & 2032
- Table 145: Global Cell Line Development Industry Revenue Million Forecast, by Application 2019 & 2032
- Table 146: Global Cell Line Development Industry Volume K Unit Forecast, by Application 2019 & 2032
- Table 147: Global Cell Line Development Industry Revenue Million Forecast, by End User 2019 & 2032
- Table 148: Global Cell Line Development Industry Volume K Unit Forecast, by End User 2019 & 2032
- Table 149: Global Cell Line Development Industry Revenue Million Forecast, by Country 2019 & 2032
- Table 150: Global Cell Line Development Industry Volume K Unit Forecast, by Country 2019 & 2032
- Table 151: Brazil Cell Line Development Industry Revenue (Million) Forecast, by Application 2019 & 2032
- Table 152: Brazil Cell Line Development Industry Volume (K Unit) Forecast, by Application 2019 & 2032
- Table 153: Argentina Cell Line Development Industry Revenue (Million) Forecast, by Application 2019 & 2032
- Table 154: Argentina Cell Line Development Industry Volume (K Unit) Forecast, by Application 2019 & 2032
- Table 155: Rest of South America Cell Line Development Industry Revenue (Million) Forecast, by Application 2019 & 2032
- Table 156: Rest of South America Cell Line Development Industry Volume (K Unit) Forecast, by Application 2019 & 2032
Frequently Asked Questions
1. What is the projected Compound Annual Growth Rate (CAGR) of the Cell Line Development Industry?
The projected CAGR is approximately 10.60%.
2. Which companies are prominent players in the Cell Line Development Industry?
Key companies in the market include Promega Corporation, Merck KGaA, Sartorius AG, Danaher Corporation, Selexis SA, Fujifilm Corporation (Fujifilm Diosynth Biotechnologies), American Type Culture Collection (ATCC), WuXi Biologics, Thermo Fisher Scientific, Corning Incorporated.
3. What are the main segments of the Cell Line Development Industry?
The market segments include Product, Source, Application, End User.
4. Can you provide details about the market size?
The market size is estimated to be USD XX Million as of 2022.
5. What are some drivers contributing to market growth?
Growing Biopharmaceutical Industry; Rising Demand for Monoclonal Antibodies and Cancer Therapeutics; Growing Production of Biosimilars Due to the Patent Expiry of Branded Therapeutics.
6. What are the notable trends driving market growth?
Mammalian Cell Line Development is Expected to Register Rapid Growth Over the Forecast Period.
7. Are there any restraints impacting market growth?
Strict Regulations; Time Taking Process.
8. Can you provide examples of recent developments in the market?
In July 2022, ProBioGen and Granite Bio Collaborate to Provide GMP Manufacturing and Cell Line Development Services. A novel monoclonal antibody developed by Granite Bio is the company's top contender for the treatment of autoimmune and specific cancer indications. By using the DirectedLuck transposase.
9. What pricing options are available for accessing the report?
Pricing options include single-user, multi-user, and enterprise licenses priced at USD 4750, USD 5250, and USD 8750 respectively.
10. Is the market size provided in terms of value or volume?
The market size is provided in terms of value, measured in Million and volume, measured in K Unit.
11. Are there any specific market keywords associated with the report?
Yes, the market keyword associated with the report is "Cell Line Development Industry," which aids in identifying and referencing the specific market segment covered.
12. How do I determine which pricing option suits my needs best?
The pricing options vary based on user requirements and access needs. Individual users may opt for single-user licenses, while businesses requiring broader access may choose multi-user or enterprise licenses for cost-effective access to the report.
13. Are there any additional resources or data provided in the Cell Line Development Industry report?
While the report offers comprehensive insights, it's advisable to review the specific contents or supplementary materials provided to ascertain if additional resources or data are available.
14. How can I stay updated on further developments or reports in the Cell Line Development Industry?
To stay informed about further developments, trends, and reports in the Cell Line Development Industry, consider subscribing to industry newsletters, following relevant companies and organizations, or regularly checking reputable industry news sources and publications.
Methodology
Step 1 - Identification of Relevant Samples Size from Population Database


Step 2 - Approaches for Defining Global Market Size (Value, Volume* & Price*)

Note*: In applicable scenarios
Step 3 - Data Sources
Primary Research
- Web Analytics
- Survey Reports
- Research Institute
- Latest Research Reports
- Opinion Leaders
Secondary Research
- Annual Reports
- White Paper
- Latest Press Release
- Industry Association
- Paid Database
- Investor Presentations

Step 4 - Data Triangulation
Involves using different sources of information in order to increase the validity of a study
These sources are likely to be stakeholders in a program - participants, other researchers, program staff, other community members, and so on.
Then we put all data in single framework & apply various statistical tools to find out the dynamic on the market.
During the analysis stage, feedback from the stakeholder groups would be compared to determine areas of agreement as well as areas of divergence


