
Key Insights
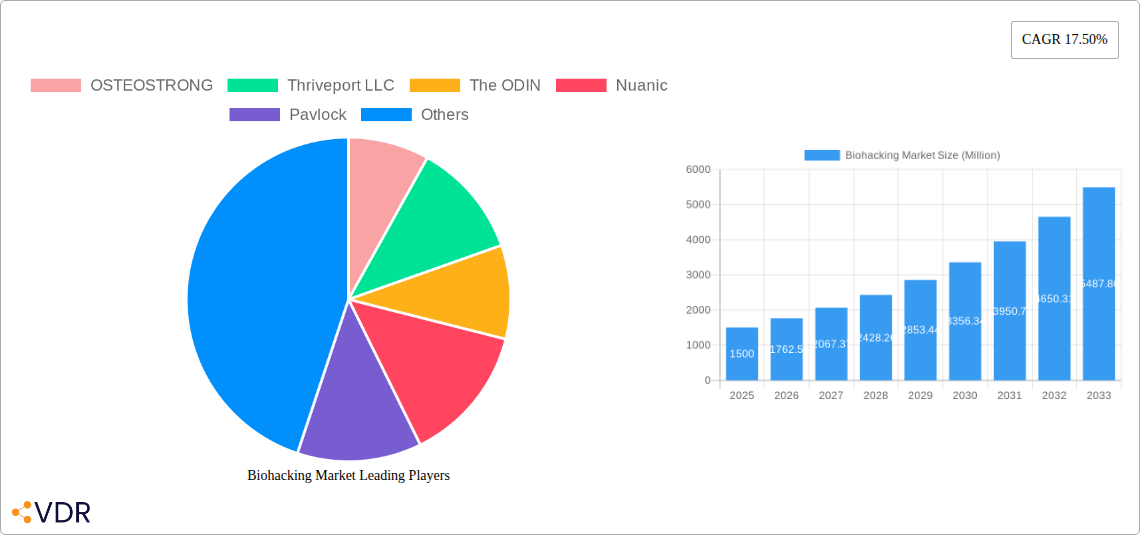
The global biohacking market is experiencing robust growth, projected to reach a substantial size driven by several key factors. The market's 17.50% Compound Annual Growth Rate (CAGR) from 2019 to 2024 indicates significant investor interest and consumer adoption. This expansion is fueled by increasing awareness of personalized healthcare and wellness, coupled with advancements in genetic engineering, wearable technology, and cognitive enhancement techniques. The rising prevalence of chronic diseases and the desire for preventative health measures further contribute to market expansion. Significant market segments include genetic engineering tools, DIY biology kits, implantable devices and wearables, and nootropics, each catering to specific consumer needs and preferences. The applications span medical diagnostics, personalized treatment plans, cognitive enhancement, and genetic therapies, demonstrating the versatility and wide-ranging impact of biohacking. Major players such as Fitbit, Apple, and various biotech firms are actively shaping this evolving landscape, investing heavily in R&D and product innovation. Geographic distribution shows strong performance across North America and Europe, driven by high healthcare expenditure and technological advancement. The Asia-Pacific region shows considerable potential for future growth due to its large population and rising disposable incomes.
While the market enjoys a favorable trajectory, certain challenges remain. Regulatory hurdles concerning the safety and ethical implications of biohacking technologies pose a potential constraint. The relatively high cost of some biohacking products and services could limit accessibility, especially in developing economies. Furthermore, public perception and understanding of biohacking need to evolve to embrace its potential benefits responsibly. Addressing these limitations through robust regulatory frameworks, public education, and affordability initiatives will be crucial to ensuring sustainable and ethical market growth. The continued innovation in areas like CRISPR-Cas9 gene editing and AI-driven personalized medicine will likely further accelerate market expansion in the years to come. Focusing on developing user-friendly, safe, and cost-effective biohacking solutions will be key to unlocking the market's full potential and making biohacking accessible to a wider audience.
Biohacking Market: A Comprehensive Report (2019-2033)
This comprehensive report provides an in-depth analysis of the Biohacking Market, encompassing market dynamics, growth trends, regional segmentation, product landscape, key players, and future outlook. The study period covers 2019-2033, with 2025 as the base and estimated year. The forecast period is 2025-2033, and the historical period is 2019-2024. This report is crucial for industry professionals, investors, and researchers seeking to understand and capitalize on the burgeoning biohacking market. The total market size in 2025 is estimated at xx Million.
Biohacking Market Dynamics & Structure
The Biohacking Market is characterized by a moderately fragmented landscape, with several key players competing alongside numerous niche players. Technological innovation, particularly in genetic engineering, wearable technology, and artificial intelligence, is a significant growth driver. Regulatory frameworks, varying significantly across geographies, present both opportunities and challenges. The market faces competition from established healthcare solutions, but the increasing demand for personalized healthcare fuels its growth. M&A activity in the sector has been steadily increasing, with xx deals recorded in the past 5 years.
- Market Concentration: Moderately fragmented, with a top 5 market share of xx%.
- Technological Innovation: Rapid advancements in gene editing, AI, and wearable technology are key drivers.
- Regulatory Framework: Varied and evolving regulations impact market access and product development.
- Competitive Substitutes: Traditional healthcare solutions, pharmaceuticals, and dietary supplements.
- End-User Demographics: Increasingly diverse, encompassing individuals seeking self-improvement, researchers, and healthcare professionals.
- M&A Trends: A rising number of mergers and acquisitions indicate increasing industry consolidation.
Biohacking Market Growth Trends & Insights
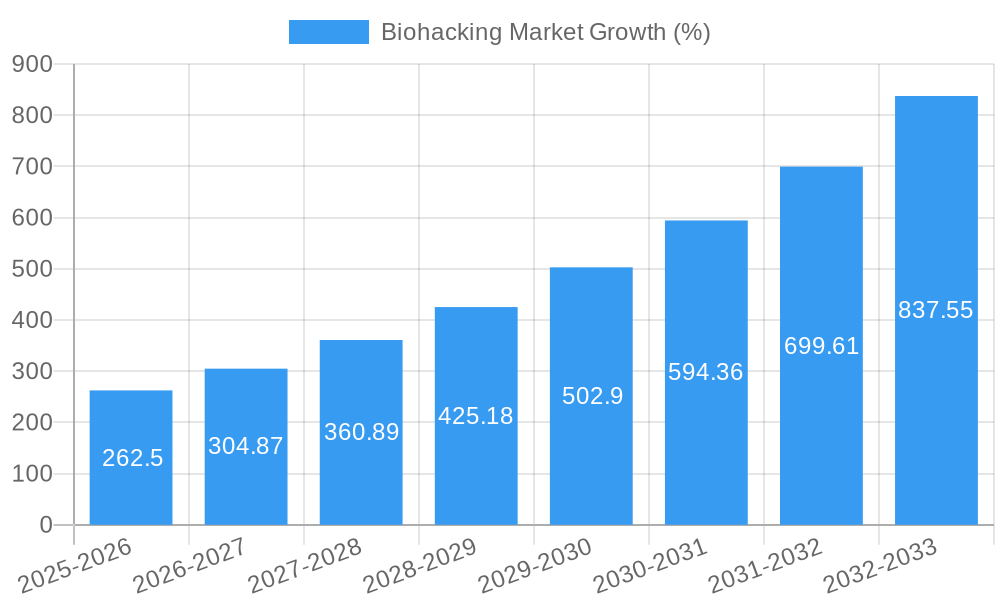
The Biohacking Market is experiencing robust growth, driven by rising consumer awareness of personalized healthcare and wellness. The market exhibited a CAGR of xx% during the historical period (2019-2024) and is projected to maintain a CAGR of xx% during the forecast period (2025-2033), reaching an estimated xx Million by 2033. This growth is fueled by increasing adoption of biohacking technologies across various applications, technological advancements, and a shift towards preventative and personalized healthcare. Consumer behavior is shifting towards proactive health management, driving demand for biohacking products and services. Disruptions like CRISPR technology are fundamentally altering the possibilities within this market. Market penetration is increasing across various demographic groups, particularly among tech-savvy individuals and those seeking improved physical and cognitive performance.
Dominant Regions, Countries, or Segments in Biohacking Market
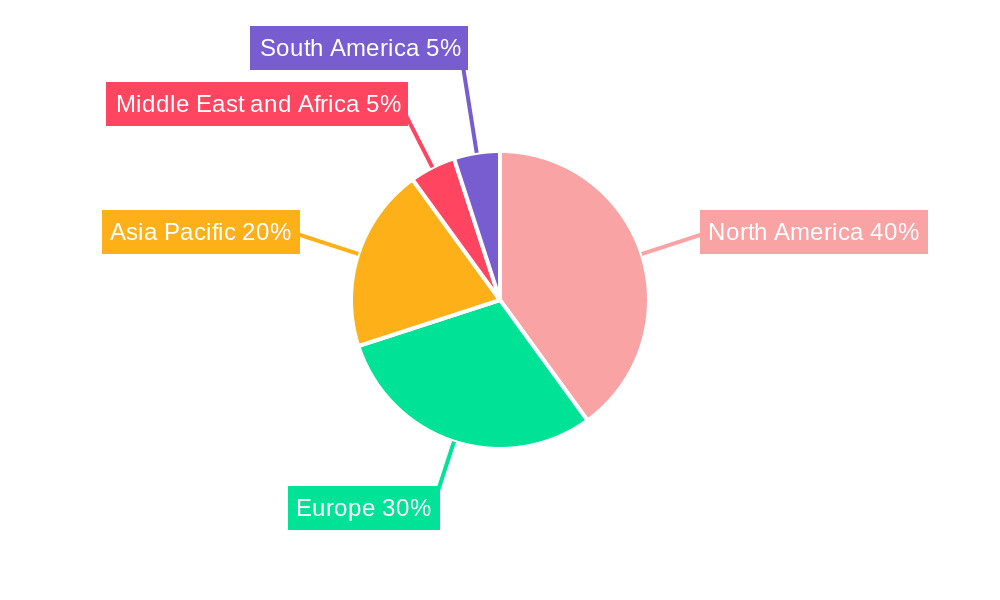
The North American region currently dominates the biohacking market, driven by high technological advancements, strong regulatory support in specific areas, and a high level of consumer adoption. Within North America, the United States leads, followed by Canada. Europe is also a significant market, with Germany and the UK showing strong growth. The Asia-Pacific region exhibits high growth potential, fueled by rising disposable incomes and increasing health consciousness.
- Leading Segment (Product): Implantable Devices and Wearables, holding a market share of xx% in 2025.
- Leading Segment (Application): Medical Diagnostics and Monitoring, expected to reach xx Million by 2033.
- Leading End-User: Pharmaceutical and Biotechnology Companies, contributing xx% to the market value in 2025.
- Key Drivers (North America): Strong regulatory frameworks (in specific areas), high technological advancements, and high consumer adoption rates.
- Key Drivers (Europe): Increasing awareness of personalized healthcare, expanding research initiatives, and supportive government policies.
- Key Drivers (Asia-Pacific): Rising disposable incomes, increasing health consciousness, and favorable government initiatives.
Biohacking Market Product Landscape
The biohacking market offers a diverse range of products, including genetic engineering and gene editing tools, DIY biology kits and accessories, implantable devices and wearables (like continuous glucose monitors and BCIs), cognitive enhancement supplements (nootropics), and various other tools and services. These products cater to various needs, from personalized healthcare and diagnostics to cognitive enhancement and self-improvement. Technological advancements continuously refine product capabilities, enhancing performance, accuracy, and user-friendliness. Unique selling propositions include non-invasive procedures, personalized approaches, and seamless integration with existing healthcare routines.
Key Drivers, Barriers & Challenges in Biohacking Market
Key Drivers: The increasing prevalence of chronic diseases, the rising demand for personalized medicine, technological advancements (AI, gene editing, nanotechnology), and increased consumer awareness are propelling market growth. Government initiatives supporting personalized medicine research also play a significant role.
Key Challenges & Restraints: High costs associated with certain technologies, stringent regulatory hurdles, ethical concerns surrounding gene editing, data privacy issues, and the potential for misuse are significant barriers. Supply chain complexities, particularly in the procurement of specialized components, can also impact growth. The overall market is impacted by a projected xx% due to these factors.
Emerging Opportunities in Biohacking Market
Emerging opportunities include the expansion into untapped markets in developing countries, the development of novel applications in areas like sports performance enhancement and longevity, and the integration of biohacking technologies with other fields such as telemedicine. The growing consumer interest in preventative healthcare also presents a significant opportunity. Moreover, the development of user-friendly interfaces and readily accessible biohacking tools will broaden the market reach.
Growth Accelerators in the Biohacking Market Industry
Long-term growth will be accelerated by continued technological breakthroughs, particularly in areas like CRISPR technology and artificial intelligence. Strategic partnerships between technology companies, research institutions, and healthcare providers will also play a crucial role. Expansion into new geographic markets and the development of more affordable and accessible biohacking tools will further fuel market growth.
Key Players Shaping the Biohacking Market Market
- OSTEOSTRONG
- Thriveport LLC
- The ODIN
- Nuanic
- Pavlock
- Synthego
- TrackMyStack
- InteraXon Inc
- Fitbit Inc
- Biohacker Center Store
- Apple Inc
- Health Via Modern Nutrition Inc
Notable Milestones in Biohacking Market Sector
- July 2022: Synchron implanted a human brain-computer interface (BCI) implant in the United States, marking a significant advancement in neurotechnology and potentially expanding the market for implantable devices.
- February 2022: The FDA approved the Eversense E3 Continuous Glucose Monitoring (CGM) System, expanding the market for implantable biosensors and improving diabetes management.
In-Depth Biohacking Market Market Outlook
The Biohacking Market is poised for continued strong growth, driven by ongoing technological advancements, increasing consumer demand for personalized healthcare, and the expansion into new applications. Strategic partnerships and investments in research and development will be key to unlocking the market's full potential. The focus on user-friendly products and services will increase adoption rates, further fueling market expansion and creating exciting opportunities for both established and emerging players.
Biohacking Market Segmentation
-
1. Products
- 1.1. Genetic Engineering and Gene Editing Tools
- 1.2. DIY Biology Kits and Biohacking Accessories
- 1.3. Implantable Devices and Wearables
- 1.4. Cognitive Enhancement and Nootropics
- 1.5. Others
-
2. Applications
- 2.1. Medical Diagnostics and Monitoring
- 2.2. Biohacking for Personalized Treatment Plans
- 2.3. Cognitive Enhancement for Mental Performance
- 2.4. Genetic Editing for Personalized Gene Therapies
- 2.5. Others
-
3. End Users
- 3.1. Pharmaceutical and Biotechnology Companies
- 3.2. Research Institutes and Academic Centers
- 3.3. Hospitals and Healthcare Facilities
- 3.4. Others
Biohacking Market Segmentation By Geography
-
1. North America
- 1.1. United States
- 1.2. Canada
- 1.3. Mexico
-
2. Europe
- 2.1. Germany
- 2.2. United Kingdom
- 2.3. France
- 2.4. Italy
- 2.5. Spain
- 2.6. Rest of Europe
-
3. Asia Pacific
- 3.1. China
- 3.2. Japan
- 3.3. India
- 3.4. Australia
- 3.5. South Korea
- 3.6. Rest of Asia Pacific
-
4. Middle East and Africa
- 4.1. GCC
- 4.2. South Africa
- 4.3. Rest of Middle East and Africa
-
5. South America
- 5.1. Brazil
- 5.2. Argentina
- 5.3. Rest of South America
Biohacking Market REPORT HIGHLIGHTS
| Aspects | Details |
|---|---|
| Study Period | 2019-2033 |
| Base Year | 2024 |
| Estimated Year | 2025 |
| Forecast Period | 2025-2033 |
| Historical Period | 2019-2024 |
| Growth Rate | CAGR of 17.50% from 2019-2033 |
| Segmentation |
|
Table of Contents
- 1. Introduction
- 1.1. Research Scope
- 1.2. Market Segmentation
- 1.3. Research Methodology
- 1.4. Definitions and Assumptions
- 2. Executive Summary
- 2.1. Introduction
- 3. Market Dynamics
- 3.1. Introduction
- 3.2. Market Drivers
- 3.2.1. Advancements in Healthcare Technology; Increasing Focus on Preventive Healthcare; Rising Demand for Personalized Medicine
- 3.3. Market Restrains
- 3.3.1. Ethical and Regulatory Concerns; Data Privacy and Security Risks
- 3.4. Market Trends
- 3.4.1. Implantable Devices and Wearables Segment is Expected to Hold a Significant Market Share Over the Forecast Period
- 4. Market Factor Analysis
- 4.1. Porters Five Forces
- 4.2. Supply/Value Chain
- 4.3. PESTEL analysis
- 4.4. Market Entropy
- 4.5. Patent/Trademark Analysis
- 5. Global Biohacking Market Analysis, Insights and Forecast, 2019-2031
- 5.1. Market Analysis, Insights and Forecast - by Products
- 5.1.1. Genetic Engineering and Gene Editing Tools
- 5.1.2. DIY Biology Kits and Biohacking Accessories
- 5.1.3. Implantable Devices and Wearables
- 5.1.4. Cognitive Enhancement and Nootropics
- 5.1.5. Others
- 5.2. Market Analysis, Insights and Forecast - by Applications
- 5.2.1. Medical Diagnostics and Monitoring
- 5.2.2. Biohacking for Personalized Treatment Plans
- 5.2.3. Cognitive Enhancement for Mental Performance
- 5.2.4. Genetic Editing for Personalized Gene Therapies
- 5.2.5. Others
- 5.3. Market Analysis, Insights and Forecast - by End Users
- 5.3.1. Pharmaceutical and Biotechnology Companies
- 5.3.2. Research Institutes and Academic Centers
- 5.3.3. Hospitals and Healthcare Facilities
- 5.3.4. Others
- 5.4. Market Analysis, Insights and Forecast - by Region
- 5.4.1. North America
- 5.4.2. Europe
- 5.4.3. Asia Pacific
- 5.4.4. Middle East and Africa
- 5.4.5. South America
- 5.1. Market Analysis, Insights and Forecast - by Products
- 6. North America Biohacking Market Analysis, Insights and Forecast, 2019-2031
- 6.1. Market Analysis, Insights and Forecast - by Products
- 6.1.1. Genetic Engineering and Gene Editing Tools
- 6.1.2. DIY Biology Kits and Biohacking Accessories
- 6.1.3. Implantable Devices and Wearables
- 6.1.4. Cognitive Enhancement and Nootropics
- 6.1.5. Others
- 6.2. Market Analysis, Insights and Forecast - by Applications
- 6.2.1. Medical Diagnostics and Monitoring
- 6.2.2. Biohacking for Personalized Treatment Plans
- 6.2.3. Cognitive Enhancement for Mental Performance
- 6.2.4. Genetic Editing for Personalized Gene Therapies
- 6.2.5. Others
- 6.3. Market Analysis, Insights and Forecast - by End Users
- 6.3.1. Pharmaceutical and Biotechnology Companies
- 6.3.2. Research Institutes and Academic Centers
- 6.3.3. Hospitals and Healthcare Facilities
- 6.3.4. Others
- 6.1. Market Analysis, Insights and Forecast - by Products
- 7. Europe Biohacking Market Analysis, Insights and Forecast, 2019-2031
- 7.1. Market Analysis, Insights and Forecast - by Products
- 7.1.1. Genetic Engineering and Gene Editing Tools
- 7.1.2. DIY Biology Kits and Biohacking Accessories
- 7.1.3. Implantable Devices and Wearables
- 7.1.4. Cognitive Enhancement and Nootropics
- 7.1.5. Others
- 7.2. Market Analysis, Insights and Forecast - by Applications
- 7.2.1. Medical Diagnostics and Monitoring
- 7.2.2. Biohacking for Personalized Treatment Plans
- 7.2.3. Cognitive Enhancement for Mental Performance
- 7.2.4. Genetic Editing for Personalized Gene Therapies
- 7.2.5. Others
- 7.3. Market Analysis, Insights and Forecast - by End Users
- 7.3.1. Pharmaceutical and Biotechnology Companies
- 7.3.2. Research Institutes and Academic Centers
- 7.3.3. Hospitals and Healthcare Facilities
- 7.3.4. Others
- 7.1. Market Analysis, Insights and Forecast - by Products
- 8. Asia Pacific Biohacking Market Analysis, Insights and Forecast, 2019-2031
- 8.1. Market Analysis, Insights and Forecast - by Products
- 8.1.1. Genetic Engineering and Gene Editing Tools
- 8.1.2. DIY Biology Kits and Biohacking Accessories
- 8.1.3. Implantable Devices and Wearables
- 8.1.4. Cognitive Enhancement and Nootropics
- 8.1.5. Others
- 8.2. Market Analysis, Insights and Forecast - by Applications
- 8.2.1. Medical Diagnostics and Monitoring
- 8.2.2. Biohacking for Personalized Treatment Plans
- 8.2.3. Cognitive Enhancement for Mental Performance
- 8.2.4. Genetic Editing for Personalized Gene Therapies
- 8.2.5. Others
- 8.3. Market Analysis, Insights and Forecast - by End Users
- 8.3.1. Pharmaceutical and Biotechnology Companies
- 8.3.2. Research Institutes and Academic Centers
- 8.3.3. Hospitals and Healthcare Facilities
- 8.3.4. Others
- 8.1. Market Analysis, Insights and Forecast - by Products
- 9. Middle East and Africa Biohacking Market Analysis, Insights and Forecast, 2019-2031
- 9.1. Market Analysis, Insights and Forecast - by Products
- 9.1.1. Genetic Engineering and Gene Editing Tools
- 9.1.2. DIY Biology Kits and Biohacking Accessories
- 9.1.3. Implantable Devices and Wearables
- 9.1.4. Cognitive Enhancement and Nootropics
- 9.1.5. Others
- 9.2. Market Analysis, Insights and Forecast - by Applications
- 9.2.1. Medical Diagnostics and Monitoring
- 9.2.2. Biohacking for Personalized Treatment Plans
- 9.2.3. Cognitive Enhancement for Mental Performance
- 9.2.4. Genetic Editing for Personalized Gene Therapies
- 9.2.5. Others
- 9.3. Market Analysis, Insights and Forecast - by End Users
- 9.3.1. Pharmaceutical and Biotechnology Companies
- 9.3.2. Research Institutes and Academic Centers
- 9.3.3. Hospitals and Healthcare Facilities
- 9.3.4. Others
- 9.1. Market Analysis, Insights and Forecast - by Products
- 10. South America Biohacking Market Analysis, Insights and Forecast, 2019-2031
- 10.1. Market Analysis, Insights and Forecast - by Products
- 10.1.1. Genetic Engineering and Gene Editing Tools
- 10.1.2. DIY Biology Kits and Biohacking Accessories
- 10.1.3. Implantable Devices and Wearables
- 10.1.4. Cognitive Enhancement and Nootropics
- 10.1.5. Others
- 10.2. Market Analysis, Insights and Forecast - by Applications
- 10.2.1. Medical Diagnostics and Monitoring
- 10.2.2. Biohacking for Personalized Treatment Plans
- 10.2.3. Cognitive Enhancement for Mental Performance
- 10.2.4. Genetic Editing for Personalized Gene Therapies
- 10.2.5. Others
- 10.3. Market Analysis, Insights and Forecast - by End Users
- 10.3.1. Pharmaceutical and Biotechnology Companies
- 10.3.2. Research Institutes and Academic Centers
- 10.3.3. Hospitals and Healthcare Facilities
- 10.3.4. Others
- 10.1. Market Analysis, Insights and Forecast - by Products
- 11. North America Biohacking Market Analysis, Insights and Forecast, 2019-2031
- 11.1. Market Analysis, Insights and Forecast - By Country/Sub-region
- 11.1.1 United States
- 11.1.2 Canada
- 11.1.3 Mexico
- 12. Europe Biohacking Market Analysis, Insights and Forecast, 2019-2031
- 12.1. Market Analysis, Insights and Forecast - By Country/Sub-region
- 12.1.1 Germany
- 12.1.2 United Kingdom
- 12.1.3 France
- 12.1.4 Italy
- 12.1.5 Spain
- 12.1.6 Rest of Europe
- 13. Asia Pacific Biohacking Market Analysis, Insights and Forecast, 2019-2031
- 13.1. Market Analysis, Insights and Forecast - By Country/Sub-region
- 13.1.1 China
- 13.1.2 Japan
- 13.1.3 India
- 13.1.4 Australia
- 13.1.5 South Korea
- 13.1.6 Rest of Asia Pacific
- 14. Middle East and Africa Biohacking Market Analysis, Insights and Forecast, 2019-2031
- 14.1. Market Analysis, Insights and Forecast - By Country/Sub-region
- 14.1.1 GCC
- 14.1.2 South Africa
- 14.1.3 Rest of Middle East and Africa
- 15. South America Biohacking Market Analysis, Insights and Forecast, 2019-2031
- 15.1. Market Analysis, Insights and Forecast - By Country/Sub-region
- 15.1.1 Brazil
- 15.1.2 Argentina
- 15.1.3 Rest of South America
- 16. Competitive Analysis
- 16.1. Global Market Share Analysis 2024
- 16.2. Company Profiles
- 16.2.1 OSTEOSTRONG
- 16.2.1.1. Overview
- 16.2.1.2. Products
- 16.2.1.3. SWOT Analysis
- 16.2.1.4. Recent Developments
- 16.2.1.5. Financials (Based on Availability)
- 16.2.2 Thriveport LLC
- 16.2.2.1. Overview
- 16.2.2.2. Products
- 16.2.2.3. SWOT Analysis
- 16.2.2.4. Recent Developments
- 16.2.2.5. Financials (Based on Availability)
- 16.2.3 The ODIN
- 16.2.3.1. Overview
- 16.2.3.2. Products
- 16.2.3.3. SWOT Analysis
- 16.2.3.4. Recent Developments
- 16.2.3.5. Financials (Based on Availability)
- 16.2.4 Nuanic
- 16.2.4.1. Overview
- 16.2.4.2. Products
- 16.2.4.3. SWOT Analysis
- 16.2.4.4. Recent Developments
- 16.2.4.5. Financials (Based on Availability)
- 16.2.5 Pavlock
- 16.2.5.1. Overview
- 16.2.5.2. Products
- 16.2.5.3. SWOT Analysis
- 16.2.5.4. Recent Developments
- 16.2.5.5. Financials (Based on Availability)
- 16.2.6 Synthego
- 16.2.6.1. Overview
- 16.2.6.2. Products
- 16.2.6.3. SWOT Analysis
- 16.2.6.4. Recent Developments
- 16.2.6.5. Financials (Based on Availability)
- 16.2.7 TrackMyStack
- 16.2.7.1. Overview
- 16.2.7.2. Products
- 16.2.7.3. SWOT Analysis
- 16.2.7.4. Recent Developments
- 16.2.7.5. Financials (Based on Availability)
- 16.2.8 InteraXon Inc
- 16.2.8.1. Overview
- 16.2.8.2. Products
- 16.2.8.3. SWOT Analysis
- 16.2.8.4. Recent Developments
- 16.2.8.5. Financials (Based on Availability)
- 16.2.9 Fitbit Inc
- 16.2.9.1. Overview
- 16.2.9.2. Products
- 16.2.9.3. SWOT Analysis
- 16.2.9.4. Recent Developments
- 16.2.9.5. Financials (Based on Availability)
- 16.2.10 Biohacker Center Store
- 16.2.10.1. Overview
- 16.2.10.2. Products
- 16.2.10.3. SWOT Analysis
- 16.2.10.4. Recent Developments
- 16.2.10.5. Financials (Based on Availability)
- 16.2.11 Apple Inc
- 16.2.11.1. Overview
- 16.2.11.2. Products
- 16.2.11.3. SWOT Analysis
- 16.2.11.4. Recent Developments
- 16.2.11.5. Financials (Based on Availability)
- 16.2.12 Health Via Modern Nutrition Inc
- 16.2.12.1. Overview
- 16.2.12.2. Products
- 16.2.12.3. SWOT Analysis
- 16.2.12.4. Recent Developments
- 16.2.12.5. Financials (Based on Availability)
- 16.2.1 OSTEOSTRONG
List of Figures
- Figure 1: Global Biohacking Market Revenue Breakdown (Million, %) by Region 2024 & 2032
- Figure 2: Global Biohacking Market Volume Breakdown (K Unit, %) by Region 2024 & 2032
- Figure 3: North America Biohacking Market Revenue (Million), by Country 2024 & 2032
- Figure 4: North America Biohacking Market Volume (K Unit), by Country 2024 & 2032
- Figure 5: North America Biohacking Market Revenue Share (%), by Country 2024 & 2032
- Figure 6: North America Biohacking Market Volume Share (%), by Country 2024 & 2032
- Figure 7: Europe Biohacking Market Revenue (Million), by Country 2024 & 2032
- Figure 8: Europe Biohacking Market Volume (K Unit), by Country 2024 & 2032
- Figure 9: Europe Biohacking Market Revenue Share (%), by Country 2024 & 2032
- Figure 10: Europe Biohacking Market Volume Share (%), by Country 2024 & 2032
- Figure 11: Asia Pacific Biohacking Market Revenue (Million), by Country 2024 & 2032
- Figure 12: Asia Pacific Biohacking Market Volume (K Unit), by Country 2024 & 2032
- Figure 13: Asia Pacific Biohacking Market Revenue Share (%), by Country 2024 & 2032
- Figure 14: Asia Pacific Biohacking Market Volume Share (%), by Country 2024 & 2032
- Figure 15: Middle East and Africa Biohacking Market Revenue (Million), by Country 2024 & 2032
- Figure 16: Middle East and Africa Biohacking Market Volume (K Unit), by Country 2024 & 2032
- Figure 17: Middle East and Africa Biohacking Market Revenue Share (%), by Country 2024 & 2032
- Figure 18: Middle East and Africa Biohacking Market Volume Share (%), by Country 2024 & 2032
- Figure 19: South America Biohacking Market Revenue (Million), by Country 2024 & 2032
- Figure 20: South America Biohacking Market Volume (K Unit), by Country 2024 & 2032
- Figure 21: South America Biohacking Market Revenue Share (%), by Country 2024 & 2032
- Figure 22: South America Biohacking Market Volume Share (%), by Country 2024 & 2032
- Figure 23: North America Biohacking Market Revenue (Million), by Products 2024 & 2032
- Figure 24: North America Biohacking Market Volume (K Unit), by Products 2024 & 2032
- Figure 25: North America Biohacking Market Revenue Share (%), by Products 2024 & 2032
- Figure 26: North America Biohacking Market Volume Share (%), by Products 2024 & 2032
- Figure 27: North America Biohacking Market Revenue (Million), by Applications 2024 & 2032
- Figure 28: North America Biohacking Market Volume (K Unit), by Applications 2024 & 2032
- Figure 29: North America Biohacking Market Revenue Share (%), by Applications 2024 & 2032
- Figure 30: North America Biohacking Market Volume Share (%), by Applications 2024 & 2032
- Figure 31: North America Biohacking Market Revenue (Million), by End Users 2024 & 2032
- Figure 32: North America Biohacking Market Volume (K Unit), by End Users 2024 & 2032
- Figure 33: North America Biohacking Market Revenue Share (%), by End Users 2024 & 2032
- Figure 34: North America Biohacking Market Volume Share (%), by End Users 2024 & 2032
- Figure 35: North America Biohacking Market Revenue (Million), by Country 2024 & 2032
- Figure 36: North America Biohacking Market Volume (K Unit), by Country 2024 & 2032
- Figure 37: North America Biohacking Market Revenue Share (%), by Country 2024 & 2032
- Figure 38: North America Biohacking Market Volume Share (%), by Country 2024 & 2032
- Figure 39: Europe Biohacking Market Revenue (Million), by Products 2024 & 2032
- Figure 40: Europe Biohacking Market Volume (K Unit), by Products 2024 & 2032
- Figure 41: Europe Biohacking Market Revenue Share (%), by Products 2024 & 2032
- Figure 42: Europe Biohacking Market Volume Share (%), by Products 2024 & 2032
- Figure 43: Europe Biohacking Market Revenue (Million), by Applications 2024 & 2032
- Figure 44: Europe Biohacking Market Volume (K Unit), by Applications 2024 & 2032
- Figure 45: Europe Biohacking Market Revenue Share (%), by Applications 2024 & 2032
- Figure 46: Europe Biohacking Market Volume Share (%), by Applications 2024 & 2032
- Figure 47: Europe Biohacking Market Revenue (Million), by End Users 2024 & 2032
- Figure 48: Europe Biohacking Market Volume (K Unit), by End Users 2024 & 2032
- Figure 49: Europe Biohacking Market Revenue Share (%), by End Users 2024 & 2032
- Figure 50: Europe Biohacking Market Volume Share (%), by End Users 2024 & 2032
- Figure 51: Europe Biohacking Market Revenue (Million), by Country 2024 & 2032
- Figure 52: Europe Biohacking Market Volume (K Unit), by Country 2024 & 2032
- Figure 53: Europe Biohacking Market Revenue Share (%), by Country 2024 & 2032
- Figure 54: Europe Biohacking Market Volume Share (%), by Country 2024 & 2032
- Figure 55: Asia Pacific Biohacking Market Revenue (Million), by Products 2024 & 2032
- Figure 56: Asia Pacific Biohacking Market Volume (K Unit), by Products 2024 & 2032
- Figure 57: Asia Pacific Biohacking Market Revenue Share (%), by Products 2024 & 2032
- Figure 58: Asia Pacific Biohacking Market Volume Share (%), by Products 2024 & 2032
- Figure 59: Asia Pacific Biohacking Market Revenue (Million), by Applications 2024 & 2032
- Figure 60: Asia Pacific Biohacking Market Volume (K Unit), by Applications 2024 & 2032
- Figure 61: Asia Pacific Biohacking Market Revenue Share (%), by Applications 2024 & 2032
- Figure 62: Asia Pacific Biohacking Market Volume Share (%), by Applications 2024 & 2032
- Figure 63: Asia Pacific Biohacking Market Revenue (Million), by End Users 2024 & 2032
- Figure 64: Asia Pacific Biohacking Market Volume (K Unit), by End Users 2024 & 2032
- Figure 65: Asia Pacific Biohacking Market Revenue Share (%), by End Users 2024 & 2032
- Figure 66: Asia Pacific Biohacking Market Volume Share (%), by End Users 2024 & 2032
- Figure 67: Asia Pacific Biohacking Market Revenue (Million), by Country 2024 & 2032
- Figure 68: Asia Pacific Biohacking Market Volume (K Unit), by Country 2024 & 2032
- Figure 69: Asia Pacific Biohacking Market Revenue Share (%), by Country 2024 & 2032
- Figure 70: Asia Pacific Biohacking Market Volume Share (%), by Country 2024 & 2032
- Figure 71: Middle East and Africa Biohacking Market Revenue (Million), by Products 2024 & 2032
- Figure 72: Middle East and Africa Biohacking Market Volume (K Unit), by Products 2024 & 2032
- Figure 73: Middle East and Africa Biohacking Market Revenue Share (%), by Products 2024 & 2032
- Figure 74: Middle East and Africa Biohacking Market Volume Share (%), by Products 2024 & 2032
- Figure 75: Middle East and Africa Biohacking Market Revenue (Million), by Applications 2024 & 2032
- Figure 76: Middle East and Africa Biohacking Market Volume (K Unit), by Applications 2024 & 2032
- Figure 77: Middle East and Africa Biohacking Market Revenue Share (%), by Applications 2024 & 2032
- Figure 78: Middle East and Africa Biohacking Market Volume Share (%), by Applications 2024 & 2032
- Figure 79: Middle East and Africa Biohacking Market Revenue (Million), by End Users 2024 & 2032
- Figure 80: Middle East and Africa Biohacking Market Volume (K Unit), by End Users 2024 & 2032
- Figure 81: Middle East and Africa Biohacking Market Revenue Share (%), by End Users 2024 & 2032
- Figure 82: Middle East and Africa Biohacking Market Volume Share (%), by End Users 2024 & 2032
- Figure 83: Middle East and Africa Biohacking Market Revenue (Million), by Country 2024 & 2032
- Figure 84: Middle East and Africa Biohacking Market Volume (K Unit), by Country 2024 & 2032
- Figure 85: Middle East and Africa Biohacking Market Revenue Share (%), by Country 2024 & 2032
- Figure 86: Middle East and Africa Biohacking Market Volume Share (%), by Country 2024 & 2032
- Figure 87: South America Biohacking Market Revenue (Million), by Products 2024 & 2032
- Figure 88: South America Biohacking Market Volume (K Unit), by Products 2024 & 2032
- Figure 89: South America Biohacking Market Revenue Share (%), by Products 2024 & 2032
- Figure 90: South America Biohacking Market Volume Share (%), by Products 2024 & 2032
- Figure 91: South America Biohacking Market Revenue (Million), by Applications 2024 & 2032
- Figure 92: South America Biohacking Market Volume (K Unit), by Applications 2024 & 2032
- Figure 93: South America Biohacking Market Revenue Share (%), by Applications 2024 & 2032
- Figure 94: South America Biohacking Market Volume Share (%), by Applications 2024 & 2032
- Figure 95: South America Biohacking Market Revenue (Million), by End Users 2024 & 2032
- Figure 96: South America Biohacking Market Volume (K Unit), by End Users 2024 & 2032
- Figure 97: South America Biohacking Market Revenue Share (%), by End Users 2024 & 2032
- Figure 98: South America Biohacking Market Volume Share (%), by End Users 2024 & 2032
- Figure 99: South America Biohacking Market Revenue (Million), by Country 2024 & 2032
- Figure 100: South America Biohacking Market Volume (K Unit), by Country 2024 & 2032
- Figure 101: South America Biohacking Market Revenue Share (%), by Country 2024 & 2032
- Figure 102: South America Biohacking Market Volume Share (%), by Country 2024 & 2032
List of Tables
- Table 1: Global Biohacking Market Revenue Million Forecast, by Region 2019 & 2032
- Table 2: Global Biohacking Market Volume K Unit Forecast, by Region 2019 & 2032
- Table 3: Global Biohacking Market Revenue Million Forecast, by Products 2019 & 2032
- Table 4: Global Biohacking Market Volume K Unit Forecast, by Products 2019 & 2032
- Table 5: Global Biohacking Market Revenue Million Forecast, by Applications 2019 & 2032
- Table 6: Global Biohacking Market Volume K Unit Forecast, by Applications 2019 & 2032
- Table 7: Global Biohacking Market Revenue Million Forecast, by End Users 2019 & 2032
- Table 8: Global Biohacking Market Volume K Unit Forecast, by End Users 2019 & 2032
- Table 9: Global Biohacking Market Revenue Million Forecast, by Region 2019 & 2032
- Table 10: Global Biohacking Market Volume K Unit Forecast, by Region 2019 & 2032
- Table 11: Global Biohacking Market Revenue Million Forecast, by Country 2019 & 2032
- Table 12: Global Biohacking Market Volume K Unit Forecast, by Country 2019 & 2032
- Table 13: United States Biohacking Market Revenue (Million) Forecast, by Application 2019 & 2032
- Table 14: United States Biohacking Market Volume (K Unit) Forecast, by Application 2019 & 2032
- Table 15: Canada Biohacking Market Revenue (Million) Forecast, by Application 2019 & 2032
- Table 16: Canada Biohacking Market Volume (K Unit) Forecast, by Application 2019 & 2032
- Table 17: Mexico Biohacking Market Revenue (Million) Forecast, by Application 2019 & 2032
- Table 18: Mexico Biohacking Market Volume (K Unit) Forecast, by Application 2019 & 2032
- Table 19: Global Biohacking Market Revenue Million Forecast, by Country 2019 & 2032
- Table 20: Global Biohacking Market Volume K Unit Forecast, by Country 2019 & 2032
- Table 21: Germany Biohacking Market Revenue (Million) Forecast, by Application 2019 & 2032
- Table 22: Germany Biohacking Market Volume (K Unit) Forecast, by Application 2019 & 2032
- Table 23: United Kingdom Biohacking Market Revenue (Million) Forecast, by Application 2019 & 2032
- Table 24: United Kingdom Biohacking Market Volume (K Unit) Forecast, by Application 2019 & 2032
- Table 25: France Biohacking Market Revenue (Million) Forecast, by Application 2019 & 2032
- Table 26: France Biohacking Market Volume (K Unit) Forecast, by Application 2019 & 2032
- Table 27: Italy Biohacking Market Revenue (Million) Forecast, by Application 2019 & 2032
- Table 28: Italy Biohacking Market Volume (K Unit) Forecast, by Application 2019 & 2032
- Table 29: Spain Biohacking Market Revenue (Million) Forecast, by Application 2019 & 2032
- Table 30: Spain Biohacking Market Volume (K Unit) Forecast, by Application 2019 & 2032
- Table 31: Rest of Europe Biohacking Market Revenue (Million) Forecast, by Application 2019 & 2032
- Table 32: Rest of Europe Biohacking Market Volume (K Unit) Forecast, by Application 2019 & 2032
- Table 33: Global Biohacking Market Revenue Million Forecast, by Country 2019 & 2032
- Table 34: Global Biohacking Market Volume K Unit Forecast, by Country 2019 & 2032
- Table 35: China Biohacking Market Revenue (Million) Forecast, by Application 2019 & 2032
- Table 36: China Biohacking Market Volume (K Unit) Forecast, by Application 2019 & 2032
- Table 37: Japan Biohacking Market Revenue (Million) Forecast, by Application 2019 & 2032
- Table 38: Japan Biohacking Market Volume (K Unit) Forecast, by Application 2019 & 2032
- Table 39: India Biohacking Market Revenue (Million) Forecast, by Application 2019 & 2032
- Table 40: India Biohacking Market Volume (K Unit) Forecast, by Application 2019 & 2032
- Table 41: Australia Biohacking Market Revenue (Million) Forecast, by Application 2019 & 2032
- Table 42: Australia Biohacking Market Volume (K Unit) Forecast, by Application 2019 & 2032
- Table 43: South Korea Biohacking Market Revenue (Million) Forecast, by Application 2019 & 2032
- Table 44: South Korea Biohacking Market Volume (K Unit) Forecast, by Application 2019 & 2032
- Table 45: Rest of Asia Pacific Biohacking Market Revenue (Million) Forecast, by Application 2019 & 2032
- Table 46: Rest of Asia Pacific Biohacking Market Volume (K Unit) Forecast, by Application 2019 & 2032
- Table 47: Global Biohacking Market Revenue Million Forecast, by Country 2019 & 2032
- Table 48: Global Biohacking Market Volume K Unit Forecast, by Country 2019 & 2032
- Table 49: GCC Biohacking Market Revenue (Million) Forecast, by Application 2019 & 2032
- Table 50: GCC Biohacking Market Volume (K Unit) Forecast, by Application 2019 & 2032
- Table 51: South Africa Biohacking Market Revenue (Million) Forecast, by Application 2019 & 2032
- Table 52: South Africa Biohacking Market Volume (K Unit) Forecast, by Application 2019 & 2032
- Table 53: Rest of Middle East and Africa Biohacking Market Revenue (Million) Forecast, by Application 2019 & 2032
- Table 54: Rest of Middle East and Africa Biohacking Market Volume (K Unit) Forecast, by Application 2019 & 2032
- Table 55: Global Biohacking Market Revenue Million Forecast, by Country 2019 & 2032
- Table 56: Global Biohacking Market Volume K Unit Forecast, by Country 2019 & 2032
- Table 57: Brazil Biohacking Market Revenue (Million) Forecast, by Application 2019 & 2032
- Table 58: Brazil Biohacking Market Volume (K Unit) Forecast, by Application 2019 & 2032
- Table 59: Argentina Biohacking Market Revenue (Million) Forecast, by Application 2019 & 2032
- Table 60: Argentina Biohacking Market Volume (K Unit) Forecast, by Application 2019 & 2032
- Table 61: Rest of South America Biohacking Market Revenue (Million) Forecast, by Application 2019 & 2032
- Table 62: Rest of South America Biohacking Market Volume (K Unit) Forecast, by Application 2019 & 2032
- Table 63: Global Biohacking Market Revenue Million Forecast, by Products 2019 & 2032
- Table 64: Global Biohacking Market Volume K Unit Forecast, by Products 2019 & 2032
- Table 65: Global Biohacking Market Revenue Million Forecast, by Applications 2019 & 2032
- Table 66: Global Biohacking Market Volume K Unit Forecast, by Applications 2019 & 2032
- Table 67: Global Biohacking Market Revenue Million Forecast, by End Users 2019 & 2032
- Table 68: Global Biohacking Market Volume K Unit Forecast, by End Users 2019 & 2032
- Table 69: Global Biohacking Market Revenue Million Forecast, by Country 2019 & 2032
- Table 70: Global Biohacking Market Volume K Unit Forecast, by Country 2019 & 2032
- Table 71: United States Biohacking Market Revenue (Million) Forecast, by Application 2019 & 2032
- Table 72: United States Biohacking Market Volume (K Unit) Forecast, by Application 2019 & 2032
- Table 73: Canada Biohacking Market Revenue (Million) Forecast, by Application 2019 & 2032
- Table 74: Canada Biohacking Market Volume (K Unit) Forecast, by Application 2019 & 2032
- Table 75: Mexico Biohacking Market Revenue (Million) Forecast, by Application 2019 & 2032
- Table 76: Mexico Biohacking Market Volume (K Unit) Forecast, by Application 2019 & 2032
- Table 77: Global Biohacking Market Revenue Million Forecast, by Products 2019 & 2032
- Table 78: Global Biohacking Market Volume K Unit Forecast, by Products 2019 & 2032
- Table 79: Global Biohacking Market Revenue Million Forecast, by Applications 2019 & 2032
- Table 80: Global Biohacking Market Volume K Unit Forecast, by Applications 2019 & 2032
- Table 81: Global Biohacking Market Revenue Million Forecast, by End Users 2019 & 2032
- Table 82: Global Biohacking Market Volume K Unit Forecast, by End Users 2019 & 2032
- Table 83: Global Biohacking Market Revenue Million Forecast, by Country 2019 & 2032
- Table 84: Global Biohacking Market Volume K Unit Forecast, by Country 2019 & 2032
- Table 85: Germany Biohacking Market Revenue (Million) Forecast, by Application 2019 & 2032
- Table 86: Germany Biohacking Market Volume (K Unit) Forecast, by Application 2019 & 2032
- Table 87: United Kingdom Biohacking Market Revenue (Million) Forecast, by Application 2019 & 2032
- Table 88: United Kingdom Biohacking Market Volume (K Unit) Forecast, by Application 2019 & 2032
- Table 89: France Biohacking Market Revenue (Million) Forecast, by Application 2019 & 2032
- Table 90: France Biohacking Market Volume (K Unit) Forecast, by Application 2019 & 2032
- Table 91: Italy Biohacking Market Revenue (Million) Forecast, by Application 2019 & 2032
- Table 92: Italy Biohacking Market Volume (K Unit) Forecast, by Application 2019 & 2032
- Table 93: Spain Biohacking Market Revenue (Million) Forecast, by Application 2019 & 2032
- Table 94: Spain Biohacking Market Volume (K Unit) Forecast, by Application 2019 & 2032
- Table 95: Rest of Europe Biohacking Market Revenue (Million) Forecast, by Application 2019 & 2032
- Table 96: Rest of Europe Biohacking Market Volume (K Unit) Forecast, by Application 2019 & 2032
- Table 97: Global Biohacking Market Revenue Million Forecast, by Products 2019 & 2032
- Table 98: Global Biohacking Market Volume K Unit Forecast, by Products 2019 & 2032
- Table 99: Global Biohacking Market Revenue Million Forecast, by Applications 2019 & 2032
- Table 100: Global Biohacking Market Volume K Unit Forecast, by Applications 2019 & 2032
- Table 101: Global Biohacking Market Revenue Million Forecast, by End Users 2019 & 2032
- Table 102: Global Biohacking Market Volume K Unit Forecast, by End Users 2019 & 2032
- Table 103: Global Biohacking Market Revenue Million Forecast, by Country 2019 & 2032
- Table 104: Global Biohacking Market Volume K Unit Forecast, by Country 2019 & 2032
- Table 105: China Biohacking Market Revenue (Million) Forecast, by Application 2019 & 2032
- Table 106: China Biohacking Market Volume (K Unit) Forecast, by Application 2019 & 2032
- Table 107: Japan Biohacking Market Revenue (Million) Forecast, by Application 2019 & 2032
- Table 108: Japan Biohacking Market Volume (K Unit) Forecast, by Application 2019 & 2032
- Table 109: India Biohacking Market Revenue (Million) Forecast, by Application 2019 & 2032
- Table 110: India Biohacking Market Volume (K Unit) Forecast, by Application 2019 & 2032
- Table 111: Australia Biohacking Market Revenue (Million) Forecast, by Application 2019 & 2032
- Table 112: Australia Biohacking Market Volume (K Unit) Forecast, by Application 2019 & 2032
- Table 113: South Korea Biohacking Market Revenue (Million) Forecast, by Application 2019 & 2032
- Table 114: South Korea Biohacking Market Volume (K Unit) Forecast, by Application 2019 & 2032
- Table 115: Rest of Asia Pacific Biohacking Market Revenue (Million) Forecast, by Application 2019 & 2032
- Table 116: Rest of Asia Pacific Biohacking Market Volume (K Unit) Forecast, by Application 2019 & 2032
- Table 117: Global Biohacking Market Revenue Million Forecast, by Products 2019 & 2032
- Table 118: Global Biohacking Market Volume K Unit Forecast, by Products 2019 & 2032
- Table 119: Global Biohacking Market Revenue Million Forecast, by Applications 2019 & 2032
- Table 120: Global Biohacking Market Volume K Unit Forecast, by Applications 2019 & 2032
- Table 121: Global Biohacking Market Revenue Million Forecast, by End Users 2019 & 2032
- Table 122: Global Biohacking Market Volume K Unit Forecast, by End Users 2019 & 2032
- Table 123: Global Biohacking Market Revenue Million Forecast, by Country 2019 & 2032
- Table 124: Global Biohacking Market Volume K Unit Forecast, by Country 2019 & 2032
- Table 125: GCC Biohacking Market Revenue (Million) Forecast, by Application 2019 & 2032
- Table 126: GCC Biohacking Market Volume (K Unit) Forecast, by Application 2019 & 2032
- Table 127: South Africa Biohacking Market Revenue (Million) Forecast, by Application 2019 & 2032
- Table 128: South Africa Biohacking Market Volume (K Unit) Forecast, by Application 2019 & 2032
- Table 129: Rest of Middle East and Africa Biohacking Market Revenue (Million) Forecast, by Application 2019 & 2032
- Table 130: Rest of Middle East and Africa Biohacking Market Volume (K Unit) Forecast, by Application 2019 & 2032
- Table 131: Global Biohacking Market Revenue Million Forecast, by Products 2019 & 2032
- Table 132: Global Biohacking Market Volume K Unit Forecast, by Products 2019 & 2032
- Table 133: Global Biohacking Market Revenue Million Forecast, by Applications 2019 & 2032
- Table 134: Global Biohacking Market Volume K Unit Forecast, by Applications 2019 & 2032
- Table 135: Global Biohacking Market Revenue Million Forecast, by End Users 2019 & 2032
- Table 136: Global Biohacking Market Volume K Unit Forecast, by End Users 2019 & 2032
- Table 137: Global Biohacking Market Revenue Million Forecast, by Country 2019 & 2032
- Table 138: Global Biohacking Market Volume K Unit Forecast, by Country 2019 & 2032
- Table 139: Brazil Biohacking Market Revenue (Million) Forecast, by Application 2019 & 2032
- Table 140: Brazil Biohacking Market Volume (K Unit) Forecast, by Application 2019 & 2032
- Table 141: Argentina Biohacking Market Revenue (Million) Forecast, by Application 2019 & 2032
- Table 142: Argentina Biohacking Market Volume (K Unit) Forecast, by Application 2019 & 2032
- Table 143: Rest of South America Biohacking Market Revenue (Million) Forecast, by Application 2019 & 2032
- Table 144: Rest of South America Biohacking Market Volume (K Unit) Forecast, by Application 2019 & 2032
Frequently Asked Questions
1. What is the projected Compound Annual Growth Rate (CAGR) of the Biohacking Market?
The projected CAGR is approximately 17.50%.
2. Which companies are prominent players in the Biohacking Market?
Key companies in the market include OSTEOSTRONG, Thriveport LLC, The ODIN, Nuanic, Pavlock, Synthego, TrackMyStack, InteraXon Inc, Fitbit Inc, Biohacker Center Store, Apple Inc, Health Via Modern Nutrition Inc.
3. What are the main segments of the Biohacking Market?
The market segments include Products, Applications, End Users.
4. Can you provide details about the market size?
The market size is estimated to be USD XX Million as of 2022.
5. What are some drivers contributing to market growth?
Advancements in Healthcare Technology; Increasing Focus on Preventive Healthcare; Rising Demand for Personalized Medicine.
6. What are the notable trends driving market growth?
Implantable Devices and Wearables Segment is Expected to Hold a Significant Market Share Over the Forecast Period.
7. Are there any restraints impacting market growth?
Ethical and Regulatory Concerns; Data Privacy and Security Risks.
8. Can you provide examples of recent developments in the market?
July 2022: Synchron implanted a human brain-computer interface (BCI) implant in the United States. Once implanted, it detects and wirelessly transmits motor intent to allow paralyzed patients to control personal devices with hands-free point-and-click.
9. What pricing options are available for accessing the report?
Pricing options include single-user, multi-user, and enterprise licenses priced at USD 4750, USD 5250, and USD 8750 respectively.
10. Is the market size provided in terms of value or volume?
The market size is provided in terms of value, measured in Million and volume, measured in K Unit.
11. Are there any specific market keywords associated with the report?
Yes, the market keyword associated with the report is "Biohacking Market," which aids in identifying and referencing the specific market segment covered.
12. How do I determine which pricing option suits my needs best?
The pricing options vary based on user requirements and access needs. Individual users may opt for single-user licenses, while businesses requiring broader access may choose multi-user or enterprise licenses for cost-effective access to the report.
13. Are there any additional resources or data provided in the Biohacking Market report?
While the report offers comprehensive insights, it's advisable to review the specific contents or supplementary materials provided to ascertain if additional resources or data are available.
14. How can I stay updated on further developments or reports in the Biohacking Market?
To stay informed about further developments, trends, and reports in the Biohacking Market, consider subscribing to industry newsletters, following relevant companies and organizations, or regularly checking reputable industry news sources and publications.
Methodology
Step 1 - Identification of Relevant Samples Size from Population Database


Step 2 - Approaches for Defining Global Market Size (Value, Volume* & Price*)

Note*: In applicable scenarios
Step 3 - Data Sources
Primary Research
- Web Analytics
- Survey Reports
- Research Institute
- Latest Research Reports
- Opinion Leaders
Secondary Research
- Annual Reports
- White Paper
- Latest Press Release
- Industry Association
- Paid Database
- Investor Presentations

Step 4 - Data Triangulation
Involves using different sources of information in order to increase the validity of a study
These sources are likely to be stakeholders in a program - participants, other researchers, program staff, other community members, and so on.
Then we put all data in single framework & apply various statistical tools to find out the dynamic on the market.
During the analysis stage, feedback from the stakeholder groups would be compared to determine areas of agreement as well as areas of divergence


