

Key Insights
The global Third-Party Payment market is experiencing phenomenal growth, projected to reach a substantial market size of USD 55.70 billion by 2025. This surge is driven by an impressive Compound Annual Growth Rate (CAGR) of 35.10% throughout the forecast period (2025-2033). The primary impetus for this expansion stems from the escalating adoption of digital payment solutions across various sectors, fueled by increasing internet penetration, smartphone accessibility, and a growing consumer preference for convenient and secure online transactions. The proliferation of e-commerce, the demand for seamless in-app purchases, and the need for efficient cross-border transactions are significant drivers. Furthermore, advancements in payment technologies, including contactless payments, QR code-based transactions, and mobile wallets, are revolutionizing how businesses and consumers interact, further accelerating market growth. Regulatory support and initiatives aimed at promoting digital payments in emerging economies are also contributing to this robust expansion.
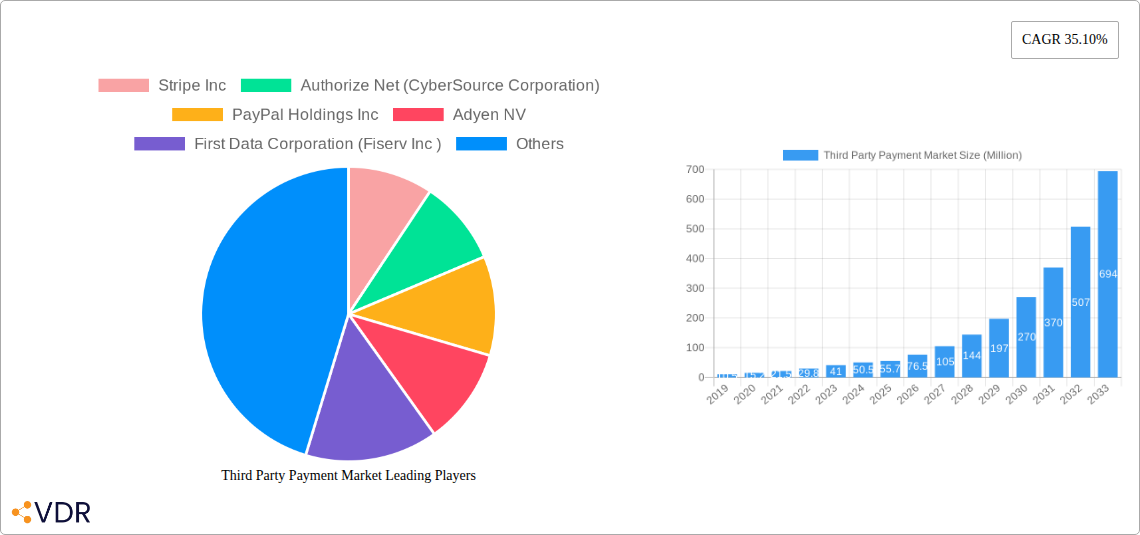
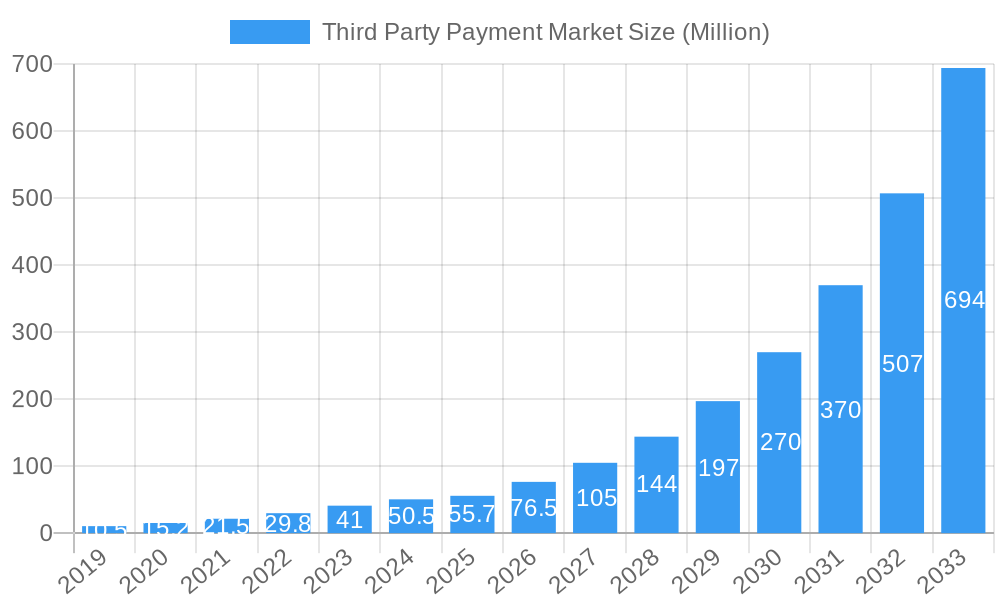
Third Party Payment Market Market Size (In Million)
The market is broadly segmented by payment type, with Online and Mobile payment methods taking the lead due to their widespread accessibility and user-friendliness. The BFSI and Retail sectors are the dominant end-users, leveraging third-party payment solutions to streamline operations, enhance customer experience, and expand their market reach. The E-commerce sector also represents a significant and rapidly growing segment, as businesses increasingly rely on these platforms for processing online sales. Geographically, North America and Europe currently hold substantial market shares, owing to their mature digital payment ecosystems and high consumer adoption rates. However, the Asia-Pacific region is poised for explosive growth, driven by a burgeoning middle class, rapid digitalization, and a large unbanked population transitioning to digital payment methods. The competitive landscape features key players like Stripe Inc., PayPal Holdings Inc., and Adyen NV, all actively innovating and expanding their service offerings to capture this dynamic market.
Third Party Payment Market Company Market Share
Unlock the future of digital transactions with this in-depth report on the global Third Party Payment Market. Spanning from 2019 to 2033, with a base and estimated year of 2025 and a forecast period of 2025-2033, this report provides unparalleled insights into market dynamics, growth drivers, competitive landscapes, and future opportunities. Understand the intricate interplay of online, mobile, and point-of-sale payment types, and their impact across BFSI, Retail, E-Commerce, and other key end-user industries. Essential for industry professionals, investors, and strategists seeking to navigate the rapidly evolving payments ecosystem.
Third Party Payment Market Market Dynamics & Structure
The Third Party Payment Market is characterized by intense competition, driven by rapid technological innovation and evolving consumer behavior. Market concentration is moderate, with key players like Stripe Inc., PayPal Holdings Inc., and Adyen NV holding significant shares, yet the landscape allows for agile new entrants and specialized providers. Technological innovation is a primary driver, with advancements in AI, blockchain, and mobile payment solutions constantly reshaping the market. Regulatory frameworks, while diverse across regions, are increasingly focused on security, data privacy, and consumer protection, influencing operational strategies. Competitive product substitutes are emerging, including open banking initiatives and direct bank transfers, though third-party providers offer a crucial layer of convenience and security. End-user demographics are shifting towards digital-native generations, demanding seamless, mobile-first payment experiences. Merger and acquisition (M&A) trends are active, as larger entities seek to consolidate market share and acquire innovative technologies. For instance, Fiserv Inc.'s acquisition of First Data Corporation significantly reshaped the traditional payments processing sector. The market for online payment gateways is projected to reach an estimated $4,500,000 Million by 2025.
- Market Concentration: Moderate, with prominent players and room for niche providers.
- Technological Innovation Drivers: AI-powered fraud detection, blockchain for secure transactions, and ubiquitous mobile payment integration.
- Regulatory Frameworks: Growing emphasis on data privacy (e.g., GDPR), cybersecurity, and anti-money laundering (AML) regulations.
- Competitive Product Substitutes: Open Banking APIs, Buy Now Pay Later (BNPL) schemes, and direct peer-to-peer (P2P) transfer platforms.
- End-User Demographics: Increasing adoption by millennials and Gen Z, driving demand for digital and mobile payment solutions.
- M&A Trends: Consolidation for market reach and technological acquisition. The total M&A deal volume in the payments sector was estimated at over $25,000 Million in the historical period of 2019-2024.
Third Party Payment Market Growth Trends & Insights
The Third Party Payment Market is experiencing robust growth, propelled by the accelerating shift towards digital commerce and the increasing demand for convenient and secure payment solutions across various industries. The global market size is projected to expand significantly from an estimated $1,800,000 Million in 2019 to an anticipated $5,500,000 Million by 2033, demonstrating a compound annual growth rate (CAGR) of approximately 9.8% over the study period. This expansion is underpinned by the rising adoption rates of online and mobile payment methods, driven by changing consumer behaviors that prioritize speed and ease of transaction. Technological disruptions, such as the widespread integration of contactless payments, QR code technology, and advancements in fraud prevention through machine learning, are further fueling this growth. The E-commerce segment, in particular, is a major beneficiary, with online sales expected to reach new heights, necessitating efficient and reliable payment gateways. BFSI institutions are also increasingly leveraging third-party payment providers to enhance their digital offerings and customer experience. The penetration of third-party payment solutions within the retail sector is rapidly increasing, now estimated at 65% of all retail transactions in developed economies. Consumer behavior shifts are evident, with a clear preference for integrated payment experiences within apps and online platforms. The global market value in the base year of 2025 is projected to be $3,200,000 Million.
- Market Size Evolution: Anticipated to grow from $1,800,000 Million in 2019 to $5,500,000 Million by 2033.
- Adoption Rates: High and accelerating, particularly for online and mobile payment methods.
- Technological Disruptions: Contactless payments, QR codes, biometric authentication, and AI-driven fraud detection are key enablers.
- Consumer Behavior Shifts: Growing preference for seamless, mobile-first, and integrated payment experiences.
- CAGR (2019-2033): Approximately 9.8%.
- Market Penetration: Significant penetration in E-commerce and Retail, with growing adoption in BFSI.
Dominant Regions, Countries, or Segments in Third Party Payment Market
The E-Commerce segment is a pivotal driver of growth within the global Third Party Payment Market, exhibiting dominance due to the exponential rise in online shopping worldwide. This segment is projected to account for approximately 55% of the total market value in the forecast period. Key drivers for its dominance include favorable economic policies that encourage digital trade, robust internet infrastructure enabling widespread online access, and a rapidly expanding consumer base actively participating in e-commerce activities. Countries like the United States, China, and India are leading the charge, with significant contributions from the widespread adoption of online marketplaces and direct-to-consumer (DTC) e-commerce models. The sheer volume of transactions processed through online payment gateways, facilitated by companies like Stripe Inc. and Alipay com Co Ltd, underscores its importance. The demand for secure, fast, and user-friendly online payment solutions remains paramount.
The Online payment type also holds a dominant position, contributing significantly to the overall market growth. This is further bolstered by the strong performance of the E-Commerce and Retail end-user segments. The projected market share for online payments is estimated to be around 60% of the total market value within the forecast period.
Within end-user segments, E-Commerce is the leading sector, expected to capture 45% of the market share in 2025. The BFSI sector is also a significant contributor, with a projected market share of 25% in 2025, as financial institutions increasingly integrate third-party payment solutions for their digital services.
- Dominant Segment (Type): Online payments, projected to hold 60% market share.
- Dominant Segment (End User): E-Commerce, expected to capture 45% market share in 2025.
- Key Dominant Countries: United States, China, India, driven by strong e-commerce ecosystems.
- Growth Drivers for E-Commerce: Increasing internet penetration, mobile-first strategies, and a growing middle class.
- Market Share (BFSI): Projected at 25% in 2025, driven by digital banking and fintech adoption.
- Infrastructure Impact: Reliable internet and mobile networks are crucial for the growth of online and mobile payments.
Third Party Payment Market Product Landscape
The Third Party Payment Market product landscape is characterized by a continuous stream of innovation, focusing on enhancing security, user experience, and transaction efficiency. Key product developments include the integration of advanced security protocols like tokenization and multi-factor authentication to combat fraud, and the expansion of seamless payment experiences through APIs that embed payment capabilities directly into merchant websites and applications. Mobile payment solutions are seeing advancements with the proliferation of digital wallets and QR code-based transactions, exemplified by PayPal Holdings Inc.'s integration with Apple Pay. The focus is on offering a diverse range of payment options, from traditional credit and debit cards to newer methods like cryptocurrency, catering to a global user base. Performance metrics are increasingly scrutinized, with an emphasis on transaction success rates, processing speeds, and low latency. Unique selling propositions often revolve around competitive fee structures, robust fraud management tools, and extensive global reach.
Key Drivers, Barriers & Challenges in Third Party Payment Market
The Third Party Payment Market is propelled by several key drivers. The relentless growth of e-commerce and mobile commerce is a primary catalyst, demanding efficient and secure transaction processing. Technological advancements, including AI for fraud detection and blockchain for enhanced security, are creating new possibilities. Furthermore, increasing digital literacy and consumer preference for convenient payment methods are significant forces.
Conversely, the market faces several barriers and challenges. Stringent and evolving regulatory frameworks across different jurisdictions can increase compliance costs and complexity. Intense competition from established players and emerging fintech startups can lead to pricing pressures and reduced profit margins. Cybersecurity threats and data breaches pose a significant risk, eroding consumer trust and leading to financial losses. Supply chain issues are less direct but can impact the availability of hardware for point-of-sale solutions. The estimated annual cost of cybercrime globally is projected to exceed $10.5 Trillion by 2025, impacting payment processors.
Key Drivers:
- Exponential growth of E-commerce and Mobile Commerce.
- Technological advancements (AI, Blockchain, Biometrics).
- Increasing consumer preference for digital and convenient payment methods.
- Globalization and cross-border transactions.
Barriers & Challenges:
- Complex and evolving regulatory compliance.
- Intense market competition and pricing pressures.
- Persistent cybersecurity threats and data breaches.
- High operational costs for maintaining robust infrastructure.
- Consumer trust and adoption of new payment technologies.
Emerging Opportunities in Third Party Payment Market
Emerging opportunities in the Third Party Payment Market are abundant, fueled by evolving consumer needs and technological breakthroughs. The rapid expansion of the Buy Now Pay Later (BNPL) sector presents a significant growth avenue, offering flexible payment options to consumers. The integration of cryptocurrencies and blockchain technology into mainstream payment systems, while nascent, holds immense potential for secure and efficient cross-border transactions. Furthermore, the growing demand for personalized payment experiences and embedded finance solutions across various industries, from gaming to healthcare, offers untapped markets. The development of specialized payment solutions for niche markets, such as the gig economy and small businesses, also represents a significant opportunity for innovation and market penetration.
Growth Accelerators in the Third Party Payment Market Industry
Several factors are acting as growth accelerators for the Third Party Payment Market. The widespread adoption of smartphones and the increasing prevalence of mobile internet access are creating a fertile ground for mobile payment solutions. Strategic partnerships between payment providers and technology companies, such as the collaboration between Stripe Inc. and Lotus, are expanding market reach and enhancing product offerings. Market expansion into emerging economies, where digital payment adoption is rapidly increasing, is a significant growth driver. Continuous investment in research and development to improve fraud detection, streamline the checkout process, and offer more payment options will further accelerate growth. The increasing focus on developing sustainable and inclusive payment ecosystems also contributes to long-term expansion.
Key Players Shaping the Third Party Payment Market Market
- Stripe Inc.
- Authorize Net (CyberSource Corporation)
- PayPal Holdings Inc.
- Adyen NV
- First Data Corporation (Fiserv Inc.)
- Amazon Payments Inc.
- Alipay com Co Ltd
- 2checkout Com Inc (Avangate BV)
- One 97 Communications Limited
- WePay Inc (JPMorgan Chase & Co)
Notable Milestones in Third Party Payment Market Sector
- October 2023: PayPal Holdings Inc. announced that customers can add their eligible PayPal and Venmo credit or debit cards to Apple Wallet and begin making payments. Customers can tap their iPhone and Apple Watch. PayPal and Venmo credit or debit card holders can make payments quickly and securely in-store, online, or on their favorite apps using Apple Pay.
- May 2023: Stripe Inc. collaborated with Lotus. This cooperation will be launched with sales of the Eletre, Lotus's first mainstream electric vehicle, and the World's First Electric Hyper SUV. It will also deploy this strategy, which enables Lotus to take over a complete selling cycle from production to delivery to deliver an overall enhanced customer experience.
In-Depth Third Party Payment Market Market Outlook
The Third Party Payment Market is poised for sustained and significant growth, driven by ongoing digital transformation and evolving consumer expectations. The continued expansion of e-commerce, coupled with the increasing sophistication of mobile payment technologies, will remain primary growth accelerators. Emerging opportunities in areas like embedded finance and the integration of alternative payment methods, including stablecoins, are expected to unlock new revenue streams. Strategic partnerships and ongoing innovation in fraud prevention and customer experience will be critical for sustained competitive advantage. The market's outlook is exceptionally strong, with a projected market size of $5,500,000 Million by 2033, indicating robust potential for businesses operating within this dynamic sector.
Third Party Payment Market Segmentation
-
1. Type
- 1.1. Online
- 1.2. Mobile
- 1.3. Point of Sale
-
2. End User
- 2.1. BFSI
- 2.2. Retail
- 2.3. E-Commerce
- 2.4. Other End Users
Third Party Payment Market Segmentation By Geography
- 1. North America
- 2. Europe
- 3. Asia
- 4. Australia and New Zealand
- 5. Latin America
- 6. Middle East and Africa
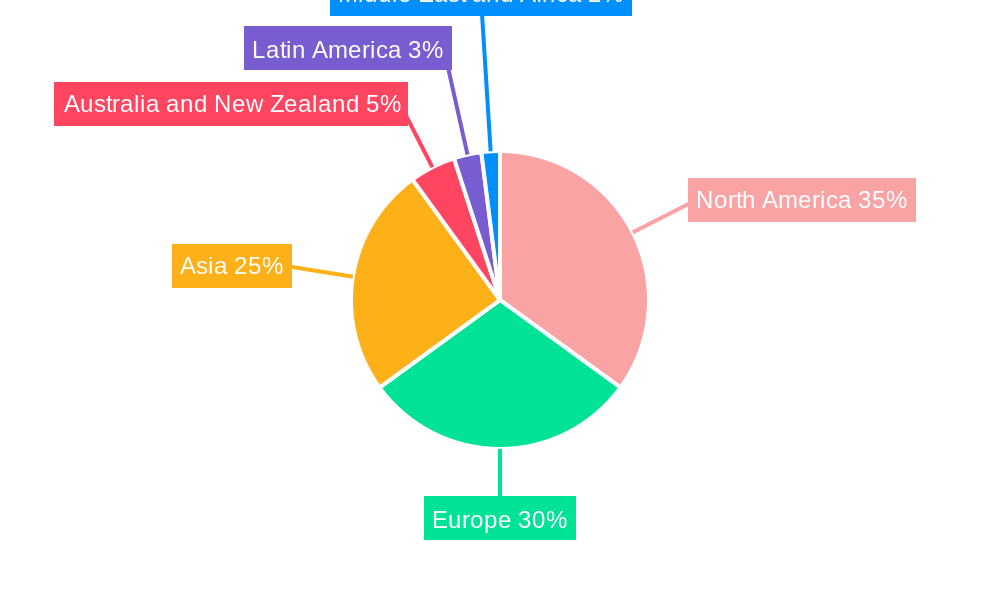
Third Party Payment Market Regional Market Share
Geographic Coverage of Third Party Payment Market
Third Party Payment Market REPORT HIGHLIGHTS
| Aspects | Details |
|---|---|
| Study Period | 2020-2034 |
| Base Year | 2025 |
| Estimated Year | 2026 |
| Forecast Period | 2026-2034 |
| Historical Period | 2020-2025 |
| Growth Rate | CAGR of 35.10% from 2020-2034 |
| Segmentation |
|
Table of Contents
- 1. Introduction
- 1.1. Research Scope
- 1.2. Market Segmentation
- 1.3. Research Objective
- 1.4. Definitions and Assumptions
- 2. Executive Summary
- 2.1. Market Snapshot
- 3. Market Dynamics
- 3.1. Market Drivers
- 3.2. Market Restrains
- 3.3. Market Trends
- 3.4. Market Opportunities
- 4. Market Factor Analysis
- 4.1. Porters Five Forces
- 4.1.1. Bargaining Power of Suppliers
- 4.1.2. Bargaining Power of Buyers
- 4.1.3. Threat of New Entrants
- 4.1.4. Threat of Substitutes
- 4.1.5. Competitive Rivalry
- 4.2. PESTEL analysis
- 4.3. BCG Analysis
- 4.3.1. Stars (High Growth, High Market Share)
- 4.3.2. Cash Cows (Low Growth, High Market Share)
- 4.3.3. Question Mark (High Growth, Low Market Share)
- 4.3.4. Dogs (Low Growth, Low Market Share)
- 4.4. Ansoff Matrix Analysis
- 4.5. Supply Chain Analysis
- 4.6. Regulatory Landscape
- 4.7. Current Market Potential and Opportunity Assessment (TAM–SAM–SOM Framework)
- 4.8. VDR Analyst Note
- 4.1. Porters Five Forces
- 5. Market Analysis, Insights and Forecast 2021-2033
- 5.1. Market Analysis, Insights and Forecast - by Type
- 5.1.1. Online
- 5.1.2. Mobile
- 5.1.3. Point of Sale
- 5.2. Market Analysis, Insights and Forecast - by End User
- 5.2.1. BFSI
- 5.2.2. Retail
- 5.2.3. E-Commerce
- 5.2.4. Other End Users
- 5.3. Market Analysis, Insights and Forecast - by Region
- 5.3.1. North America
- 5.3.2. Europe
- 5.3.3. Asia
- 5.3.4. Australia and New Zealand
- 5.3.5. Latin America
- 5.3.6. Middle East and Africa
- 5.1. Market Analysis, Insights and Forecast - by Type
- 6. Global Third Party Payment Market Analysis, Insights and Forecast, 2021-2033
- 6.1. Market Analysis, Insights and Forecast - by Type
- 6.1.1. Online
- 6.1.2. Mobile
- 6.1.3. Point of Sale
- 6.2. Market Analysis, Insights and Forecast - by End User
- 6.2.1. BFSI
- 6.2.2. Retail
- 6.2.3. E-Commerce
- 6.2.4. Other End Users
- 6.1. Market Analysis, Insights and Forecast - by Type
- 7. North America Third Party Payment Market Analysis, Insights and Forecast, 2021-2033
- 7.1. Market Analysis, Insights and Forecast - by Type
- 7.1.1. Online
- 7.1.2. Mobile
- 7.1.3. Point of Sale
- 7.2. Market Analysis, Insights and Forecast - by End User
- 7.2.1. BFSI
- 7.2.2. Retail
- 7.2.3. E-Commerce
- 7.2.4. Other End Users
- 7.1. Market Analysis, Insights and Forecast - by Type
- 8. Europe Third Party Payment Market Analysis, Insights and Forecast, 2021-2033
- 8.1. Market Analysis, Insights and Forecast - by Type
- 8.1.1. Online
- 8.1.2. Mobile
- 8.1.3. Point of Sale
- 8.2. Market Analysis, Insights and Forecast - by End User
- 8.2.1. BFSI
- 8.2.2. Retail
- 8.2.3. E-Commerce
- 8.2.4. Other End Users
- 8.1. Market Analysis, Insights and Forecast - by Type
- 9. Asia Third Party Payment Market Analysis, Insights and Forecast, 2021-2033
- 9.1. Market Analysis, Insights and Forecast - by Type
- 9.1.1. Online
- 9.1.2. Mobile
- 9.1.3. Point of Sale
- 9.2. Market Analysis, Insights and Forecast - by End User
- 9.2.1. BFSI
- 9.2.2. Retail
- 9.2.3. E-Commerce
- 9.2.4. Other End Users
- 9.1. Market Analysis, Insights and Forecast - by Type
- 10. Australia and New Zealand Third Party Payment Market Analysis, Insights and Forecast, 2021-2033
- 10.1. Market Analysis, Insights and Forecast - by Type
- 10.1.1. Online
- 10.1.2. Mobile
- 10.1.3. Point of Sale
- 10.2. Market Analysis, Insights and Forecast - by End User
- 10.2.1. BFSI
- 10.2.2. Retail
- 10.2.3. E-Commerce
- 10.2.4. Other End Users
- 10.1. Market Analysis, Insights and Forecast - by Type
- 11. Latin America Third Party Payment Market Analysis, Insights and Forecast, 2021-2033
- 11.1. Market Analysis, Insights and Forecast - by Type
- 11.1.1. Online
- 11.1.2. Mobile
- 11.1.3. Point of Sale
- 11.2. Market Analysis, Insights and Forecast - by End User
- 11.2.1. BFSI
- 11.2.2. Retail
- 11.2.3. E-Commerce
- 11.2.4. Other End Users
- 11.1. Market Analysis, Insights and Forecast - by Type
- 12. Middle East and Africa Third Party Payment Market Analysis, Insights and Forecast, 2021-2033
- 12.1. Market Analysis, Insights and Forecast - by Type
- 12.1.1. Online
- 12.1.2. Mobile
- 12.1.3. Point of Sale
- 12.2. Market Analysis, Insights and Forecast - by End User
- 12.2.1. BFSI
- 12.2.2. Retail
- 12.2.3. E-Commerce
- 12.2.4. Other End Users
- 12.1. Market Analysis, Insights and Forecast - by Type
- 13. Competitive Analysis
- 13.1. Company Profiles
- 13.1.1 Stripe Inc
- 13.1.1.1. Company Overview
- 13.1.1.2. Products
- 13.1.1.3. Company Financials
- 13.1.1.4. SWOT Analysis
- 13.1.2 Authorize Net (CyberSource Corporation)
- 13.1.2.1. Company Overview
- 13.1.2.2. Products
- 13.1.2.3. Company Financials
- 13.1.2.4. SWOT Analysis
- 13.1.3 PayPal Holdings Inc
- 13.1.3.1. Company Overview
- 13.1.3.2. Products
- 13.1.3.3. Company Financials
- 13.1.3.4. SWOT Analysis
- 13.1.4 Adyen NV
- 13.1.4.1. Company Overview
- 13.1.4.2. Products
- 13.1.4.3. Company Financials
- 13.1.4.4. SWOT Analysis
- 13.1.5 First Data Corporation (Fiserv Inc )
- 13.1.5.1. Company Overview
- 13.1.5.2. Products
- 13.1.5.3. Company Financials
- 13.1.5.4. SWOT Analysis
- 13.1.6 Amazon Payments Inc
- 13.1.6.1. Company Overview
- 13.1.6.2. Products
- 13.1.6.3. Company Financials
- 13.1.6.4. SWOT Analysis
- 13.1.7 Alipay com Co Ltd
- 13.1.7.1. Company Overview
- 13.1.7.2. Products
- 13.1.7.3. Company Financials
- 13.1.7.4. SWOT Analysis
- 13.1.8 2checkout Com Inc (Avangate BV)
- 13.1.8.1. Company Overview
- 13.1.8.2. Products
- 13.1.8.3. Company Financials
- 13.1.8.4. SWOT Analysis
- 13.1.9 One 97 Communications Limite
- 13.1.9.1. Company Overview
- 13.1.9.2. Products
- 13.1.9.3. Company Financials
- 13.1.9.4. SWOT Analysis
- 13.1.10 WePay Inc (JPMorgan Chase & Co )
- 13.1.10.1. Company Overview
- 13.1.10.2. Products
- 13.1.10.3. Company Financials
- 13.1.10.4. SWOT Analysis
- 13.1.1 Stripe Inc
- 13.2. Market Entropy
- 13.2.1 Company's Key Areas Served
- 13.2.2 Recent Developments
- 13.3. Company Market Share Analysis 2025
- 13.3.1 Top 5 Companies Market Share Analysis
- 13.3.2 Top 3 Companies Market Share Analysis
- 13.4. List of Potential Customers
- 14. Research Methodology
List of Figures
- Figure 1: Global Third Party Payment Market Revenue Breakdown (Million, %) by Region 2025 & 2033
- Figure 2: North America Third Party Payment Market Revenue (Million), by Type 2025 & 2033
- Figure 3: North America Third Party Payment Market Revenue Share (%), by Type 2025 & 2033
- Figure 4: North America Third Party Payment Market Revenue (Million), by End User 2025 & 2033
- Figure 5: North America Third Party Payment Market Revenue Share (%), by End User 2025 & 2033
- Figure 6: North America Third Party Payment Market Revenue (Million), by Country 2025 & 2033
- Figure 7: North America Third Party Payment Market Revenue Share (%), by Country 2025 & 2033
- Figure 8: Europe Third Party Payment Market Revenue (Million), by Type 2025 & 2033
- Figure 9: Europe Third Party Payment Market Revenue Share (%), by Type 2025 & 2033
- Figure 10: Europe Third Party Payment Market Revenue (Million), by End User 2025 & 2033
- Figure 11: Europe Third Party Payment Market Revenue Share (%), by End User 2025 & 2033
- Figure 12: Europe Third Party Payment Market Revenue (Million), by Country 2025 & 2033
- Figure 13: Europe Third Party Payment Market Revenue Share (%), by Country 2025 & 2033
- Figure 14: Asia Third Party Payment Market Revenue (Million), by Type 2025 & 2033
- Figure 15: Asia Third Party Payment Market Revenue Share (%), by Type 2025 & 2033
- Figure 16: Asia Third Party Payment Market Revenue (Million), by End User 2025 & 2033
- Figure 17: Asia Third Party Payment Market Revenue Share (%), by End User 2025 & 2033
- Figure 18: Asia Third Party Payment Market Revenue (Million), by Country 2025 & 2033
- Figure 19: Asia Third Party Payment Market Revenue Share (%), by Country 2025 & 2033
- Figure 20: Australia and New Zealand Third Party Payment Market Revenue (Million), by Type 2025 & 2033
- Figure 21: Australia and New Zealand Third Party Payment Market Revenue Share (%), by Type 2025 & 2033
- Figure 22: Australia and New Zealand Third Party Payment Market Revenue (Million), by End User 2025 & 2033
- Figure 23: Australia and New Zealand Third Party Payment Market Revenue Share (%), by End User 2025 & 2033
- Figure 24: Australia and New Zealand Third Party Payment Market Revenue (Million), by Country 2025 & 2033
- Figure 25: Australia and New Zealand Third Party Payment Market Revenue Share (%), by Country 2025 & 2033
- Figure 26: Latin America Third Party Payment Market Revenue (Million), by Type 2025 & 2033
- Figure 27: Latin America Third Party Payment Market Revenue Share (%), by Type 2025 & 2033
- Figure 28: Latin America Third Party Payment Market Revenue (Million), by End User 2025 & 2033
- Figure 29: Latin America Third Party Payment Market Revenue Share (%), by End User 2025 & 2033
- Figure 30: Latin America Third Party Payment Market Revenue (Million), by Country 2025 & 2033
- Figure 31: Latin America Third Party Payment Market Revenue Share (%), by Country 2025 & 2033
- Figure 32: Middle East and Africa Third Party Payment Market Revenue (Million), by Type 2025 & 2033
- Figure 33: Middle East and Africa Third Party Payment Market Revenue Share (%), by Type 2025 & 2033
- Figure 34: Middle East and Africa Third Party Payment Market Revenue (Million), by End User 2025 & 2033
- Figure 35: Middle East and Africa Third Party Payment Market Revenue Share (%), by End User 2025 & 2033
- Figure 36: Middle East and Africa Third Party Payment Market Revenue (Million), by Country 2025 & 2033
- Figure 37: Middle East and Africa Third Party Payment Market Revenue Share (%), by Country 2025 & 2033
List of Tables
- Table 1: Global Third Party Payment Market Revenue Million Forecast, by Type 2020 & 2033
- Table 2: Global Third Party Payment Market Revenue Million Forecast, by End User 2020 & 2033
- Table 3: Global Third Party Payment Market Revenue Million Forecast, by Region 2020 & 2033
- Table 4: Global Third Party Payment Market Revenue Million Forecast, by Type 2020 & 2033
- Table 5: Global Third Party Payment Market Revenue Million Forecast, by End User 2020 & 2033
- Table 6: Global Third Party Payment Market Revenue Million Forecast, by Country 2020 & 2033
- Table 7: Global Third Party Payment Market Revenue Million Forecast, by Type 2020 & 2033
- Table 8: Global Third Party Payment Market Revenue Million Forecast, by End User 2020 & 2033
- Table 9: Global Third Party Payment Market Revenue Million Forecast, by Country 2020 & 2033
- Table 10: Global Third Party Payment Market Revenue Million Forecast, by Type 2020 & 2033
- Table 11: Global Third Party Payment Market Revenue Million Forecast, by End User 2020 & 2033
- Table 12: Global Third Party Payment Market Revenue Million Forecast, by Country 2020 & 2033
- Table 13: Global Third Party Payment Market Revenue Million Forecast, by Type 2020 & 2033
- Table 14: Global Third Party Payment Market Revenue Million Forecast, by End User 2020 & 2033
- Table 15: Global Third Party Payment Market Revenue Million Forecast, by Country 2020 & 2033
- Table 16: Global Third Party Payment Market Revenue Million Forecast, by Type 2020 & 2033
- Table 17: Global Third Party Payment Market Revenue Million Forecast, by End User 2020 & 2033
- Table 18: Global Third Party Payment Market Revenue Million Forecast, by Country 2020 & 2033
- Table 19: Global Third Party Payment Market Revenue Million Forecast, by Type 2020 & 2033
- Table 20: Global Third Party Payment Market Revenue Million Forecast, by End User 2020 & 2033
- Table 21: Global Third Party Payment Market Revenue Million Forecast, by Country 2020 & 2033
Frequently Asked Questions
1. What is the projected Compound Annual Growth Rate (CAGR) of the Third Party Payment Market?
The projected CAGR is approximately 35.10%.
2. Which companies are prominent players in the Third Party Payment Market?
Key companies in the market include Stripe Inc, Authorize Net (CyberSource Corporation), PayPal Holdings Inc, Adyen NV, First Data Corporation (Fiserv Inc ), Amazon Payments Inc, Alipay com Co Ltd, 2checkout Com Inc (Avangate BV), One 97 Communications Limite, WePay Inc (JPMorgan Chase & Co ).
3. What are the main segments of the Third Party Payment Market?
The market segments include Type, End User.
4. Can you provide details about the market size?
The market size is estimated to be USD 55.70 Million as of 2022.
5. What are some drivers contributing to market growth?
Penetration of Internet Leading to Proliferation of Digital Payments; Cloud Based Systems Leading to Growth of B2B Sales and also Higher Sales in the POS Segment; Growth of E-Commerce Across the High Growth Regions of the World.
6. What are the notable trends driving market growth?
The Point of Sale Segment is Expected to Drive the Market.
7. Are there any restraints impacting market growth?
Security and Privacy Concerns to Restrain the Market.
8. Can you provide examples of recent developments in the market?
October 2023: PayPal Holdings Inc. announced that customers can add their eligible PayPal and Venmo credit or debit cards to Apple Wallet and begin making payments. Customers can tap their iPhone and Apple Watch. PayPal and Venmo credit or debit card holders can make payments quickly and securely in-store, online, or on their favorite apps using Apple Pay.
9. What pricing options are available for accessing the report?
Pricing options include single-user, multi-user, and enterprise licenses priced at USD 4750, USD 5250, and USD 8750 respectively.
10. Is the market size provided in terms of value or volume?
The market size is provided in terms of value, measured in Million.
11. Are there any specific market keywords associated with the report?
Yes, the market keyword associated with the report is "Third Party Payment Market," which aids in identifying and referencing the specific market segment covered.
12. How do I determine which pricing option suits my needs best?
The pricing options vary based on user requirements and access needs. Individual users may opt for single-user licenses, while businesses requiring broader access may choose multi-user or enterprise licenses for cost-effective access to the report.
13. Are there any additional resources or data provided in the Third Party Payment Market report?
While the report offers comprehensive insights, it's advisable to review the specific contents or supplementary materials provided to ascertain if additional resources or data are available.
14. How can I stay updated on further developments or reports in the Third Party Payment Market?
To stay informed about further developments, trends, and reports in the Third Party Payment Market, consider subscribing to industry newsletters, following relevant companies and organizations, or regularly checking reputable industry news sources and publications.
Methodology
Step 1 - Identification of Relevant Samples Size from Population Database


Step 2 - Approaches for Defining Global Market Size (Value, Volume* & Price*)

Note*: In applicable scenarios
Step 3 - Data Sources
Primary Research
- Web Analytics
- Survey Reports
- Research Institute
- Latest Research Reports
- Opinion Leaders
Secondary Research
- Annual Reports
- White Paper
- Latest Press Release
- Industry Association
- Paid Database
- Investor Presentations

Step 4 - Data Triangulation
Involves using different sources of information in order to increase the validity of a study
These sources are likely to be stakeholders in a program - participants, other researchers, program staff, other community members, and so on.
Then we put all data in single framework & apply various statistical tools to find out the dynamic on the market.
During the analysis stage, feedback from the stakeholder groups would be compared to determine areas of agreement as well as areas of divergence