
Key Insights
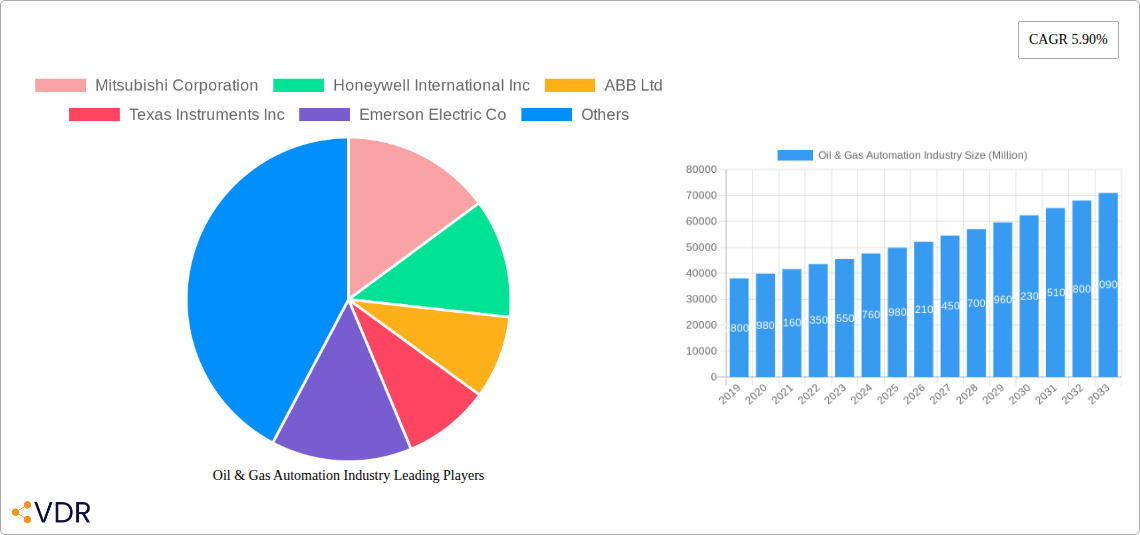
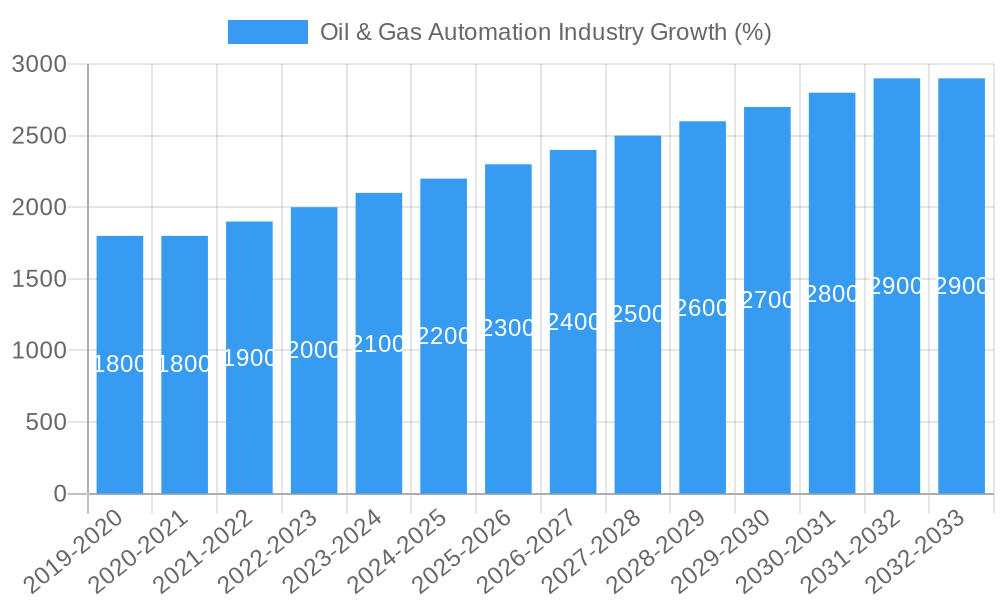
The global Oil & Gas Automation Industry is poised for robust growth, projected to reach an estimated market size of approximately $50,000 million by 2025, expanding at a Compound Annual Growth Rate (CAGR) of 5.90% through 2033. This expansion is fueled by the critical need for enhanced operational efficiency, improved safety standards, and reduced environmental impact across the upstream, midstream, and downstream sectors. Key drivers include the increasing complexity of exploration and production activities, the demand for real-time data analysis for decision-making, and the imperative to comply with stringent regulatory requirements. The industry is witnessing a significant shift towards the adoption of advanced digital technologies, such as Industrial Internet of Things (IIoT) sensors, advanced analytics, and predictive maintenance solutions, which are instrumental in optimizing asset performance and minimizing downtime. This technological integration is crucial for navigating the volatile energy landscape and ensuring sustainable operations.
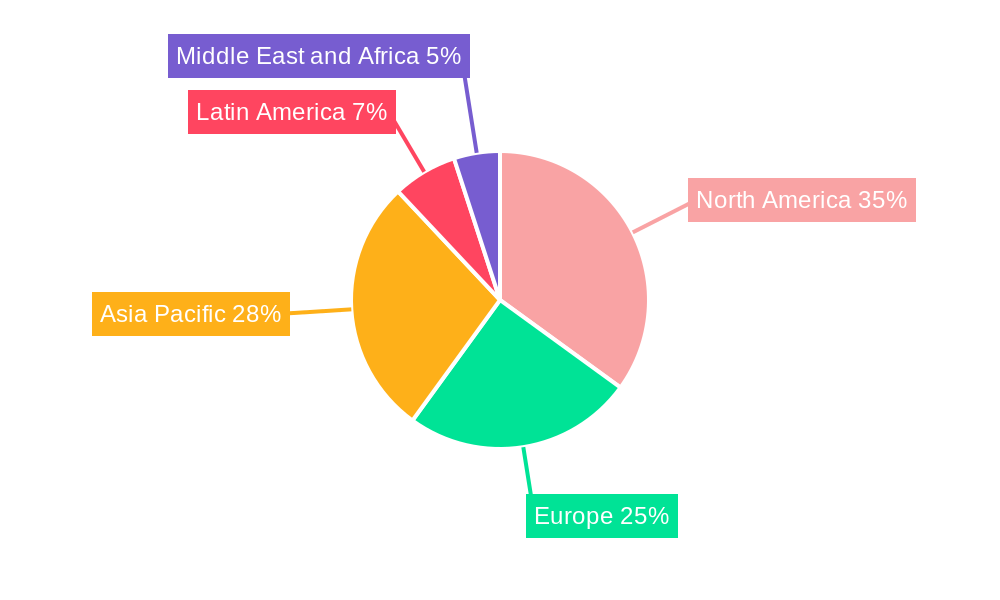
The market's trajectory is further shaped by significant trends including the rise of digitalization and Industry 4.0 initiatives, enabling a more connected and intelligent oil and gas value chain. The adoption of cloud computing, artificial intelligence (AI), and machine learning (ML) is becoming indispensable for processing vast amounts of operational data, facilitating predictive analytics for equipment failure, and optimizing production processes. While the industry faces challenges such as high initial investment costs for automation solutions and cybersecurity concerns related to interconnected systems, the long-term benefits in terms of cost reduction, enhanced safety, and environmental stewardship are compelling. Geographically, North America and Asia Pacific are anticipated to lead the market due to significant investments in new energy infrastructure and a strong focus on technological adoption, while Europe and other regions are also contributing to the overall market expansion with their own strategic initiatives in modernizing oil and gas operations. Leading companies like Siemens, Honeywell, and Emerson Electric are at the forefront of innovation, driving the development and deployment of sophisticated automation solutions.
Report Description: Navigating the Future of Oil & Gas Automation: Market Dynamics, Growth Trends, and Strategic Insights (2019-2033)
This comprehensive report offers an in-depth analysis of the global Oil & Gas Automation market, a critical sector undergoing rapid transformation driven by technological advancements, stringent regulatory landscapes, and the imperative for enhanced operational efficiency. Covering the historical period from 2019 to 2024 and projecting growth through 2033, this study provides actionable insights for stakeholders seeking to capitalize on evolving market dynamics. With a base year of 2025, the report delves into market size, growth drivers, technological adoption, regional dominance, and the competitive landscape, empowering industry professionals with data-driven strategic decision-making.
Oil & Gas Automation Industry Market Dynamics & Structure
The Oil & Gas Automation market is characterized by a dynamic interplay of forces shaping its structure and future trajectory. Market concentration is influenced by the presence of major global players alongside specialized technology providers, creating a competitive yet collaborative ecosystem. Technological innovation serves as a primary driver, with advancements in Artificial Intelligence (AI), Machine Learning (ML), Industrial Internet of Things (IIoT), and advanced analytics continuously pushing the boundaries of what is achievable in upstream, midstream, and downstream operations. Regulatory frameworks, particularly those focused on safety, environmental protection, and data security, play a pivotal role in dictating the adoption pace and specific requirements for automation solutions. Competitive product substitutes, while present in niche areas, are increasingly being integrated into broader automation solutions, rather than directly replacing them. End-user demographics are shifting towards a more digitally adept workforce, necessitating user-friendly interfaces and comprehensive training. Mergers and acquisitions (M&A) trends highlight a strategic consolidation of capabilities, with larger entities acquiring innovative startups to enhance their portfolios and expand market reach. For instance, recent M&A activities demonstrate a focus on integrating AI-driven analytics and cybersecurity solutions.
- Market Concentration: Moderate to High, with key global players and specialized technology providers.
- Technological Innovation Drivers: AI, ML, IIoT, Big Data Analytics, Cybersecurity, Digital Twins.
- Regulatory Frameworks: Driven by safety standards (e.g., IEC 61511), environmental regulations, and data privacy laws.
- Competitive Product Substitutes: Limited direct substitutes for comprehensive automation systems, but integration of niche solutions is common.
- End-User Demographics: Growing demand for integrated, user-friendly, and data-driven solutions.
- M&A Trends: Strategic acquisitions of AI, analytics, and cybersecurity firms, as well as companies with strong regional presence.
Oil & Gas Automation Industry Growth Trends & Insights
The Oil & Gas Automation industry is poised for substantial growth, projected to expand from approximately $75,200 million in 2025 to an estimated $115,500 million by 2033, exhibiting a Compound Annual Growth Rate (CAGR) of 5.4% during the forecast period (2025-2033). This robust expansion is underpinned by a confluence of factors including increasing digitalization initiatives across the energy sector, the relentless pursuit of operational efficiency and cost optimization, and the growing demand for enhanced safety and environmental compliance. Adoption rates for advanced automation technologies such as AI-powered predictive maintenance, autonomous systems, and sophisticated sensor networks are accelerating, particularly in response to volatile market conditions and the need to maximize hydrocarbon recovery. Technological disruptions, including the integration of cloud computing for data management and real-time analytics, are fundamentally reshaping how oil and gas operations are managed. Consumer behavior shifts are evident as energy companies prioritize data-driven decision-making, risk mitigation, and sustainable operational practices. The market penetration of sophisticated automation solutions is steadily increasing, with a notable trend towards integrated platforms that offer end-to-end visibility and control across the entire value chain. Furthermore, the growing emphasis on remote monitoring and control solutions, driven by factors like workforce safety and the need for specialized expertise in remote locations, is further fueling market growth. The transition towards cleaner energy sources also presents opportunities for automation in carbon capture, utilization, and storage (CCUS) projects.
Dominant Regions, Countries, or Segments in Oil & Gas Automation Industry
The Upstream segment is a dominant force in the Oil & Gas Automation industry, projected to account for a significant market share of over 40% of the total market value by 2025. This dominance is driven by the inherent complexities and high-stakes nature of exploration, drilling, and production activities. The implementation of advanced automation in upstream operations is crucial for enhancing resource recovery, optimizing drilling efficiency, improving safety in hazardous environments, and reducing operational costs. Key regions contributing to this dominance include North America, particularly the United States and Canada, due to their extensive shale oil and gas production, and the Middle East, characterized by large-scale conventional oil and gas reserves.
Within the technology domain, Sensors & Transmitters and Distributed Control Systems (DCS) emerge as foundational pillars, collectively holding an estimated 35% market share by 2025. Sensors and transmitters are indispensable for real-time data acquisition across all operational phases, providing critical information on pressure, temperature, flow rates, and composition. DCS, on the other hand, provides the centralized control and monitoring infrastructure essential for managing complex industrial processes in refineries, chemical plants, and offshore platforms. The increasing sophistication and miniaturization of sensors, coupled with advancements in wireless communication and data analytics capabilities embedded within DCS, are key drivers of their sustained importance.
Key Drivers for Upstream Dominance:
- Complex Operational Environments: Deepwater drilling, unconventional resource extraction, and remote locations necessitate high levels of automation for safety and efficiency.
- Resource Optimization: Automation enables precise control over reservoir management and production processes, maximizing hydrocarbon yield.
- Cost Reduction Imperative: Automation helps mitigate labor costs, reduce downtime, and minimize waste.
- Safety and Environmental Compliance: Stringent regulations drive the adoption of automated safety systems and leak detection technologies.
Dominance Factors for Sensors & Transmitters and DCS:
- Data Foundation: Essential for all subsequent analytical and control functions.
- Process Control Backbone: DCS provides the critical infrastructure for managing and optimizing complex industrial processes.
- Technological Advancements: Miniaturization, increased accuracy, wireless capabilities, and integration with AI for anomaly detection.
- Industry Standards: Established protocols and architectures ensure interoperability and reliability.
The Midstream and Downstream segments are also experiencing significant growth, driven by the need for efficient transportation, processing, and refining of oil and gas products. However, the sheer scale of investment and the critical nature of initial extraction firmly position the Upstream segment as the leading contributor to the overall Oil & Gas Automation market.
Oil & Gas Automation Industry Product Landscape
The Oil & Gas Automation industry is witnessing a surge in innovative product development, focusing on enhancing efficiency, safety, and sustainability. Advanced Sensors & Transmitters are now equipped with AI capabilities for predictive diagnostics, offering real-time insights into equipment health. Distributed Control Systems (DCS) are evolving into integrated platforms with advanced cybersecurity features and cloud connectivity, enabling remote monitoring and control. Programmable Logic Controllers (PLCs) are becoming more powerful and scalable, supporting complex automation tasks in challenging environments. Safety Instrumented Systems (SIS) are incorporating more sophisticated algorithms for faster and more reliable hazard mitigation. The integration of Manufacturing Execution Systems (MES) with enterprise resource planning (ERP) systems is streamlining production workflows and supply chain management. Furthermore, the rise of Industrial Asset Management software, leveraging digital twin technology and AI, is revolutionizing predictive maintenance and extending asset lifecare.
Key Drivers, Barriers & Challenges in Oil & Gas Automation Industry
Key Drivers:
- Operational Efficiency Demands: The constant need to optimize production, reduce downtime, and lower operating costs is a primary driver for automation adoption.
- Enhanced Safety and Environmental Compliance: Stringent regulations and the inherent risks in oil and gas operations necessitate advanced automated safety systems and monitoring.
- Technological Advancements: The availability of sophisticated AI, ML, IoT, and big data analytics technologies enables more intelligent and efficient automation solutions.
- Digital Transformation Initiatives: The broader industry push towards digitalization fuels investment in automation as a core component.
- Aging Infrastructure Modernization: Upgrading legacy systems with modern automation solutions is crucial for continued operational viability.
Key Barriers & Challenges:
- High Initial Investment Costs: The capital expenditure for implementing comprehensive automation systems can be substantial.
- Cybersecurity Risks: The increasing connectivity of industrial systems presents significant vulnerabilities to cyber threats, requiring robust security measures.
- Skilled Workforce Shortage: A lack of trained personnel to operate, maintain, and service complex automation systems can hinder adoption.
- Integration Complexity: Integrating new automation solutions with existing legacy systems can be technically challenging and time-consuming.
- Regulatory Uncertainty: Evolving regulatory landscapes, particularly concerning data privacy and environmental standards, can create ambiguity and impact investment decisions.
- Supply Chain Disruptions: Global supply chain issues can impact the availability and cost of critical automation components. The impact on project timelines and budget can be significant, leading to delays of up to 15% and cost overruns of up to 10% in some cases.
Emerging Opportunities in Oil & Gas Automation Industry
Emerging opportunities in the Oil & Gas Automation industry are centered around leveraging cutting-edge technologies for enhanced sustainability and operational intelligence. The growing demand for renewable energy integration presents a significant avenue for automation in managing hybrid energy systems and smart grids. Carbon Capture, Utilization, and Storage (CCUS) technologies represent a nascent but rapidly expanding market where automation will play a critical role in monitoring, controlling, and optimizing CO2 capture and sequestration processes. Furthermore, the application of AI and ML in predictive analytics is moving beyond equipment maintenance to encompass broader aspects like reservoir performance forecasting and market trend analysis. The development of autonomous robotic systems for inspection and maintenance in hazardous or remote environments, such as deep-sea pipelines or offshore platforms, offers substantial growth potential. The increasing focus on data monetization and the creation of digital twins for comprehensive asset lifecycle management are also key emerging trends.
Growth Accelerators in the Oil & Gas Automation Industry Industry
Several factors are acting as significant growth accelerators for the Oil & Gas Automation industry. The relentless drive for cost reduction and operational efficiency in a volatile commodity price environment compels companies to invest in automation to optimize every stage of the value chain. The increasing global emphasis on environmental sustainability and stringent regulatory requirements for emissions control and safety are spurring the adoption of advanced monitoring and control systems. Technological breakthroughs in areas like edge computing, 5G connectivity, and AI-powered analytics are enabling more sophisticated and real-time decision-making capabilities, making automation solutions more attractive and effective. Strategic partnerships between automation technology providers and oil and gas majors are accelerating the development and deployment of tailored solutions, fostering innovation and market penetration. Furthermore, the ongoing digital transformation across the energy sector, with a focus on building data-driven organizations, is creating a fertile ground for the widespread adoption of automation technologies.
Key Players Shaping the Oil & Gas Automation Industry Market
- Mitsubishi Corporation
- Honeywell International Inc
- ABB Ltd
- Texas Instruments Inc
- Emerson Electric Co
- Schneider Electric SE
- Siemens Corporation
- Johnson Controls Inc
- Robert Bosch GmbH
- Dassault Systèmes SE
- Rockwell Automation Inc
- Yokogawa Electric Corporation
- Eaton Corporation
Notable Milestones in Oil & Gas Automation Industry Sector
- June 2022: GE Digital unveiled its innovative Accelerator product line, featuring best-in-class computer solutions for rapid Asset Performance Management (APM) setup in asset-intensive power industries. This initiative aims to reduce time to value and extend APM benefits across a wider range of assets, driving financial gains for organizations.
- May 2022: ChampionX Artificial Lift released XSPOC 3.2, an advanced version of its production optimization software. This update enhances AI-driven autonomous management capabilities and introduces new features for rod- and gas-lifted wells, including plunger lift analytics for easier diagnosis and trend tracking.
- April 2022: Honeywell announced that Petroleum Development Oman (PDO) is modernizing its Government Gas Plant (GGP) management network. This upgrade focuses on standardizing the design to ensure efficient and sustainable gas processing, helping PDO meet the nation's growing gas demand.
In-Depth Oil & Gas Automation Industry Market Outlook
The Oil & Gas Automation industry is set to witness sustained growth, propelled by a strategic shift towards operational excellence and digital transformation. The increasing integration of AI, ML, and IoT technologies is enabling unprecedented levels of predictive maintenance, remote monitoring, and autonomous operations, particularly in challenging upstream environments. Midstream and downstream sectors are also benefiting from advanced automation for optimizing logistics, refining processes, and ensuring product quality. The market's future trajectory is significantly influenced by the global energy transition, with automation playing a crucial role in enabling the efficient and safe management of emerging energy sources and CCUS technologies. Strategic collaborations between technology providers and energy companies, coupled with a focus on cybersecurity and workforce development, will be pivotal in realizing the full potential of this evolving industry, ensuring resilience, sustainability, and profitability in the decades to come.
Oil & Gas Automation Industry Segmentation
-
1. Process
- 1.1. Upstream
- 1.2. Midstream
- 1.3. Downstream
-
2. Technology
- 2.1. Sensors & Transmitters
- 2.2. Distributed Control Systems (DCS)
- 2.3. Programmable Logic Controllers (PLC)
- 2.4. Supervis
- 2.5. Safety Instrumented Systems (SIS)
- 2.6. Variable Frequency Drive (VFD)
- 2.7. Manufacturing Execution System
- 2.8. Industrial Asset Management
- 2.9. Other Technologies
Oil & Gas Automation Industry Segmentation By Geography
-
1. North America
- 1.1. United States
- 1.2. Canada
-
2. Europe
- 2.1. United Kingdom
- 2.2. Germany
- 2.3. France
- 2.4. Rest of Europe
-
3. Asia Pacific
- 3.1. China
- 3.2. India
- 3.3. Japan
- 3.4. Rest of Asia Pacific
- 4. Latin America
- 5. Middle East and Africa
Oil & Gas Automation Industry REPORT HIGHLIGHTS
| Aspects | Details |
|---|---|
| Study Period | 2019-2033 |
| Base Year | 2024 |
| Estimated Year | 2025 |
| Forecast Period | 2025-2033 |
| Historical Period | 2019-2024 |
| Growth Rate | CAGR of 5.90% from 2019-2033 |
| Segmentation |
|
Table of Contents
- 1. Introduction
- 1.1. Research Scope
- 1.2. Market Segmentation
- 1.3. Research Methodology
- 1.4. Definitions and Assumptions
- 2. Executive Summary
- 2.1. Introduction
- 3. Market Dynamics
- 3.1. Introduction
- 3.2. Market Drivers
- 3.2.1. Growth of Industrial & Infrastructural Activities in Developing Economies; Increasing Oil Consumption; Increasing Scarcity of Skilled Workers; Increase in Demand from the Oil & Gas Industry
- 3.3. Market Restrains
- 3.3.1. Relatively High Deployment Costs; Complex Design compared to Traditional Sensors
- 3.4. Market Trends
- 3.4.1. Variable Frequency Drives to Have Significant Share
- 4. Market Factor Analysis
- 4.1. Porters Five Forces
- 4.2. Supply/Value Chain
- 4.3. PESTEL analysis
- 4.4. Market Entropy
- 4.5. Patent/Trademark Analysis
- 5. Global Oil & Gas Automation Industry Analysis, Insights and Forecast, 2019-2031
- 5.1. Market Analysis, Insights and Forecast - by Process
- 5.1.1. Upstream
- 5.1.2. Midstream
- 5.1.3. Downstream
- 5.2. Market Analysis, Insights and Forecast - by Technology
- 5.2.1. Sensors & Transmitters
- 5.2.2. Distributed Control Systems (DCS)
- 5.2.3. Programmable Logic Controllers (PLC)
- 5.2.4. Supervis
- 5.2.5. Safety Instrumented Systems (SIS)
- 5.2.6. Variable Frequency Drive (VFD)
- 5.2.7. Manufacturing Execution System
- 5.2.8. Industrial Asset Management
- 5.2.9. Other Technologies
- 5.3. Market Analysis, Insights and Forecast - by Region
- 5.3.1. North America
- 5.3.2. Europe
- 5.3.3. Asia Pacific
- 5.3.4. Latin America
- 5.3.5. Middle East and Africa
- 5.1. Market Analysis, Insights and Forecast - by Process
- 6. North America Oil & Gas Automation Industry Analysis, Insights and Forecast, 2019-2031
- 6.1. Market Analysis, Insights and Forecast - by Process
- 6.1.1. Upstream
- 6.1.2. Midstream
- 6.1.3. Downstream
- 6.2. Market Analysis, Insights and Forecast - by Technology
- 6.2.1. Sensors & Transmitters
- 6.2.2. Distributed Control Systems (DCS)
- 6.2.3. Programmable Logic Controllers (PLC)
- 6.2.4. Supervis
- 6.2.5. Safety Instrumented Systems (SIS)
- 6.2.6. Variable Frequency Drive (VFD)
- 6.2.7. Manufacturing Execution System
- 6.2.8. Industrial Asset Management
- 6.2.9. Other Technologies
- 6.1. Market Analysis, Insights and Forecast - by Process
- 7. Europe Oil & Gas Automation Industry Analysis, Insights and Forecast, 2019-2031
- 7.1. Market Analysis, Insights and Forecast - by Process
- 7.1.1. Upstream
- 7.1.2. Midstream
- 7.1.3. Downstream
- 7.2. Market Analysis, Insights and Forecast - by Technology
- 7.2.1. Sensors & Transmitters
- 7.2.2. Distributed Control Systems (DCS)
- 7.2.3. Programmable Logic Controllers (PLC)
- 7.2.4. Supervis
- 7.2.5. Safety Instrumented Systems (SIS)
- 7.2.6. Variable Frequency Drive (VFD)
- 7.2.7. Manufacturing Execution System
- 7.2.8. Industrial Asset Management
- 7.2.9. Other Technologies
- 7.1. Market Analysis, Insights and Forecast - by Process
- 8. Asia Pacific Oil & Gas Automation Industry Analysis, Insights and Forecast, 2019-2031
- 8.1. Market Analysis, Insights and Forecast - by Process
- 8.1.1. Upstream
- 8.1.2. Midstream
- 8.1.3. Downstream
- 8.2. Market Analysis, Insights and Forecast - by Technology
- 8.2.1. Sensors & Transmitters
- 8.2.2. Distributed Control Systems (DCS)
- 8.2.3. Programmable Logic Controllers (PLC)
- 8.2.4. Supervis
- 8.2.5. Safety Instrumented Systems (SIS)
- 8.2.6. Variable Frequency Drive (VFD)
- 8.2.7. Manufacturing Execution System
- 8.2.8. Industrial Asset Management
- 8.2.9. Other Technologies
- 8.1. Market Analysis, Insights and Forecast - by Process
- 9. Latin America Oil & Gas Automation Industry Analysis, Insights and Forecast, 2019-2031
- 9.1. Market Analysis, Insights and Forecast - by Process
- 9.1.1. Upstream
- 9.1.2. Midstream
- 9.1.3. Downstream
- 9.2. Market Analysis, Insights and Forecast - by Technology
- 9.2.1. Sensors & Transmitters
- 9.2.2. Distributed Control Systems (DCS)
- 9.2.3. Programmable Logic Controllers (PLC)
- 9.2.4. Supervis
- 9.2.5. Safety Instrumented Systems (SIS)
- 9.2.6. Variable Frequency Drive (VFD)
- 9.2.7. Manufacturing Execution System
- 9.2.8. Industrial Asset Management
- 9.2.9. Other Technologies
- 9.1. Market Analysis, Insights and Forecast - by Process
- 10. Middle East and Africa Oil & Gas Automation Industry Analysis, Insights and Forecast, 2019-2031
- 10.1. Market Analysis, Insights and Forecast - by Process
- 10.1.1. Upstream
- 10.1.2. Midstream
- 10.1.3. Downstream
- 10.2. Market Analysis, Insights and Forecast - by Technology
- 10.2.1. Sensors & Transmitters
- 10.2.2. Distributed Control Systems (DCS)
- 10.2.3. Programmable Logic Controllers (PLC)
- 10.2.4. Supervis
- 10.2.5. Safety Instrumented Systems (SIS)
- 10.2.6. Variable Frequency Drive (VFD)
- 10.2.7. Manufacturing Execution System
- 10.2.8. Industrial Asset Management
- 10.2.9. Other Technologies
- 10.1. Market Analysis, Insights and Forecast - by Process
- 11. North America Oil & Gas Automation Industry Analysis, Insights and Forecast, 2019-2031
- 11.1. Market Analysis, Insights and Forecast - By Country/Sub-region
- 11.1.1 United States
- 11.1.2 Canada
- 11.1.3 Mexico
- 12. Europe Oil & Gas Automation Industry Analysis, Insights and Forecast, 2019-2031
- 12.1. Market Analysis, Insights and Forecast - By Country/Sub-region
- 12.1.1 Germany
- 12.1.2 United Kingdom
- 12.1.3 France
- 12.1.4 Spain
- 12.1.5 Italy
- 12.1.6 Spain
- 12.1.7 Belgium
- 12.1.8 Netherland
- 12.1.9 Nordics
- 12.1.10 Rest of Europe
- 13. Asia Pacific Oil & Gas Automation Industry Analysis, Insights and Forecast, 2019-2031
- 13.1. Market Analysis, Insights and Forecast - By Country/Sub-region
- 13.1.1 China
- 13.1.2 Japan
- 13.1.3 India
- 13.1.4 South Korea
- 13.1.5 Southeast Asia
- 13.1.6 Australia
- 13.1.7 Indonesia
- 13.1.8 Phillipes
- 13.1.9 Singapore
- 13.1.10 Thailandc
- 13.1.11 Rest of Asia Pacific
- 14. South America Oil & Gas Automation Industry Analysis, Insights and Forecast, 2019-2031
- 14.1. Market Analysis, Insights and Forecast - By Country/Sub-region
- 14.1.1 Brazil
- 14.1.2 Argentina
- 14.1.3 Peru
- 14.1.4 Chile
- 14.1.5 Colombia
- 14.1.6 Ecuador
- 14.1.7 Venezuela
- 14.1.8 Rest of South America
- 15. North America Oil & Gas Automation Industry Analysis, Insights and Forecast, 2019-2031
- 15.1. Market Analysis, Insights and Forecast - By Country/Sub-region
- 15.1.1 United States
- 15.1.2 Canada
- 15.1.3 Mexico
- 16. MEA Oil & Gas Automation Industry Analysis, Insights and Forecast, 2019-2031
- 16.1. Market Analysis, Insights and Forecast - By Country/Sub-region
- 16.1.1 United Arab Emirates
- 16.1.2 Saudi Arabia
- 16.1.3 South Africa
- 16.1.4 Rest of Middle East and Africa
- 17. Competitive Analysis
- 17.1. Global Market Share Analysis 2024
- 17.2. Company Profiles
- 17.2.1 Mitsubishi Corporation
- 17.2.1.1. Overview
- 17.2.1.2. Products
- 17.2.1.3. SWOT Analysis
- 17.2.1.4. Recent Developments
- 17.2.1.5. Financials (Based on Availability)
- 17.2.2 Honeywell International Inc
- 17.2.2.1. Overview
- 17.2.2.2. Products
- 17.2.2.3. SWOT Analysis
- 17.2.2.4. Recent Developments
- 17.2.2.5. Financials (Based on Availability)
- 17.2.3 ABB Ltd
- 17.2.3.1. Overview
- 17.2.3.2. Products
- 17.2.3.3. SWOT Analysis
- 17.2.3.4. Recent Developments
- 17.2.3.5. Financials (Based on Availability)
- 17.2.4 Texas Instruments Inc
- 17.2.4.1. Overview
- 17.2.4.2. Products
- 17.2.4.3. SWOT Analysis
- 17.2.4.4. Recent Developments
- 17.2.4.5. Financials (Based on Availability)
- 17.2.5 Emerson Electric Co
- 17.2.5.1. Overview
- 17.2.5.2. Products
- 17.2.5.3. SWOT Analysis
- 17.2.5.4. Recent Developments
- 17.2.5.5. Financials (Based on Availability)
- 17.2.6 Schneider Electric SE
- 17.2.6.1. Overview
- 17.2.6.2. Products
- 17.2.6.3. SWOT Analysis
- 17.2.6.4. Recent Developments
- 17.2.6.5. Financials (Based on Availability)
- 17.2.7 Siemens Corporation
- 17.2.7.1. Overview
- 17.2.7.2. Products
- 17.2.7.3. SWOT Analysis
- 17.2.7.4. Recent Developments
- 17.2.7.5. Financials (Based on Availability)
- 17.2.8 Johnson Controls Inc
- 17.2.8.1. Overview
- 17.2.8.2. Products
- 17.2.8.3. SWOT Analysis
- 17.2.8.4. Recent Developments
- 17.2.8.5. Financials (Based on Availability)
- 17.2.9 Robert Bosch GmbH
- 17.2.9.1. Overview
- 17.2.9.2. Products
- 17.2.9.3. SWOT Analysis
- 17.2.9.4. Recent Developments
- 17.2.9.5. Financials (Based on Availability)
- 17.2.10 Dassault Systèmes SE
- 17.2.10.1. Overview
- 17.2.10.2. Products
- 17.2.10.3. SWOT Analysis
- 17.2.10.4. Recent Developments
- 17.2.10.5. Financials (Based on Availability)
- 17.2.11 Rockwell Automation Inc
- 17.2.11.1. Overview
- 17.2.11.2. Products
- 17.2.11.3. SWOT Analysis
- 17.2.11.4. Recent Developments
- 17.2.11.5. Financials (Based on Availability)
- 17.2.12 Yokogawa Electric Corporation
- 17.2.12.1. Overview
- 17.2.12.2. Products
- 17.2.12.3. SWOT Analysis
- 17.2.12.4. Recent Developments
- 17.2.12.5. Financials (Based on Availability)
- 17.2.13 Eaton Corporation
- 17.2.13.1. Overview
- 17.2.13.2. Products
- 17.2.13.3. SWOT Analysis
- 17.2.13.4. Recent Developments
- 17.2.13.5. Financials (Based on Availability)
- 17.2.1 Mitsubishi Corporation
List of Figures
- Figure 1: Global Oil & Gas Automation Industry Revenue Breakdown (Million, %) by Region 2024 & 2032
- Figure 2: North America Oil & Gas Automation Industry Revenue (Million), by Country 2024 & 2032
- Figure 3: North America Oil & Gas Automation Industry Revenue Share (%), by Country 2024 & 2032
- Figure 4: Europe Oil & Gas Automation Industry Revenue (Million), by Country 2024 & 2032
- Figure 5: Europe Oil & Gas Automation Industry Revenue Share (%), by Country 2024 & 2032
- Figure 6: Asia Pacific Oil & Gas Automation Industry Revenue (Million), by Country 2024 & 2032
- Figure 7: Asia Pacific Oil & Gas Automation Industry Revenue Share (%), by Country 2024 & 2032
- Figure 8: South America Oil & Gas Automation Industry Revenue (Million), by Country 2024 & 2032
- Figure 9: South America Oil & Gas Automation Industry Revenue Share (%), by Country 2024 & 2032
- Figure 10: North America Oil & Gas Automation Industry Revenue (Million), by Country 2024 & 2032
- Figure 11: North America Oil & Gas Automation Industry Revenue Share (%), by Country 2024 & 2032
- Figure 12: MEA Oil & Gas Automation Industry Revenue (Million), by Country 2024 & 2032
- Figure 13: MEA Oil & Gas Automation Industry Revenue Share (%), by Country 2024 & 2032
- Figure 14: North America Oil & Gas Automation Industry Revenue (Million), by Process 2024 & 2032
- Figure 15: North America Oil & Gas Automation Industry Revenue Share (%), by Process 2024 & 2032
- Figure 16: North America Oil & Gas Automation Industry Revenue (Million), by Technology 2024 & 2032
- Figure 17: North America Oil & Gas Automation Industry Revenue Share (%), by Technology 2024 & 2032
- Figure 18: North America Oil & Gas Automation Industry Revenue (Million), by Country 2024 & 2032
- Figure 19: North America Oil & Gas Automation Industry Revenue Share (%), by Country 2024 & 2032
- Figure 20: Europe Oil & Gas Automation Industry Revenue (Million), by Process 2024 & 2032
- Figure 21: Europe Oil & Gas Automation Industry Revenue Share (%), by Process 2024 & 2032
- Figure 22: Europe Oil & Gas Automation Industry Revenue (Million), by Technology 2024 & 2032
- Figure 23: Europe Oil & Gas Automation Industry Revenue Share (%), by Technology 2024 & 2032
- Figure 24: Europe Oil & Gas Automation Industry Revenue (Million), by Country 2024 & 2032
- Figure 25: Europe Oil & Gas Automation Industry Revenue Share (%), by Country 2024 & 2032
- Figure 26: Asia Pacific Oil & Gas Automation Industry Revenue (Million), by Process 2024 & 2032
- Figure 27: Asia Pacific Oil & Gas Automation Industry Revenue Share (%), by Process 2024 & 2032
- Figure 28: Asia Pacific Oil & Gas Automation Industry Revenue (Million), by Technology 2024 & 2032
- Figure 29: Asia Pacific Oil & Gas Automation Industry Revenue Share (%), by Technology 2024 & 2032
- Figure 30: Asia Pacific Oil & Gas Automation Industry Revenue (Million), by Country 2024 & 2032
- Figure 31: Asia Pacific Oil & Gas Automation Industry Revenue Share (%), by Country 2024 & 2032
- Figure 32: Latin America Oil & Gas Automation Industry Revenue (Million), by Process 2024 & 2032
- Figure 33: Latin America Oil & Gas Automation Industry Revenue Share (%), by Process 2024 & 2032
- Figure 34: Latin America Oil & Gas Automation Industry Revenue (Million), by Technology 2024 & 2032
- Figure 35: Latin America Oil & Gas Automation Industry Revenue Share (%), by Technology 2024 & 2032
- Figure 36: Latin America Oil & Gas Automation Industry Revenue (Million), by Country 2024 & 2032
- Figure 37: Latin America Oil & Gas Automation Industry Revenue Share (%), by Country 2024 & 2032
- Figure 38: Middle East and Africa Oil & Gas Automation Industry Revenue (Million), by Process 2024 & 2032
- Figure 39: Middle East and Africa Oil & Gas Automation Industry Revenue Share (%), by Process 2024 & 2032
- Figure 40: Middle East and Africa Oil & Gas Automation Industry Revenue (Million), by Technology 2024 & 2032
- Figure 41: Middle East and Africa Oil & Gas Automation Industry Revenue Share (%), by Technology 2024 & 2032
- Figure 42: Middle East and Africa Oil & Gas Automation Industry Revenue (Million), by Country 2024 & 2032
- Figure 43: Middle East and Africa Oil & Gas Automation Industry Revenue Share (%), by Country 2024 & 2032
List of Tables
- Table 1: Global Oil & Gas Automation Industry Revenue Million Forecast, by Region 2019 & 2032
- Table 2: Global Oil & Gas Automation Industry Revenue Million Forecast, by Process 2019 & 2032
- Table 3: Global Oil & Gas Automation Industry Revenue Million Forecast, by Technology 2019 & 2032
- Table 4: Global Oil & Gas Automation Industry Revenue Million Forecast, by Region 2019 & 2032
- Table 5: Global Oil & Gas Automation Industry Revenue Million Forecast, by Country 2019 & 2032
- Table 6: United States Oil & Gas Automation Industry Revenue (Million) Forecast, by Application 2019 & 2032
- Table 7: Canada Oil & Gas Automation Industry Revenue (Million) Forecast, by Application 2019 & 2032
- Table 8: Mexico Oil & Gas Automation Industry Revenue (Million) Forecast, by Application 2019 & 2032
- Table 9: Global Oil & Gas Automation Industry Revenue Million Forecast, by Country 2019 & 2032
- Table 10: Germany Oil & Gas Automation Industry Revenue (Million) Forecast, by Application 2019 & 2032
- Table 11: United Kingdom Oil & Gas Automation Industry Revenue (Million) Forecast, by Application 2019 & 2032
- Table 12: France Oil & Gas Automation Industry Revenue (Million) Forecast, by Application 2019 & 2032
- Table 13: Spain Oil & Gas Automation Industry Revenue (Million) Forecast, by Application 2019 & 2032
- Table 14: Italy Oil & Gas Automation Industry Revenue (Million) Forecast, by Application 2019 & 2032
- Table 15: Spain Oil & Gas Automation Industry Revenue (Million) Forecast, by Application 2019 & 2032
- Table 16: Belgium Oil & Gas Automation Industry Revenue (Million) Forecast, by Application 2019 & 2032
- Table 17: Netherland Oil & Gas Automation Industry Revenue (Million) Forecast, by Application 2019 & 2032
- Table 18: Nordics Oil & Gas Automation Industry Revenue (Million) Forecast, by Application 2019 & 2032
- Table 19: Rest of Europe Oil & Gas Automation Industry Revenue (Million) Forecast, by Application 2019 & 2032
- Table 20: Global Oil & Gas Automation Industry Revenue Million Forecast, by Country 2019 & 2032
- Table 21: China Oil & Gas Automation Industry Revenue (Million) Forecast, by Application 2019 & 2032
- Table 22: Japan Oil & Gas Automation Industry Revenue (Million) Forecast, by Application 2019 & 2032
- Table 23: India Oil & Gas Automation Industry Revenue (Million) Forecast, by Application 2019 & 2032
- Table 24: South Korea Oil & Gas Automation Industry Revenue (Million) Forecast, by Application 2019 & 2032
- Table 25: Southeast Asia Oil & Gas Automation Industry Revenue (Million) Forecast, by Application 2019 & 2032
- Table 26: Australia Oil & Gas Automation Industry Revenue (Million) Forecast, by Application 2019 & 2032
- Table 27: Indonesia Oil & Gas Automation Industry Revenue (Million) Forecast, by Application 2019 & 2032
- Table 28: Phillipes Oil & Gas Automation Industry Revenue (Million) Forecast, by Application 2019 & 2032
- Table 29: Singapore Oil & Gas Automation Industry Revenue (Million) Forecast, by Application 2019 & 2032
- Table 30: Thailandc Oil & Gas Automation Industry Revenue (Million) Forecast, by Application 2019 & 2032
- Table 31: Rest of Asia Pacific Oil & Gas Automation Industry Revenue (Million) Forecast, by Application 2019 & 2032
- Table 32: Global Oil & Gas Automation Industry Revenue Million Forecast, by Country 2019 & 2032
- Table 33: Brazil Oil & Gas Automation Industry Revenue (Million) Forecast, by Application 2019 & 2032
- Table 34: Argentina Oil & Gas Automation Industry Revenue (Million) Forecast, by Application 2019 & 2032
- Table 35: Peru Oil & Gas Automation Industry Revenue (Million) Forecast, by Application 2019 & 2032
- Table 36: Chile Oil & Gas Automation Industry Revenue (Million) Forecast, by Application 2019 & 2032
- Table 37: Colombia Oil & Gas Automation Industry Revenue (Million) Forecast, by Application 2019 & 2032
- Table 38: Ecuador Oil & Gas Automation Industry Revenue (Million) Forecast, by Application 2019 & 2032
- Table 39: Venezuela Oil & Gas Automation Industry Revenue (Million) Forecast, by Application 2019 & 2032
- Table 40: Rest of South America Oil & Gas Automation Industry Revenue (Million) Forecast, by Application 2019 & 2032
- Table 41: Global Oil & Gas Automation Industry Revenue Million Forecast, by Country 2019 & 2032
- Table 42: United States Oil & Gas Automation Industry Revenue (Million) Forecast, by Application 2019 & 2032
- Table 43: Canada Oil & Gas Automation Industry Revenue (Million) Forecast, by Application 2019 & 2032
- Table 44: Mexico Oil & Gas Automation Industry Revenue (Million) Forecast, by Application 2019 & 2032
- Table 45: Global Oil & Gas Automation Industry Revenue Million Forecast, by Country 2019 & 2032
- Table 46: United Arab Emirates Oil & Gas Automation Industry Revenue (Million) Forecast, by Application 2019 & 2032
- Table 47: Saudi Arabia Oil & Gas Automation Industry Revenue (Million) Forecast, by Application 2019 & 2032
- Table 48: South Africa Oil & Gas Automation Industry Revenue (Million) Forecast, by Application 2019 & 2032
- Table 49: Rest of Middle East and Africa Oil & Gas Automation Industry Revenue (Million) Forecast, by Application 2019 & 2032
- Table 50: Global Oil & Gas Automation Industry Revenue Million Forecast, by Process 2019 & 2032
- Table 51: Global Oil & Gas Automation Industry Revenue Million Forecast, by Technology 2019 & 2032
- Table 52: Global Oil & Gas Automation Industry Revenue Million Forecast, by Country 2019 & 2032
- Table 53: United States Oil & Gas Automation Industry Revenue (Million) Forecast, by Application 2019 & 2032
- Table 54: Canada Oil & Gas Automation Industry Revenue (Million) Forecast, by Application 2019 & 2032
- Table 55: Global Oil & Gas Automation Industry Revenue Million Forecast, by Process 2019 & 2032
- Table 56: Global Oil & Gas Automation Industry Revenue Million Forecast, by Technology 2019 & 2032
- Table 57: Global Oil & Gas Automation Industry Revenue Million Forecast, by Country 2019 & 2032
- Table 58: United Kingdom Oil & Gas Automation Industry Revenue (Million) Forecast, by Application 2019 & 2032
- Table 59: Germany Oil & Gas Automation Industry Revenue (Million) Forecast, by Application 2019 & 2032
- Table 60: France Oil & Gas Automation Industry Revenue (Million) Forecast, by Application 2019 & 2032
- Table 61: Rest of Europe Oil & Gas Automation Industry Revenue (Million) Forecast, by Application 2019 & 2032
- Table 62: Global Oil & Gas Automation Industry Revenue Million Forecast, by Process 2019 & 2032
- Table 63: Global Oil & Gas Automation Industry Revenue Million Forecast, by Technology 2019 & 2032
- Table 64: Global Oil & Gas Automation Industry Revenue Million Forecast, by Country 2019 & 2032
- Table 65: China Oil & Gas Automation Industry Revenue (Million) Forecast, by Application 2019 & 2032
- Table 66: India Oil & Gas Automation Industry Revenue (Million) Forecast, by Application 2019 & 2032
- Table 67: Japan Oil & Gas Automation Industry Revenue (Million) Forecast, by Application 2019 & 2032
- Table 68: Rest of Asia Pacific Oil & Gas Automation Industry Revenue (Million) Forecast, by Application 2019 & 2032
- Table 69: Global Oil & Gas Automation Industry Revenue Million Forecast, by Process 2019 & 2032
- Table 70: Global Oil & Gas Automation Industry Revenue Million Forecast, by Technology 2019 & 2032
- Table 71: Global Oil & Gas Automation Industry Revenue Million Forecast, by Country 2019 & 2032
- Table 72: Global Oil & Gas Automation Industry Revenue Million Forecast, by Process 2019 & 2032
- Table 73: Global Oil & Gas Automation Industry Revenue Million Forecast, by Technology 2019 & 2032
- Table 74: Global Oil & Gas Automation Industry Revenue Million Forecast, by Country 2019 & 2032
Frequently Asked Questions
1. What is the projected Compound Annual Growth Rate (CAGR) of the Oil & Gas Automation Industry?
The projected CAGR is approximately 5.90%.
2. Which companies are prominent players in the Oil & Gas Automation Industry?
Key companies in the market include Mitsubishi Corporation, Honeywell International Inc, ABB Ltd, Texas Instruments Inc, Emerson Electric Co, Schneider Electric SE, Siemens Corporation, Johnson Controls Inc, Robert Bosch GmbH, Dassault Systèmes SE, Rockwell Automation Inc, Yokogawa Electric Corporation, Eaton Corporation.
3. What are the main segments of the Oil & Gas Automation Industry?
The market segments include Process, Technology .
4. Can you provide details about the market size?
The market size is estimated to be USD XX Million as of 2022.
5. What are some drivers contributing to market growth?
Growth of Industrial & Infrastructural Activities in Developing Economies; Increasing Oil Consumption; Increasing Scarcity of Skilled Workers; Increase in Demand from the Oil & Gas Industry.
6. What are the notable trends driving market growth?
Variable Frequency Drives to Have Significant Share.
7. Are there any restraints impacting market growth?
Relatively High Deployment Costs; Complex Design compared to Traditional Sensors.
8. Can you provide examples of recent developments in the market?
June 2022: GE Digital unveiled its innovative Accelerator product line, which includes best-in-class computer solutions to enable customers in asset-intensive power industries to quickly set up Asset Performance Management (APM) and other services. GE Digital Accelerators are intended to reduce time to value, extend APM to a broader variety of assets, and assist organizations in gaining financial benefits at their locations and throughout the enterprise.
9. What pricing options are available for accessing the report?
Pricing options include single-user, multi-user, and enterprise licenses priced at USD 4750, USD 5250, and USD 8750 respectively.
10. Is the market size provided in terms of value or volume?
The market size is provided in terms of value, measured in Million.
11. Are there any specific market keywords associated with the report?
Yes, the market keyword associated with the report is "Oil & Gas Automation Industry," which aids in identifying and referencing the specific market segment covered.
12. How do I determine which pricing option suits my needs best?
The pricing options vary based on user requirements and access needs. Individual users may opt for single-user licenses, while businesses requiring broader access may choose multi-user or enterprise licenses for cost-effective access to the report.
13. Are there any additional resources or data provided in the Oil & Gas Automation Industry report?
While the report offers comprehensive insights, it's advisable to review the specific contents or supplementary materials provided to ascertain if additional resources or data are available.
14. How can I stay updated on further developments or reports in the Oil & Gas Automation Industry?
To stay informed about further developments, trends, and reports in the Oil & Gas Automation Industry, consider subscribing to industry newsletters, following relevant companies and organizations, or regularly checking reputable industry news sources and publications.
Methodology
Step 1 - Identification of Relevant Samples Size from Population Database


Step 2 - Approaches for Defining Global Market Size (Value, Volume* & Price*)

Note*: In applicable scenarios
Step 3 - Data Sources
Primary Research
- Web Analytics
- Survey Reports
- Research Institute
- Latest Research Reports
- Opinion Leaders
Secondary Research
- Annual Reports
- White Paper
- Latest Press Release
- Industry Association
- Paid Database
- Investor Presentations

Step 4 - Data Triangulation
Involves using different sources of information in order to increase the validity of a study
These sources are likely to be stakeholders in a program - participants, other researchers, program staff, other community members, and so on.
Then we put all data in single framework & apply various statistical tools to find out the dynamic on the market.
During the analysis stage, feedback from the stakeholder groups would be compared to determine areas of agreement as well as areas of divergence


