Key Insights
The Global Smart Plug Market is poised for substantial expansion, projected to reach a market size of $3.2 billion by 2025, with a Compound Annual Growth Rate (CAGR) of 8.3%. This growth is driven by rising smart home device adoption, underscored by the convenience, energy savings, and advanced control smart plugs provide. Growing environmental consciousness and the pursuit of reduced electricity consumption are key market drivers. The expansion of the Internet of Things (IoT) landscape and advancements in connectivity technologies, including Bluetooth and Wi-Fi, are broadening smart plug applications beyond residential use, with industrial and commercial sectors increasingly leveraging them for automation, remote monitoring, and optimized energy management.
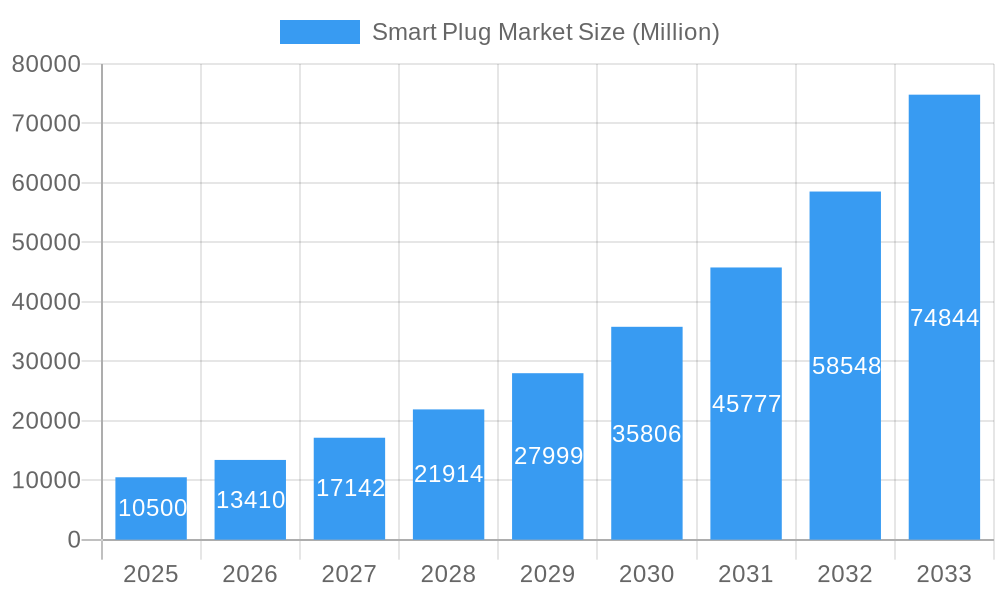
Smart Plug Market Market Size (In Billion)
Key market trends include the seamless integration of voice control via smart assistants, enhancing user interaction and demand. Technological advancements are leading to more compact and affordable smart plugs, increasing accessibility. Enhanced security protocols and energy monitoring features are becoming standard, addressing consumer concerns and adding value. Challenges include data privacy and cybersecurity concerns, alongside initial adoption costs, particularly in emerging markets. Despite these hurdles, the significant market size, robust CAGR, and diverse applications across residential, commercial, and industrial sectors, supported by leading companies such as Etekcity Corporation, Wipro Limited, and Xiaomi Inc., indicate a dynamic and promising market. North America and Europe are anticipated to dominate adoption, with Asia representing a substantial growth opportunity.
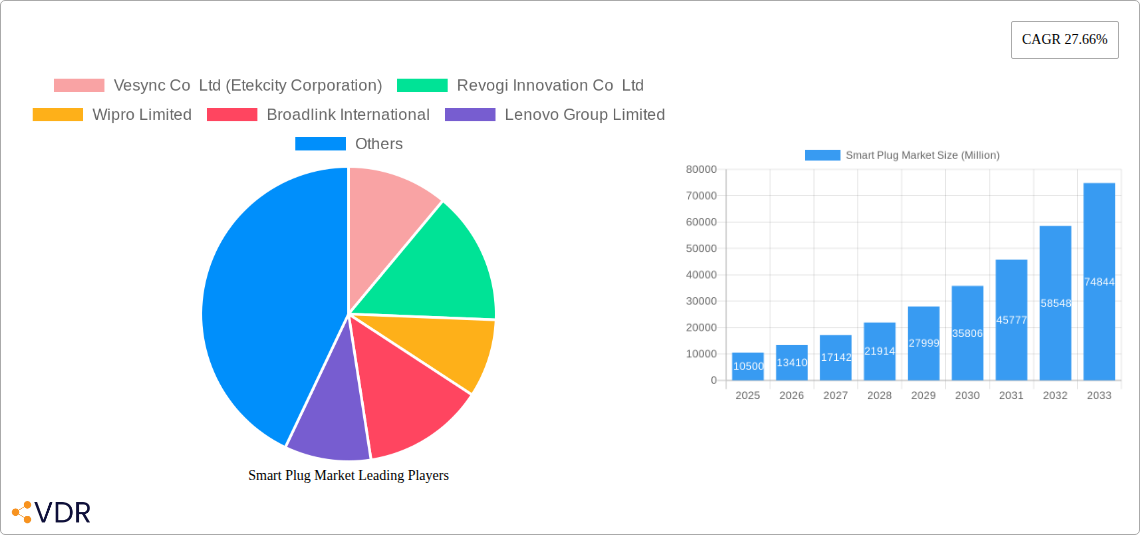
Smart Plug Market Company Market Share
Comprehensive Smart Plug Market Report: Growth, Trends, and Competitive Landscape (2019-2033)
This in-depth report delivers a robust analysis of the global Smart Plug Market, offering unparalleled insights into its current dynamics, projected growth, and competitive ecosystem. Covering the historical period from 2019 to 2024, with a base year of 2025 and a forecast period extending to 2033, this report is your definitive guide to understanding the evolution of smart home connectivity. We meticulously examine market segmentation by technology (Bluetooth, Wi-Fi) and application (Industrial Use, Commercial Use, Household Use), alongside key industry developments that are reshaping the landscape. With projected market values presented in Million units, this report is essential for strategists, investors, product developers, and market analysts seeking to capitalize on the burgeoning smart plug market.
Smart Plug Market Market Dynamics & Structure
The Smart Plug Market exhibits a dynamic and evolving structure, driven by rapid technological advancements and increasing consumer adoption of smart home solutions. Market concentration is moderately fragmented, with key players investing heavily in R&D and strategic acquisitions to expand their product portfolios and global reach. Technological innovation remains a primary driver, with constant improvements in connectivity, energy management features, and interoperability. Regulatory frameworks, while still developing, are increasingly focused on data privacy and security standards for smart devices, influencing product development and market entry strategies. Competitive product substitutes include smart power strips, integrated smart outlets, and advanced home automation systems that incorporate plug control functionalities. End-user demographics are broad, spanning tech-savvy millennials and Gen Z, as well as older demographics seeking convenience and energy savings. Merger and acquisition trends are active as larger tech companies seek to consolidate their presence in the growing smart home ecosystem.
- Market Concentration: Moderately fragmented, with significant influence from both established electronics giants and agile smart home specialists.
- Technological Innovation Drivers: Enhanced energy monitoring, voice assistant integration, Matter protocol adoption, and miniaturization of components.
- Regulatory Frameworks: Focus on cybersecurity, data privacy (e.g., GDPR, CCPA), and interoperability standards.
- Competitive Product Substitutes: Smart power strips, smart home hubs, integrated smart building systems.
- End-User Demographics: Homeowners, renters, small business owners, industrial facility managers.
- M&A Trends: Strategic acquisitions to gain market share, access new technologies, and expand product offerings.
Smart Plug Market Growth Trends & Insights
The Smart Plug Market is poised for substantial expansion, fueled by increasing consumer demand for convenience, energy efficiency, and sophisticated home automation. The market size is projected to witness a significant upward trajectory, transitioning from XX Million units in the historical period to an estimated XX Million units by 2025 and further expanding to XX Million units by 2033. Adoption rates are accelerating globally, driven by the decreasing cost of smart devices and greater awareness of their benefits. Technological disruptions, such as the widespread adoption of the Matter protocol, are fostering greater interoperability and simplifying user experiences, thereby encouraging wider adoption. Consumer behavior shifts are characterized by a growing preference for remote control and monitoring of home appliances, personalized automation routines, and proactive energy management. The average annual growth rate (CAGR) for the Smart Plug Market is estimated to be a robust XX% during the forecast period (2025-2033). Market penetration, particularly within developed economies, is expected to reach XX% by 2030, presenting a vast opportunity for market players. The increasing integration of smart plugs into broader smart home ecosystems, coupled with the rise of the Internet of Things (IoT), further solidifies their position as an indispensable component of modern living and working spaces.
Dominant Regions, Countries, or Segments in Smart Plug Market
The Wi-Fi technology segment currently dominates the Smart Plug Market, driven by its widespread availability, established infrastructure, and superior range compared to Bluetooth. This dominance is further propelled by its seamless integration with existing home networks, enabling effortless connectivity and control of smart plugs via smartphones and other internet-connected devices. The Household Use application segment also holds a commanding position, reflecting the burgeoning adoption of smart home technologies by consumers seeking enhanced convenience, security, and energy savings.
Wi-Fi Dominance Factors:
- Ubiquitous Infrastructure: Nearly all modern households and commercial spaces have Wi-Fi networks, reducing barriers to entry for smart plug adoption.
- Extended Range: Wi-Fi offers a greater operational range compared to Bluetooth, allowing users to control devices from anywhere within their home or even remotely via the internet.
- High Bandwidth: Supports more complex functionalities and data transfer for advanced features like real-time energy monitoring and firmware updates.
- Integration with Ecosystems: Easily integrates with popular voice assistants like Amazon Alexa and Google Assistant, further enhancing user experience.
- Market Share: Wi-Fi-based smart plugs are estimated to hold approximately XX% of the market share in terms of units sold.
Household Use Segment Dominance Factors:
- Consumer Demand for Convenience: Users are increasingly seeking to automate routine tasks, such as turning lights on/off, controlling appliances, and creating schedules.
- Energy Efficiency: Smart plugs enable users to monitor and reduce energy consumption, leading to cost savings and environmental benefits.
- Enhanced Security: Remote control and scheduling can simulate occupancy, deterring potential intruders.
- Growing Smart Home Adoption: As more smart home devices enter the market, the demand for complementary products like smart plugs escalates.
- Market Share: The household segment is projected to account for approximately XX% of the total smart plug market.
While Wi-Fi and Household Use lead, Bluetooth smart plugs are gaining traction for their lower power consumption and cost-effectiveness in localized applications. Industrial and Commercial Use segments, though smaller, present significant growth potential with the increasing demand for smart building management and industrial automation solutions. Economic policies promoting smart city initiatives and energy-efficient infrastructure further bolster the growth of these segments, particularly in regions like North America and Europe, which exhibit high disposable incomes and a strong inclination towards technological adoption.
Smart Plug Market Product Landscape
The Smart Plug Market is characterized by continuous product innovation, offering a diverse range of functionalities and applications. Key innovations include enhanced energy monitoring capabilities, advanced scheduling options, and seamless integration with popular voice assistants. Products are designed for intuitive setup and user-friendly operation, catering to both tech-savvy consumers and those new to smart home technology. Unique selling propositions often revolve around energy-saving features, remote control accessibility, and compatibility with broader smart home ecosystems. Technological advancements focus on smaller form factors, improved reliability, and enhanced security protocols.
Key Drivers, Barriers & Challenges in Smart Plug Market
Key Drivers:
- Growing adoption of smart home ecosystems: The increasing popularity of interconnected smart devices creates a strong demand for compatible accessories like smart plugs.
- Demand for energy efficiency and cost savings: Consumers are increasingly aware of energy consumption and seek smart solutions to reduce electricity bills.
- Advancements in IoT technology: The continuous evolution of the Internet of Things infrastructure enables more sophisticated and reliable smart plug functionalities.
- Government initiatives promoting smart cities and energy conservation: Supportive policies and incentives drive the adoption of smart home technologies.
Barriers & Challenges:
- Cybersecurity concerns: Potential vulnerabilities in smart devices can lead to data breaches and unauthorized access, hindering consumer trust.
- Interoperability issues: Lack of universal standards can create fragmentation and difficulty in integrating devices from different manufacturers.
- High initial cost: For some consumers, the upfront investment in smart plugs and associated smart home systems can be a deterrent.
- Complexity of setup and use: While improving, some smart plug installations and configurations can still be perceived as challenging by less tech-literate individuals.
- Supply chain disruptions: Global supply chain issues can impact manufacturing and product availability, leading to price fluctuations.
Emerging Opportunities in Smart Plug Market
Emerging opportunities in the Smart Plug Market lie in the expansion of applications beyond traditional household use. The industrial sector presents a significant untapped market, with smart plugs enabling remote monitoring and control of machinery, optimising operational efficiency and predictive maintenance. In commercial settings, smart plugs can be leveraged for intelligent lighting control, energy management in offices, and enhancing guest experiences in the hospitality sector. Evolving consumer preferences indicate a growing demand for smart plugs with integrated features like ambient light sensing, occupancy detection, and advanced voice control capabilities. Furthermore, the development of more affordable and feature-rich smart plugs targeted at emerging economies will unlock substantial growth potential.
Growth Accelerators in the Smart Plug Market Industry
Growth in the Smart Plug Market is being significantly accelerated by several key factors. The ongoing innovation in connectivity protocols, such as the increasing adoption of the Matter standard, is fostering greater interoperability and simplifying the user experience, thereby boosting adoption rates. Strategic partnerships between smart plug manufacturers and major smart home platform providers are expanding market reach and brand visibility. Furthermore, the continuous reduction in manufacturing costs due to economies of scale and technological advancements is making smart plugs more accessible to a broader consumer base. The growing trend of retrofitting existing homes with smart technology, rather than solely focusing on new constructions, also acts as a substantial growth accelerator.
Key Players Shaping the Smart Plug Market Market
- Vesync Co Ltd (Etekcity Corporation)
- Revogi Innovation Co Ltd
- Wipro Limited
- Broadlink International
- Lenovo Group Limited
- Belkin International Inc
- Leviton Manufacturing Co Inc
- Shenzhen Tenda Technology Co Ltd
- Xiaomi Inc
- Ankuoo Electronics Inc
- TP-Link Technologies Co Ltd
- EDIMAX Technology Co Ltd
- D-Link Corporation
- Panasonic Holdings Corporation
- Sariana LLC (Satechi)
Notable Milestones in Smart Plug Market Sector
- January 2023: TP-Link launched new products under its Tapo range of smart home gadgets at CES 2023, including a smart hub, robot vacuums, cameras, a doorbell camera, and a smart video door lock. The company also unveiled its first smart plugs, switches, outlet extenders, and bulbs certified by Matter, demonstrating a commitment to making smart home technology more approachable and user-friendly through the Matter protocol for its Tapo and Kasa brands.
- November 2022: Smarteefi invested capital to introduce a new product, the 16A Wi-Fi smart plug, to its line of smart switches. This model features the world's first built-in clock system, making it independent of the internet clock cycle and offering unique features such as an assured schedule, a guaranteed countdown timer, and more accurate daily/real-time energy monitoring.
In-Depth Smart Plug Market Market Outlook
The Smart Plug Market is set for sustained and robust growth, driven by an overarching trend towards smarter, more connected living and working environments. Key growth accelerators include the increasing ubiquity of Wi-Fi networks, the continued advancements in IoT technology, and the growing consumer demand for convenience and energy efficiency. Strategic partnerships and the widespread adoption of interoperability standards like Matter will further simplify integration and expand market reach. The outlook suggests a significant expansion in both the volume of smart plugs sold and the sophistication of their functionalities, moving beyond basic on/off control to advanced automation and data-driven insights. Emerging markets and evolving consumer preferences for personalized smart home experiences present substantial strategic opportunities for market players to innovate and capture value.
Smart Plug Market Segmentation
-
1. Technology
- 1.1. Bluetooth
- 1.2. Wi-Fi
-
2. Application
- 2.1. Industrial Use
- 2.2. Commercial Use
- 2.3. Household Use
Smart Plug Market Segmentation By Geography
- 1. North America
- 2. Europe
- 3. Asia
- 4. Latin America
- 5. Middle East and Africa
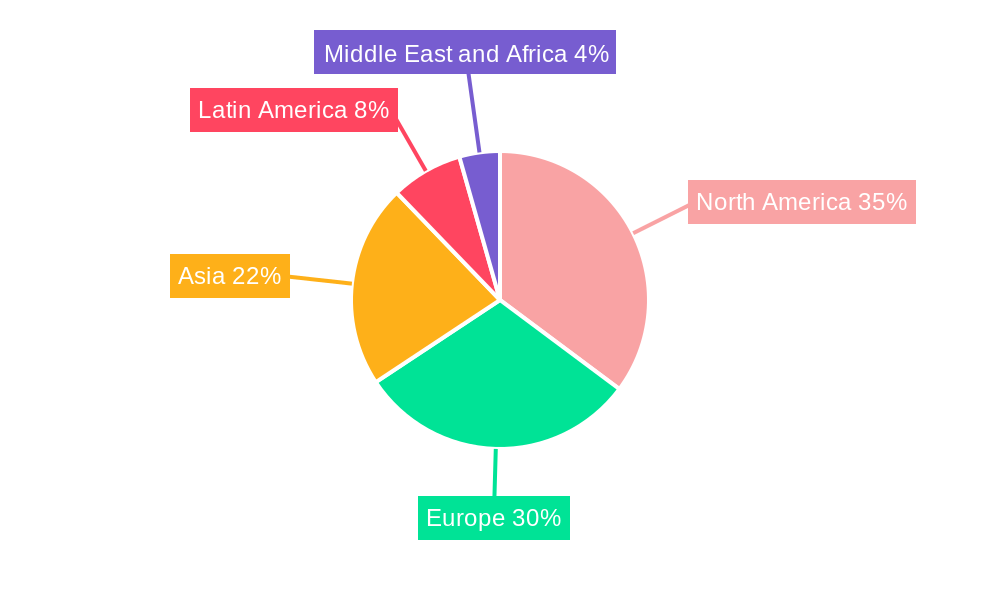
Smart Plug Market Regional Market Share
Geographic Coverage of Smart Plug Market
Smart Plug Market REPORT HIGHLIGHTS
| Aspects | Details |
|---|---|
| Study Period | 2020-2034 |
| Base Year | 2025 |
| Estimated Year | 2026 |
| Forecast Period | 2026-2034 |
| Historical Period | 2020-2025 |
| Growth Rate | CAGR of 8.3% from 2020-2034 |
| Segmentation |
|
Table of Contents
- 1. Introduction
- 1.1. Research Scope
- 1.2. Market Segmentation
- 1.3. Research Objective
- 1.4. Definitions and Assumptions
- 2. Executive Summary
- 2.1. Market Snapshot
- 3. Market Dynamics
- 3.1. Market Drivers
- 3.2. Market Restrains
- 3.3. Market Trends
- 3.4. Market Opportunities
- 4. Market Factor Analysis
- 4.1. Porters Five Forces
- 4.1.1. Bargaining Power of Suppliers
- 4.1.2. Bargaining Power of Buyers
- 4.1.3. Threat of New Entrants
- 4.1.4. Threat of Substitutes
- 4.1.5. Competitive Rivalry
- 4.2. PESTEL analysis
- 4.3. BCG Analysis
- 4.3.1. Stars (High Growth, High Market Share)
- 4.3.2. Cash Cows (Low Growth, High Market Share)
- 4.3.3. Question Mark (High Growth, Low Market Share)
- 4.3.4. Dogs (Low Growth, Low Market Share)
- 4.4. Ansoff Matrix Analysis
- 4.5. Supply Chain Analysis
- 4.6. Regulatory Landscape
- 4.7. Current Market Potential and Opportunity Assessment (TAM–SAM–SOM Framework)
- 4.8. VDR Analyst Note
- 4.1. Porters Five Forces
- 5. Market Analysis, Insights and Forecast 2021-2033
- 5.1. Market Analysis, Insights and Forecast - by Technology
- 5.1.1. Bluetooth
- 5.1.2. Wi-Fi
- 5.2. Market Analysis, Insights and Forecast - by Application
- 5.2.1. Industrial Use
- 5.2.2. Commercial Use
- 5.2.3. Household Use
- 5.3. Market Analysis, Insights and Forecast - by Region
- 5.3.1. North America
- 5.3.2. Europe
- 5.3.3. Asia
- 5.3.4. Latin America
- 5.3.5. Middle East and Africa
- 5.1. Market Analysis, Insights and Forecast - by Technology
- 6. Global Smart Plug Market Analysis, Insights and Forecast, 2021-2033
- 6.1. Market Analysis, Insights and Forecast - by Technology
- 6.1.1. Bluetooth
- 6.1.2. Wi-Fi
- 6.2. Market Analysis, Insights and Forecast - by Application
- 6.2.1. Industrial Use
- 6.2.2. Commercial Use
- 6.2.3. Household Use
- 6.1. Market Analysis, Insights and Forecast - by Technology
- 7. North America Smart Plug Market Analysis, Insights and Forecast, 2021-2033
- 7.1. Market Analysis, Insights and Forecast - by Technology
- 7.1.1. Bluetooth
- 7.1.2. Wi-Fi
- 7.2. Market Analysis, Insights and Forecast - by Application
- 7.2.1. Industrial Use
- 7.2.2. Commercial Use
- 7.2.3. Household Use
- 7.1. Market Analysis, Insights and Forecast - by Technology
- 8. Europe Smart Plug Market Analysis, Insights and Forecast, 2021-2033
- 8.1. Market Analysis, Insights and Forecast - by Technology
- 8.1.1. Bluetooth
- 8.1.2. Wi-Fi
- 8.2. Market Analysis, Insights and Forecast - by Application
- 8.2.1. Industrial Use
- 8.2.2. Commercial Use
- 8.2.3. Household Use
- 8.1. Market Analysis, Insights and Forecast - by Technology
- 9. Asia Smart Plug Market Analysis, Insights and Forecast, 2021-2033
- 9.1. Market Analysis, Insights and Forecast - by Technology
- 9.1.1. Bluetooth
- 9.1.2. Wi-Fi
- 9.2. Market Analysis, Insights and Forecast - by Application
- 9.2.1. Industrial Use
- 9.2.2. Commercial Use
- 9.2.3. Household Use
- 9.1. Market Analysis, Insights and Forecast - by Technology
- 10. Latin America Smart Plug Market Analysis, Insights and Forecast, 2021-2033
- 10.1. Market Analysis, Insights and Forecast - by Technology
- 10.1.1. Bluetooth
- 10.1.2. Wi-Fi
- 10.2. Market Analysis, Insights and Forecast - by Application
- 10.2.1. Industrial Use
- 10.2.2. Commercial Use
- 10.2.3. Household Use
- 10.1. Market Analysis, Insights and Forecast - by Technology
- 11. Middle East and Africa Smart Plug Market Analysis, Insights and Forecast, 2021-2033
- 11.1. Market Analysis, Insights and Forecast - by Technology
- 11.1.1. Bluetooth
- 11.1.2. Wi-Fi
- 11.2. Market Analysis, Insights and Forecast - by Application
- 11.2.1. Industrial Use
- 11.2.2. Commercial Use
- 11.2.3. Household Use
- 11.1. Market Analysis, Insights and Forecast - by Technology
- 12. Competitive Analysis
- 12.1. Company Profiles
- 12.1.1 Vesync Co Ltd (Etekcity Corporation)
- 12.1.1.1. Company Overview
- 12.1.1.2. Products
- 12.1.1.3. Company Financials
- 12.1.1.4. SWOT Analysis
- 12.1.2 Revogi Innovation Co Ltd
- 12.1.2.1. Company Overview
- 12.1.2.2. Products
- 12.1.2.3. Company Financials
- 12.1.2.4. SWOT Analysis
- 12.1.3 Wipro Limited
- 12.1.3.1. Company Overview
- 12.1.3.2. Products
- 12.1.3.3. Company Financials
- 12.1.3.4. SWOT Analysis
- 12.1.4 Broadlink International
- 12.1.4.1. Company Overview
- 12.1.4.2. Products
- 12.1.4.3. Company Financials
- 12.1.4.4. SWOT Analysis
- 12.1.5 Lenovo Group Limited
- 12.1.5.1. Company Overview
- 12.1.5.2. Products
- 12.1.5.3. Company Financials
- 12.1.5.4. SWOT Analysis
- 12.1.6 Belkin International Inc
- 12.1.6.1. Company Overview
- 12.1.6.2. Products
- 12.1.6.3. Company Financials
- 12.1.6.4. SWOT Analysis
- 12.1.7 Leviton Manufacturing Co Inc
- 12.1.7.1. Company Overview
- 12.1.7.2. Products
- 12.1.7.3. Company Financials
- 12.1.7.4. SWOT Analysis
- 12.1.8 Shenzhen Tenda Technology Co Ltd*List Not Exhaustive
- 12.1.8.1. Company Overview
- 12.1.8.2. Products
- 12.1.8.3. Company Financials
- 12.1.8.4. SWOT Analysis
- 12.1.9 Xiaomi Inc
- 12.1.9.1. Company Overview
- 12.1.9.2. Products
- 12.1.9.3. Company Financials
- 12.1.9.4. SWOT Analysis
- 12.1.10 Ankuoo Electronics Inc
- 12.1.10.1. Company Overview
- 12.1.10.2. Products
- 12.1.10.3. Company Financials
- 12.1.10.4. SWOT Analysis
- 12.1.11 TP-Link Technologies Co Ltd
- 12.1.11.1. Company Overview
- 12.1.11.2. Products
- 12.1.11.3. Company Financials
- 12.1.11.4. SWOT Analysis
- 12.1.12 EDIMAX Technology Co Ltd
- 12.1.12.1. Company Overview
- 12.1.12.2. Products
- 12.1.12.3. Company Financials
- 12.1.12.4. SWOT Analysis
- 12.1.13 D-Link Corporation
- 12.1.13.1. Company Overview
- 12.1.13.2. Products
- 12.1.13.3. Company Financials
- 12.1.13.4. SWOT Analysis
- 12.1.14 Panasonic Holdings Corporation
- 12.1.14.1. Company Overview
- 12.1.14.2. Products
- 12.1.14.3. Company Financials
- 12.1.14.4. SWOT Analysis
- 12.1.15 Sariana LLC (Satechi)
- 12.1.15.1. Company Overview
- 12.1.15.2. Products
- 12.1.15.3. Company Financials
- 12.1.15.4. SWOT Analysis
- 12.1.1 Vesync Co Ltd (Etekcity Corporation)
- 12.2. Market Entropy
- 12.2.1 Company's Key Areas Served
- 12.2.2 Recent Developments
- 12.3. Company Market Share Analysis 2025
- 12.3.1 Top 5 Companies Market Share Analysis
- 12.3.2 Top 3 Companies Market Share Analysis
- 12.4. List of Potential Customers
- 13. Research Methodology
List of Figures
- Figure 1: Global Smart Plug Market Revenue Breakdown (billion, %) by Region 2025 & 2033
- Figure 2: North America Smart Plug Market Revenue (billion), by Technology 2025 & 2033
- Figure 3: North America Smart Plug Market Revenue Share (%), by Technology 2025 & 2033
- Figure 4: North America Smart Plug Market Revenue (billion), by Application 2025 & 2033
- Figure 5: North America Smart Plug Market Revenue Share (%), by Application 2025 & 2033
- Figure 6: North America Smart Plug Market Revenue (billion), by Country 2025 & 2033
- Figure 7: North America Smart Plug Market Revenue Share (%), by Country 2025 & 2033
- Figure 8: Europe Smart Plug Market Revenue (billion), by Technology 2025 & 2033
- Figure 9: Europe Smart Plug Market Revenue Share (%), by Technology 2025 & 2033
- Figure 10: Europe Smart Plug Market Revenue (billion), by Application 2025 & 2033
- Figure 11: Europe Smart Plug Market Revenue Share (%), by Application 2025 & 2033
- Figure 12: Europe Smart Plug Market Revenue (billion), by Country 2025 & 2033
- Figure 13: Europe Smart Plug Market Revenue Share (%), by Country 2025 & 2033
- Figure 14: Asia Smart Plug Market Revenue (billion), by Technology 2025 & 2033
- Figure 15: Asia Smart Plug Market Revenue Share (%), by Technology 2025 & 2033
- Figure 16: Asia Smart Plug Market Revenue (billion), by Application 2025 & 2033
- Figure 17: Asia Smart Plug Market Revenue Share (%), by Application 2025 & 2033
- Figure 18: Asia Smart Plug Market Revenue (billion), by Country 2025 & 2033
- Figure 19: Asia Smart Plug Market Revenue Share (%), by Country 2025 & 2033
- Figure 20: Latin America Smart Plug Market Revenue (billion), by Technology 2025 & 2033
- Figure 21: Latin America Smart Plug Market Revenue Share (%), by Technology 2025 & 2033
- Figure 22: Latin America Smart Plug Market Revenue (billion), by Application 2025 & 2033
- Figure 23: Latin America Smart Plug Market Revenue Share (%), by Application 2025 & 2033
- Figure 24: Latin America Smart Plug Market Revenue (billion), by Country 2025 & 2033
- Figure 25: Latin America Smart Plug Market Revenue Share (%), by Country 2025 & 2033
- Figure 26: Middle East and Africa Smart Plug Market Revenue (billion), by Technology 2025 & 2033
- Figure 27: Middle East and Africa Smart Plug Market Revenue Share (%), by Technology 2025 & 2033
- Figure 28: Middle East and Africa Smart Plug Market Revenue (billion), by Application 2025 & 2033
- Figure 29: Middle East and Africa Smart Plug Market Revenue Share (%), by Application 2025 & 2033
- Figure 30: Middle East and Africa Smart Plug Market Revenue (billion), by Country 2025 & 2033
- Figure 31: Middle East and Africa Smart Plug Market Revenue Share (%), by Country 2025 & 2033
List of Tables
- Table 1: Global Smart Plug Market Revenue billion Forecast, by Technology 2020 & 2033
- Table 2: Global Smart Plug Market Revenue billion Forecast, by Application 2020 & 2033
- Table 3: Global Smart Plug Market Revenue billion Forecast, by Region 2020 & 2033
- Table 4: Global Smart Plug Market Revenue billion Forecast, by Technology 2020 & 2033
- Table 5: Global Smart Plug Market Revenue billion Forecast, by Application 2020 & 2033
- Table 6: Global Smart Plug Market Revenue billion Forecast, by Country 2020 & 2033
- Table 7: Global Smart Plug Market Revenue billion Forecast, by Technology 2020 & 2033
- Table 8: Global Smart Plug Market Revenue billion Forecast, by Application 2020 & 2033
- Table 9: Global Smart Plug Market Revenue billion Forecast, by Country 2020 & 2033
- Table 10: Global Smart Plug Market Revenue billion Forecast, by Technology 2020 & 2033
- Table 11: Global Smart Plug Market Revenue billion Forecast, by Application 2020 & 2033
- Table 12: Global Smart Plug Market Revenue billion Forecast, by Country 2020 & 2033
- Table 13: Global Smart Plug Market Revenue billion Forecast, by Technology 2020 & 2033
- Table 14: Global Smart Plug Market Revenue billion Forecast, by Application 2020 & 2033
- Table 15: Global Smart Plug Market Revenue billion Forecast, by Country 2020 & 2033
- Table 16: Global Smart Plug Market Revenue billion Forecast, by Technology 2020 & 2033
- Table 17: Global Smart Plug Market Revenue billion Forecast, by Application 2020 & 2033
- Table 18: Global Smart Plug Market Revenue billion Forecast, by Country 2020 & 2033
Frequently Asked Questions
1. What is the projected Compound Annual Growth Rate (CAGR) of the Smart Plug Market?
The projected CAGR is approximately 8.3%.
2. Which companies are prominent players in the Smart Plug Market?
Key companies in the market include Vesync Co Ltd (Etekcity Corporation), Revogi Innovation Co Ltd, Wipro Limited, Broadlink International, Lenovo Group Limited, Belkin International Inc, Leviton Manufacturing Co Inc, Shenzhen Tenda Technology Co Ltd*List Not Exhaustive, Xiaomi Inc, Ankuoo Electronics Inc, TP-Link Technologies Co Ltd, EDIMAX Technology Co Ltd, D-Link Corporation, Panasonic Holdings Corporation, Sariana LLC (Satechi).
3. What are the main segments of the Smart Plug Market?
The market segments include Technology, Application.
4. Can you provide details about the market size?
The market size is estimated to be USD 3.2 billion as of 2022.
5. What are some drivers contributing to market growth?
Substantial Growth in the Adoption of Smart Homes; Advances in IoT Framework.
6. What are the notable trends driving market growth?
Advances in IoT Framework is Expected to Drive the Market Growth.
7. Are there any restraints impacting market growth?
Security Concerns Related to Smart Plugs and IoT.
8. Can you provide examples of recent developments in the market?
January 2023: TP-Link launched new products under its Tapo range of smart home gadgets. The new additions include a smart hub home connection center, robot vacuums, cameras, a doorbell camera, a smart video door lock, and others. Also, the business unveiled its first smart plugs, switches, outlet extenders, and bulbs certified by Matter. The introduction of these items at CES 2023 demonstrates TP-Link's commitment to growing and diversifying its product line in the smart home market. The company has committed to making smart home technology more approachable and user-friendly by implementing the Matter protocol for its Tapo and Kasabrands of smart home products.
9. What pricing options are available for accessing the report?
Pricing options include single-user, multi-user, and enterprise licenses priced at USD 4750, USD 5250, and USD 8750 respectively.
10. Is the market size provided in terms of value or volume?
The market size is provided in terms of value, measured in billion.
11. Are there any specific market keywords associated with the report?
Yes, the market keyword associated with the report is "Smart Plug Market," which aids in identifying and referencing the specific market segment covered.
12. How do I determine which pricing option suits my needs best?
The pricing options vary based on user requirements and access needs. Individual users may opt for single-user licenses, while businesses requiring broader access may choose multi-user or enterprise licenses for cost-effective access to the report.
13. Are there any additional resources or data provided in the Smart Plug Market report?
While the report offers comprehensive insights, it's advisable to review the specific contents or supplementary materials provided to ascertain if additional resources or data are available.
14. How can I stay updated on further developments or reports in the Smart Plug Market?
To stay informed about further developments, trends, and reports in the Smart Plug Market, consider subscribing to industry newsletters, following relevant companies and organizations, or regularly checking reputable industry news sources and publications.
Methodology
Step 1 - Identification of Relevant Samples Size from Population Database


Step 2 - Approaches for Defining Global Market Size (Value, Volume* & Price*)

Note*: In applicable scenarios
Step 3 - Data Sources
Primary Research
- Web Analytics
- Survey Reports
- Research Institute
- Latest Research Reports
- Opinion Leaders
Secondary Research
- Annual Reports
- White Paper
- Latest Press Release
- Industry Association
- Paid Database
- Investor Presentations

Step 4 - Data Triangulation
Involves using different sources of information in order to increase the validity of a study
These sources are likely to be stakeholders in a program - participants, other researchers, program staff, other community members, and so on.
Then we put all data in single framework & apply various statistical tools to find out the dynamic on the market.
During the analysis stage, feedback from the stakeholder groups would be compared to determine areas of agreement as well as areas of divergence

