

Key Insights
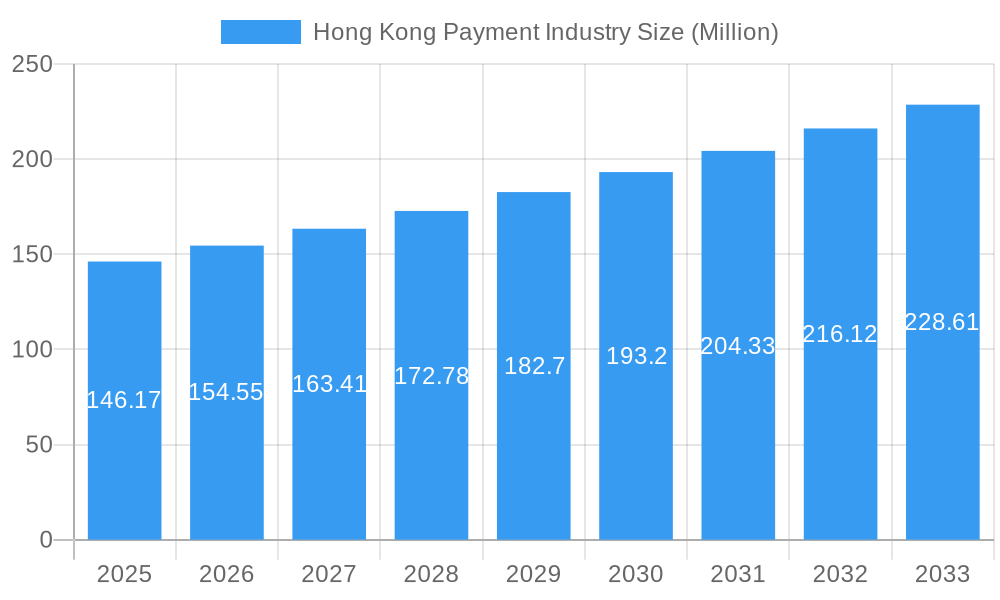
The Hong Kong payment industry is projected to experience robust growth, with a current market size of USD 146.17 million, expanding at a Compound Annual Growth Rate (CAGR) of 5.66% through to 2033. This upward trajectory is primarily fueled by the increasing adoption of digital payment methods and the continuous innovation within the financial technology sector. Key drivers include the rising penetration of smartphones and internet access, enabling seamless mobile and online transactions. Furthermore, government initiatives promoting cashless societies and supportive regulatory frameworks are playing a significant role in fostering this expansion. The convenience, speed, and security offered by digital wallets and card payments are compelling consumers to shift away from traditional cash transactions. This shift is particularly evident across high-volume end-user industries such as retail, entertainment, and hospitality, where enhanced customer experience and efficient transaction processing are paramount.
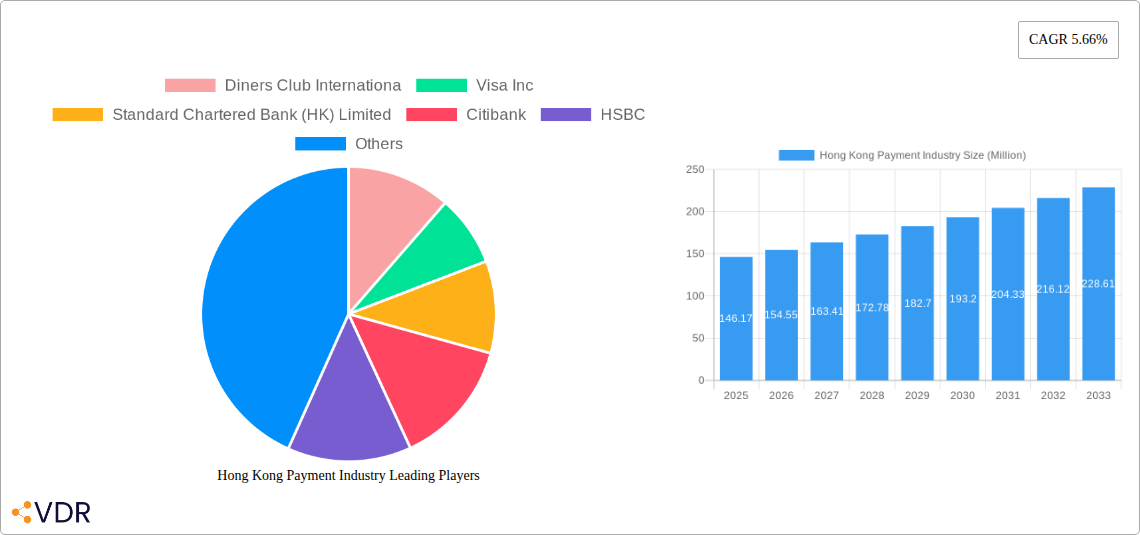
Hong Kong Payment Industry Market Size (In Million)
The competitive landscape of the Hong Kong payment industry is characterized by the presence of major global players and local financial institutions, all vying to capture market share. Trends indicate a strong emphasis on contactless payments, the integration of biometric authentication for enhanced security, and the development of open banking solutions that facilitate greater interoperability between financial service providers. While the market is poised for growth, certain restraints may emerge, such as evolving data privacy regulations and the potential for increased cybersecurity threats, necessitating continuous investment in robust security infrastructure. The market segmentation by mode of payment highlights the dominance of card payments and digital wallets, with cash payments gradually diminishing in significance. The diversified regional presence, with a strong focus on Asia Pacific, underscores the global appeal and growth potential of Hong Kong as a leading financial hub for payment innovations.
Hong Kong Payment Industry Company Market Share
Hong Kong Payment Industry: Navigating Digital Transformation and Evolving Consumer Behavior (2019-2033)
This comprehensive report offers an in-depth analysis of the Hong Kong Payment Industry, a dynamic sector driven by rapid digital adoption and evolving consumer preferences. Spanning a study period from 2019 to 2033, with a base and estimated year of 2025 and a forecast period from 2025 to 2033, this report provides critical insights for stakeholders. We examine the intricate market structure, growth trends, regional dominance, product landscape, key drivers, barriers, emerging opportunities, growth accelerators, leading players, and notable milestones that are shaping the future of payments in Hong Kong. This analysis is crucial for understanding market concentration, technological innovation, regulatory frameworks, competitive dynamics, and end-user demographics within both parent and child market segments, offering a holistic view of this rapidly advancing industry.
Hong Kong Payment Industry Market Dynamics & Structure
The Hong Kong payment industry is characterized by a moderate level of market concentration, with established players like Visa Inc, Mastercard Incorporated, HSBC, and Standard Chartered Bank (HK) Limited holding significant market share. However, the increasing adoption of digital wallets and alternative payment solutions by fintech companies is fostering a more competitive landscape. Technological innovation is a primary driver, with advancements in mobile payments, contactless technology, and the potential integration of central bank digital currencies (CBDCs) transforming transaction methods. Regulatory frameworks, overseen by bodies like the Hong Kong Monetary Authority (HKMA), are crucial in shaping this evolution, ensuring security and fostering innovation through initiatives like Faster Payment System (FPS). Competitive product substitutes are abundant, ranging from traditional card payments to newer digital offerings. End-user demographics showcase a growing preference for convenience and speed, particularly among younger, tech-savvy populations. Merger and acquisition (M&A) trends are also evident as larger institutions acquire or partner with innovative fintech firms to expand their service offerings and market reach.
- Market Concentration: Moderate, with a blend of traditional banking giants and emerging fintech players.
- Technological Innovation Drivers: Mobile payment adoption, contactless technology, potential CBDC integration, and AI-driven fraud detection.
- Regulatory Frameworks: Hong Kong Monetary Authority (HKMA) plays a pivotal role in guiding innovation and ensuring security.
- Competitive Product Substitutes: Digital wallets, contactless cards, QR code payments, and traditional cash/card transactions.
- End-User Demographics: Strong adoption among millennials and Gen Z for digital payment solutions; growing demand for seamless online and offline payment experiences.
- M&A Trends: Strategic acquisitions and partnerships to enhance digital payment capabilities and expand service portfolios.
Hong Kong Payment Industry Growth Trends & Insights
The Hong Kong payment industry is poised for significant growth, driven by a robust economic environment and a highly digitally connected populace. The market size is projected to expand substantially over the forecast period, fueled by increasing transaction volumes across both Point of Sale (POS) and online channels. Adoption rates for digital payment methods, including digital wallets and contactless card payments, are on a steep upward trajectory. This surge is intrinsically linked to technological disruptions such as the proliferation of smartphones, advancements in secure payment gateways, and the ongoing development of payment infrastructure by key players like EPS Company. Consumer behavior shifts are also playing a pivotal role, with a clear preference emerging for frictionless, instant, and secure payment experiences. The convenience offered by mobile payments and the increasing acceptance of digital transactions across various retail and service sectors are reshaping how consumers engage with payments. The integration of QR code payments, facilitated by initiatives like FPS, has further accelerated this trend, making payments more accessible and intuitive. The forecast period will likely witness enhanced interoperability between different payment systems, further streamlining transactions and driving broader adoption. The anticipated Compound Annual Growth Rate (CAGR) for the Hong Kong payment industry underscores its considerable expansion potential.
Dominant Regions, Countries, or Segments in Hong Kong Payment Industry
Within the Hong Kong payment industry, digital wallet adoption stands out as a dominant segment driving market growth across various end-user industries. This dominance is propelled by Hong Kong's highly urbanized population, advanced technological infrastructure, and strong government support for digital transformation. The convenience and speed offered by digital wallets have resonated deeply with consumers, leading to widespread adoption across retail, entertainment, and hospitality sectors.
Key Drivers for Digital Wallet Dominance:
- Technological Infrastructure: Widespread smartphone penetration and high-speed internet connectivity provide a fertile ground for digital wallet services.
- Consumer Convenience: Instantaneous transactions, secure storage of payment information, and loyalty program integration enhance the user experience.
- Government Initiatives: The Faster Payment System (FPS) has significantly boosted interoperability and ease of use for digital payments, including those facilitated by digital wallets.
- Merchant Adoption: An increasing number of merchants, from large retailers to small businesses, are integrating digital wallet payment options to cater to consumer demand and streamline checkout processes.
- Growth in E-commerce and Mobile Commerce: The burgeoning online retail sector naturally favors digital payment methods, with digital wallets being a preferred choice for many.
End-User Industry Impact:
- Retail: Digital wallets are transforming the retail experience, enabling quick and seamless transactions at POS terminals and in online stores.
- Hospitality: Restaurants, hotels, and travel services are increasingly accepting digital wallets, offering a convenient payment option for tourists and locals alike.
- Entertainment: Ticketing for events, in-app purchases for games, and streaming services heavily rely on digital wallet integrations for ease of access and payment.
The Point of Sale (POS) segment, with Card Payments and Digital Wallet as its primary modes, is a major contributor to overall market growth. The increasing deployment of contactless payment terminals and the growing preference for tap-to-pay across various merchant categories underscore the continued relevance and expansion of POS payment solutions.
Hong Kong Payment Industry Product Landscape
The product landscape in the Hong Kong payment industry is characterized by continuous innovation, focusing on enhancing user experience, security, and transaction efficiency. Digital wallets, such as those offered by major banks and fintech providers, are a cornerstone, integrating multiple payment methods and loyalty programs. Contactless card payment solutions, enabled by NFC technology, continue to gain traction across POS terminals. The development of secure and user-friendly online payment gateways and processing services is crucial for the booming e-commerce sector. Innovations in biometric authentication and tokenization are strengthening transaction security. Furthermore, the integration of payment functionalities within various super-apps and lifestyle platforms demonstrates a trend towards embedded finance, making payments an intrinsic part of daily digital interactions.
Key Drivers, Barriers & Challenges in Hong Kong Payment Industry
Key Drivers:
- Technological Advancements: The widespread adoption of smartphones, growth of e-commerce, and innovation in payment technologies like QR codes and NFC are significant drivers.
- Government Support & Initiatives: The Hong Kong Monetary Authority's (HKMA) promotion of digital payments, including the Faster Payment System (FPS), fosters a conducive environment.
- Consumer Demand for Convenience: A growing preference for seamless, fast, and secure digital payment methods fuels market expansion.
- Financial Inclusion: Efforts to bring more individuals into the formal financial system through accessible digital payment solutions.
Barriers & Challenges:
- Cybersecurity Threats: The increasing sophistication of cyberattacks poses a constant threat to the security of digital transactions.
- Regulatory Compliance: Navigating evolving regulatory landscapes and ensuring compliance with data privacy and security mandates can be challenging.
- Interoperability Issues: While improving, ensuring seamless interoperability between diverse payment systems remains a challenge for some transactions.
- Digital Divide: Ensuring access and digital literacy for all segments of the population to participate in the digital payment ecosystem.
- Merchant Adoption Costs: Initial investment and ongoing maintenance costs for digital payment infrastructure can be a barrier for smaller businesses.
Emerging Opportunities in Hong Kong Payment Industry
Emerging opportunities in the Hong Kong payment industry lie in the continued expansion of real-time payment services, the integration of AI for personalized financial advice and fraud detection, and the growing adoption of embedded finance solutions. The potential for central bank digital currencies (CBDCs) presents a significant future opportunity for transforming payment infrastructure and creating new use cases. Untapped markets include micro-businesses and specific demographic segments that may still rely on traditional payment methods, offering potential for tailored digital solutions. Furthermore, the growing demand for cross-border payment solutions, particularly within Asia, represents a significant growth avenue for Hong Kong's financial services sector.
Growth Accelerators in the Hong Kong Payment Industry Industry
Several key accelerators are driving long-term growth in the Hong Kong payment industry. The continuous development and adoption of innovative payment technologies, such as advanced encryption and biometric authentication, enhance security and user trust. Strategic partnerships between traditional financial institutions and fintech companies are crucial for leveraging technological expertise and expanding service offerings. Market expansion strategies, including the development of payment solutions tailored for the Greater Bay Area and other regional markets, will unlock new revenue streams. Furthermore, the increasing focus on data analytics to understand consumer behavior and provide personalized payment experiences will foster greater customer loyalty and drive transaction volumes. The ongoing digitalization of various business sectors will also create sustained demand for efficient and modern payment solutions.
Key Players Shaping the Hong Kong Payment Industry Market
- Diners Club International
- Visa Inc
- Standard Chartered Bank (HK) Limited
- Citibank
- HSBC
- Bank of China
- American Express Company
- The Bank of East Asia Limited (BEA)
- Mastercard Incorporated
- EPS Company
Notable Milestones in Hong Kong Payment Industry Sector
- November 2023: JCB and Stripe Expanded their Partnership to Europe, Singapore, and Hong Kong.
- August 2023: Stripe added JCB to its default payment scheme for merchants in the United Kingdom and Ireland.
- Ongoing (2023-2024): Continued expansion of the Faster Payment System (FPS) with new functionalities and increased merchant adoption.
- 2022-2023: Significant growth in digital wallet usage across various consumer segments, driven by convenience and merchant acceptance.
- 2021-2022: Increased investment in cybersecurity measures by financial institutions and payment providers in response to evolving threats.
In-Depth Hong Kong Payment Industry Market Outlook
The Hong Kong payment industry is set for sustained growth, propelled by ongoing technological innovation and shifting consumer preferences towards digital and mobile payment solutions. The strategic expansion of payment networks, coupled with a focus on enhancing interoperability and security, will further solidify Hong Kong's position as a leading FinTech hub. Opportunities for growth acceleration are evident in the increasing adoption of embedded finance, the potential integration of central bank digital currencies, and the development of cross-border payment solutions that leverage the region's unique connectivity. Stakeholders can expect a continued evolution towards more personalized, secure, and frictionless payment experiences, driven by a competitive landscape that encourages innovation and customer-centricity.
Hong Kong Payment Industry Segmentation
-
1. Mode of Payment
-
1.1. By Point of Sale
- 1.1.1. Card Payments
- 1.1.2. Digital Wallet
- 1.1.3. Cash
- 1.1.4. Other Point of Sales
-
1.2. By Online Sale
- 1.2.1. Other Online Sales
-
1.1. By Point of Sale
-
2. End-user Industry
- 2.1. Retail
- 2.2. Entertainment
- 2.3. Healthcare
- 2.4. Hospitality
- 2.5. Other End-user Industries
Hong Kong Payment Industry Segmentation By Geography
-
1. North America
- 1.1. United States
- 1.2. Canada
- 1.3. Mexico
-
2. South America
- 2.1. Brazil
- 2.2. Argentina
- 2.3. Rest of South America
-
3. Europe
- 3.1. United Kingdom
- 3.2. Germany
- 3.3. France
- 3.4. Italy
- 3.5. Spain
- 3.6. Russia
- 3.7. Benelux
- 3.8. Nordics
- 3.9. Rest of Europe
-
4. Middle East & Africa
- 4.1. Turkey
- 4.2. Israel
- 4.3. GCC
- 4.4. North Africa
- 4.5. South Africa
- 4.6. Rest of Middle East & Africa
-
5. Asia Pacific
- 5.1. China
- 5.2. India
- 5.3. Japan
- 5.4. South Korea
- 5.5. ASEAN
- 5.6. Oceania
- 5.7. Rest of Asia Pacific
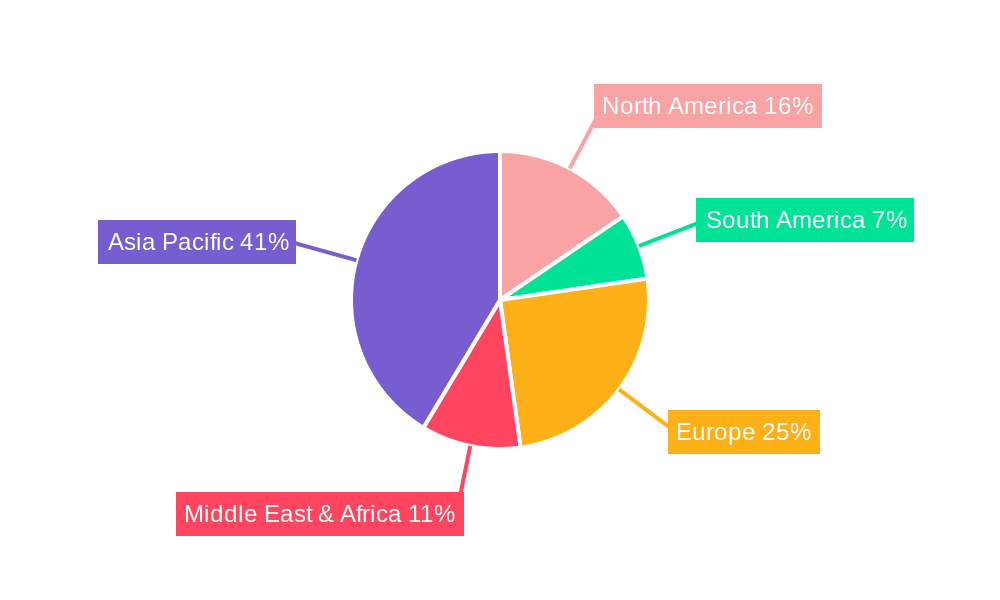
Hong Kong Payment Industry Regional Market Share
Geographic Coverage of Hong Kong Payment Industry
Hong Kong Payment Industry REPORT HIGHLIGHTS
| Aspects | Details |
|---|---|
| Study Period | 2020-2034 |
| Base Year | 2025 |
| Estimated Year | 2026 |
| Forecast Period | 2026-2034 |
| Historical Period | 2020-2025 |
| Growth Rate | CAGR of 5.66% from 2020-2034 |
| Segmentation |
|
Table of Contents
- 1. Introduction
- 1.1. Research Scope
- 1.2. Market Segmentation
- 1.3. Research Objective
- 1.4. Definitions and Assumptions
- 2. Executive Summary
- 2.1. Market Snapshot
- 3. Market Dynamics
- 3.1. Market Drivers
- 3.2. Market Restrains
- 3.3. Market Trends
- 3.4. Market Opportunities
- 4. Market Factor Analysis
- 4.1. Porters Five Forces
- 4.1.1. Bargaining Power of Suppliers
- 4.1.2. Bargaining Power of Buyers
- 4.1.3. Threat of New Entrants
- 4.1.4. Threat of Substitutes
- 4.1.5. Competitive Rivalry
- 4.2. PESTEL analysis
- 4.3. BCG Analysis
- 4.3.1. Stars (High Growth, High Market Share)
- 4.3.2. Cash Cows (Low Growth, High Market Share)
- 4.3.3. Question Mark (High Growth, Low Market Share)
- 4.3.4. Dogs (Low Growth, Low Market Share)
- 4.4. Ansoff Matrix Analysis
- 4.5. Supply Chain Analysis
- 4.6. Regulatory Landscape
- 4.7. Current Market Potential and Opportunity Assessment (TAM–SAM–SOM Framework)
- 4.8. VDR Analyst Note
- 4.1. Porters Five Forces
- 5. Market Analysis, Insights and Forecast 2021-2033
- 5.1. Market Analysis, Insights and Forecast - by Mode of Payment
- 5.1.1. By Point of Sale
- 5.1.1.1. Card Payments
- 5.1.1.2. Digital Wallet
- 5.1.1.3. Cash
- 5.1.1.4. Other Point of Sales
- 5.1.2. By Online Sale
- 5.1.2.1. Other Online Sales
- 5.1.1. By Point of Sale
- 5.2. Market Analysis, Insights and Forecast - by End-user Industry
- 5.2.1. Retail
- 5.2.2. Entertainment
- 5.2.3. Healthcare
- 5.2.4. Hospitality
- 5.2.5. Other End-user Industries
- 5.3. Market Analysis, Insights and Forecast - by Region
- 5.3.1. North America
- 5.3.2. South America
- 5.3.3. Europe
- 5.3.4. Middle East & Africa
- 5.3.5. Asia Pacific
- 5.1. Market Analysis, Insights and Forecast - by Mode of Payment
- 6. Global Hong Kong Payment Industry Analysis, Insights and Forecast, 2021-2033
- 6.1. Market Analysis, Insights and Forecast - by Mode of Payment
- 6.1.1. By Point of Sale
- 6.1.1.1. Card Payments
- 6.1.1.2. Digital Wallet
- 6.1.1.3. Cash
- 6.1.1.4. Other Point of Sales
- 6.1.2. By Online Sale
- 6.1.2.1. Other Online Sales
- 6.1.1. By Point of Sale
- 6.2. Market Analysis, Insights and Forecast - by End-user Industry
- 6.2.1. Retail
- 6.2.2. Entertainment
- 6.2.3. Healthcare
- 6.2.4. Hospitality
- 6.2.5. Other End-user Industries
- 6.1. Market Analysis, Insights and Forecast - by Mode of Payment
- 7. North America Hong Kong Payment Industry Analysis, Insights and Forecast, 2021-2033
- 7.1. Market Analysis, Insights and Forecast - by Mode of Payment
- 7.1.1. By Point of Sale
- 7.1.1.1. Card Payments
- 7.1.1.2. Digital Wallet
- 7.1.1.3. Cash
- 7.1.1.4. Other Point of Sales
- 7.1.2. By Online Sale
- 7.1.2.1. Other Online Sales
- 7.1.1. By Point of Sale
- 7.2. Market Analysis, Insights and Forecast - by End-user Industry
- 7.2.1. Retail
- 7.2.2. Entertainment
- 7.2.3. Healthcare
- 7.2.4. Hospitality
- 7.2.5. Other End-user Industries
- 7.1. Market Analysis, Insights and Forecast - by Mode of Payment
- 8. South America Hong Kong Payment Industry Analysis, Insights and Forecast, 2021-2033
- 8.1. Market Analysis, Insights and Forecast - by Mode of Payment
- 8.1.1. By Point of Sale
- 8.1.1.1. Card Payments
- 8.1.1.2. Digital Wallet
- 8.1.1.3. Cash
- 8.1.1.4. Other Point of Sales
- 8.1.2. By Online Sale
- 8.1.2.1. Other Online Sales
- 8.1.1. By Point of Sale
- 8.2. Market Analysis, Insights and Forecast - by End-user Industry
- 8.2.1. Retail
- 8.2.2. Entertainment
- 8.2.3. Healthcare
- 8.2.4. Hospitality
- 8.2.5. Other End-user Industries
- 8.1. Market Analysis, Insights and Forecast - by Mode of Payment
- 9. Europe Hong Kong Payment Industry Analysis, Insights and Forecast, 2021-2033
- 9.1. Market Analysis, Insights and Forecast - by Mode of Payment
- 9.1.1. By Point of Sale
- 9.1.1.1. Card Payments
- 9.1.1.2. Digital Wallet
- 9.1.1.3. Cash
- 9.1.1.4. Other Point of Sales
- 9.1.2. By Online Sale
- 9.1.2.1. Other Online Sales
- 9.1.1. By Point of Sale
- 9.2. Market Analysis, Insights and Forecast - by End-user Industry
- 9.2.1. Retail
- 9.2.2. Entertainment
- 9.2.3. Healthcare
- 9.2.4. Hospitality
- 9.2.5. Other End-user Industries
- 9.1. Market Analysis, Insights and Forecast - by Mode of Payment
- 10. Middle East & Africa Hong Kong Payment Industry Analysis, Insights and Forecast, 2021-2033
- 10.1. Market Analysis, Insights and Forecast - by Mode of Payment
- 10.1.1. By Point of Sale
- 10.1.1.1. Card Payments
- 10.1.1.2. Digital Wallet
- 10.1.1.3. Cash
- 10.1.1.4. Other Point of Sales
- 10.1.2. By Online Sale
- 10.1.2.1. Other Online Sales
- 10.1.1. By Point of Sale
- 10.2. Market Analysis, Insights and Forecast - by End-user Industry
- 10.2.1. Retail
- 10.2.2. Entertainment
- 10.2.3. Healthcare
- 10.2.4. Hospitality
- 10.2.5. Other End-user Industries
- 10.1. Market Analysis, Insights and Forecast - by Mode of Payment
- 11. Asia Pacific Hong Kong Payment Industry Analysis, Insights and Forecast, 2021-2033
- 11.1. Market Analysis, Insights and Forecast - by Mode of Payment
- 11.1.1. By Point of Sale
- 11.1.1.1. Card Payments
- 11.1.1.2. Digital Wallet
- 11.1.1.3. Cash
- 11.1.1.4. Other Point of Sales
- 11.1.2. By Online Sale
- 11.1.2.1. Other Online Sales
- 11.1.1. By Point of Sale
- 11.2. Market Analysis, Insights and Forecast - by End-user Industry
- 11.2.1. Retail
- 11.2.2. Entertainment
- 11.2.3. Healthcare
- 11.2.4. Hospitality
- 11.2.5. Other End-user Industries
- 11.1. Market Analysis, Insights and Forecast - by Mode of Payment
- 12. Competitive Analysis
- 12.1. Company Profiles
- 12.1.1 Diners Club Internationa
- 12.1.1.1. Company Overview
- 12.1.1.2. Products
- 12.1.1.3. Company Financials
- 12.1.1.4. SWOT Analysis
- 12.1.2 Visa Inc
- 12.1.2.1. Company Overview
- 12.1.2.2. Products
- 12.1.2.3. Company Financials
- 12.1.2.4. SWOT Analysis
- 12.1.3 Standard Chartered Bank (HK) Limited
- 12.1.3.1. Company Overview
- 12.1.3.2. Products
- 12.1.3.3. Company Financials
- 12.1.3.4. SWOT Analysis
- 12.1.4 Citibank
- 12.1.4.1. Company Overview
- 12.1.4.2. Products
- 12.1.4.3. Company Financials
- 12.1.4.4. SWOT Analysis
- 12.1.5 HSBC
- 12.1.5.1. Company Overview
- 12.1.5.2. Products
- 12.1.5.3. Company Financials
- 12.1.5.4. SWOT Analysis
- 12.1.6 Bank of China
- 12.1.6.1. Company Overview
- 12.1.6.2. Products
- 12.1.6.3. Company Financials
- 12.1.6.4. SWOT Analysis
- 12.1.7 American Express Company
- 12.1.7.1. Company Overview
- 12.1.7.2. Products
- 12.1.7.3. Company Financials
- 12.1.7.4. SWOT Analysis
- 12.1.8 The Bank of East Asia Limited (BEA)
- 12.1.8.1. Company Overview
- 12.1.8.2. Products
- 12.1.8.3. Company Financials
- 12.1.8.4. SWOT Analysis
- 12.1.9 Mastercard Incorporated
- 12.1.9.1. Company Overview
- 12.1.9.2. Products
- 12.1.9.3. Company Financials
- 12.1.9.4. SWOT Analysis
- 12.1.10 EPS Company
- 12.1.10.1. Company Overview
- 12.1.10.2. Products
- 12.1.10.3. Company Financials
- 12.1.10.4. SWOT Analysis
- 12.1.1 Diners Club Internationa
- 12.2. Market Entropy
- 12.2.1 Company's Key Areas Served
- 12.2.2 Recent Developments
- 12.3. Company Market Share Analysis 2025
- 12.3.1 Top 5 Companies Market Share Analysis
- 12.3.2 Top 3 Companies Market Share Analysis
- 12.4. List of Potential Customers
- 13. Research Methodology
List of Figures
- Figure 1: Global Hong Kong Payment Industry Revenue Breakdown (Million, %) by Region 2025 & 2033
- Figure 2: North America Hong Kong Payment Industry Revenue (Million), by Mode of Payment 2025 & 2033
- Figure 3: North America Hong Kong Payment Industry Revenue Share (%), by Mode of Payment 2025 & 2033
- Figure 4: North America Hong Kong Payment Industry Revenue (Million), by End-user Industry 2025 & 2033
- Figure 5: North America Hong Kong Payment Industry Revenue Share (%), by End-user Industry 2025 & 2033
- Figure 6: North America Hong Kong Payment Industry Revenue (Million), by Country 2025 & 2033
- Figure 7: North America Hong Kong Payment Industry Revenue Share (%), by Country 2025 & 2033
- Figure 8: South America Hong Kong Payment Industry Revenue (Million), by Mode of Payment 2025 & 2033
- Figure 9: South America Hong Kong Payment Industry Revenue Share (%), by Mode of Payment 2025 & 2033
- Figure 10: South America Hong Kong Payment Industry Revenue (Million), by End-user Industry 2025 & 2033
- Figure 11: South America Hong Kong Payment Industry Revenue Share (%), by End-user Industry 2025 & 2033
- Figure 12: South America Hong Kong Payment Industry Revenue (Million), by Country 2025 & 2033
- Figure 13: South America Hong Kong Payment Industry Revenue Share (%), by Country 2025 & 2033
- Figure 14: Europe Hong Kong Payment Industry Revenue (Million), by Mode of Payment 2025 & 2033
- Figure 15: Europe Hong Kong Payment Industry Revenue Share (%), by Mode of Payment 2025 & 2033
- Figure 16: Europe Hong Kong Payment Industry Revenue (Million), by End-user Industry 2025 & 2033
- Figure 17: Europe Hong Kong Payment Industry Revenue Share (%), by End-user Industry 2025 & 2033
- Figure 18: Europe Hong Kong Payment Industry Revenue (Million), by Country 2025 & 2033
- Figure 19: Europe Hong Kong Payment Industry Revenue Share (%), by Country 2025 & 2033
- Figure 20: Middle East & Africa Hong Kong Payment Industry Revenue (Million), by Mode of Payment 2025 & 2033
- Figure 21: Middle East & Africa Hong Kong Payment Industry Revenue Share (%), by Mode of Payment 2025 & 2033
- Figure 22: Middle East & Africa Hong Kong Payment Industry Revenue (Million), by End-user Industry 2025 & 2033
- Figure 23: Middle East & Africa Hong Kong Payment Industry Revenue Share (%), by End-user Industry 2025 & 2033
- Figure 24: Middle East & Africa Hong Kong Payment Industry Revenue (Million), by Country 2025 & 2033
- Figure 25: Middle East & Africa Hong Kong Payment Industry Revenue Share (%), by Country 2025 & 2033
- Figure 26: Asia Pacific Hong Kong Payment Industry Revenue (Million), by Mode of Payment 2025 & 2033
- Figure 27: Asia Pacific Hong Kong Payment Industry Revenue Share (%), by Mode of Payment 2025 & 2033
- Figure 28: Asia Pacific Hong Kong Payment Industry Revenue (Million), by End-user Industry 2025 & 2033
- Figure 29: Asia Pacific Hong Kong Payment Industry Revenue Share (%), by End-user Industry 2025 & 2033
- Figure 30: Asia Pacific Hong Kong Payment Industry Revenue (Million), by Country 2025 & 2033
- Figure 31: Asia Pacific Hong Kong Payment Industry Revenue Share (%), by Country 2025 & 2033
List of Tables
- Table 1: Global Hong Kong Payment Industry Revenue Million Forecast, by Mode of Payment 2020 & 2033
- Table 2: Global Hong Kong Payment Industry Revenue Million Forecast, by End-user Industry 2020 & 2033
- Table 3: Global Hong Kong Payment Industry Revenue Million Forecast, by Region 2020 & 2033
- Table 4: Global Hong Kong Payment Industry Revenue Million Forecast, by Mode of Payment 2020 & 2033
- Table 5: Global Hong Kong Payment Industry Revenue Million Forecast, by End-user Industry 2020 & 2033
- Table 6: Global Hong Kong Payment Industry Revenue Million Forecast, by Country 2020 & 2033
- Table 7: United States Hong Kong Payment Industry Revenue (Million) Forecast, by Application 2020 & 2033
- Table 8: Canada Hong Kong Payment Industry Revenue (Million) Forecast, by Application 2020 & 2033
- Table 9: Mexico Hong Kong Payment Industry Revenue (Million) Forecast, by Application 2020 & 2033
- Table 10: Global Hong Kong Payment Industry Revenue Million Forecast, by Mode of Payment 2020 & 2033
- Table 11: Global Hong Kong Payment Industry Revenue Million Forecast, by End-user Industry 2020 & 2033
- Table 12: Global Hong Kong Payment Industry Revenue Million Forecast, by Country 2020 & 2033
- Table 13: Brazil Hong Kong Payment Industry Revenue (Million) Forecast, by Application 2020 & 2033
- Table 14: Argentina Hong Kong Payment Industry Revenue (Million) Forecast, by Application 2020 & 2033
- Table 15: Rest of South America Hong Kong Payment Industry Revenue (Million) Forecast, by Application 2020 & 2033
- Table 16: Global Hong Kong Payment Industry Revenue Million Forecast, by Mode of Payment 2020 & 2033
- Table 17: Global Hong Kong Payment Industry Revenue Million Forecast, by End-user Industry 2020 & 2033
- Table 18: Global Hong Kong Payment Industry Revenue Million Forecast, by Country 2020 & 2033
- Table 19: United Kingdom Hong Kong Payment Industry Revenue (Million) Forecast, by Application 2020 & 2033
- Table 20: Germany Hong Kong Payment Industry Revenue (Million) Forecast, by Application 2020 & 2033
- Table 21: France Hong Kong Payment Industry Revenue (Million) Forecast, by Application 2020 & 2033
- Table 22: Italy Hong Kong Payment Industry Revenue (Million) Forecast, by Application 2020 & 2033
- Table 23: Spain Hong Kong Payment Industry Revenue (Million) Forecast, by Application 2020 & 2033
- Table 24: Russia Hong Kong Payment Industry Revenue (Million) Forecast, by Application 2020 & 2033
- Table 25: Benelux Hong Kong Payment Industry Revenue (Million) Forecast, by Application 2020 & 2033
- Table 26: Nordics Hong Kong Payment Industry Revenue (Million) Forecast, by Application 2020 & 2033
- Table 27: Rest of Europe Hong Kong Payment Industry Revenue (Million) Forecast, by Application 2020 & 2033
- Table 28: Global Hong Kong Payment Industry Revenue Million Forecast, by Mode of Payment 2020 & 2033
- Table 29: Global Hong Kong Payment Industry Revenue Million Forecast, by End-user Industry 2020 & 2033
- Table 30: Global Hong Kong Payment Industry Revenue Million Forecast, by Country 2020 & 2033
- Table 31: Turkey Hong Kong Payment Industry Revenue (Million) Forecast, by Application 2020 & 2033
- Table 32: Israel Hong Kong Payment Industry Revenue (Million) Forecast, by Application 2020 & 2033
- Table 33: GCC Hong Kong Payment Industry Revenue (Million) Forecast, by Application 2020 & 2033
- Table 34: North Africa Hong Kong Payment Industry Revenue (Million) Forecast, by Application 2020 & 2033
- Table 35: South Africa Hong Kong Payment Industry Revenue (Million) Forecast, by Application 2020 & 2033
- Table 36: Rest of Middle East & Africa Hong Kong Payment Industry Revenue (Million) Forecast, by Application 2020 & 2033
- Table 37: Global Hong Kong Payment Industry Revenue Million Forecast, by Mode of Payment 2020 & 2033
- Table 38: Global Hong Kong Payment Industry Revenue Million Forecast, by End-user Industry 2020 & 2033
- Table 39: Global Hong Kong Payment Industry Revenue Million Forecast, by Country 2020 & 2033
- Table 40: China Hong Kong Payment Industry Revenue (Million) Forecast, by Application 2020 & 2033
- Table 41: India Hong Kong Payment Industry Revenue (Million) Forecast, by Application 2020 & 2033
- Table 42: Japan Hong Kong Payment Industry Revenue (Million) Forecast, by Application 2020 & 2033
- Table 43: South Korea Hong Kong Payment Industry Revenue (Million) Forecast, by Application 2020 & 2033
- Table 44: ASEAN Hong Kong Payment Industry Revenue (Million) Forecast, by Application 2020 & 2033
- Table 45: Oceania Hong Kong Payment Industry Revenue (Million) Forecast, by Application 2020 & 2033
- Table 46: Rest of Asia Pacific Hong Kong Payment Industry Revenue (Million) Forecast, by Application 2020 & 2033
Frequently Asked Questions
1. What is the projected Compound Annual Growth Rate (CAGR) of the Hong Kong Payment Industry?
The projected CAGR is approximately 5.66%.
2. Which companies are prominent players in the Hong Kong Payment Industry?
Key companies in the market include Diners Club Internationa, Visa Inc, Standard Chartered Bank (HK) Limited, Citibank, HSBC, Bank of China, American Express Company, The Bank of East Asia Limited (BEA), Mastercard Incorporated, EPS Company.
3. What are the main segments of the Hong Kong Payment Industry?
The market segments include Mode of Payment, End-user Industry.
4. Can you provide details about the market size?
The market size is estimated to be USD 146.17 Million as of 2022.
5. What are some drivers contributing to market growth?
Integration of Payment Gateways; Initiatives by the Government to Advance in Digital Payments.
6. What are the notable trends driving market growth?
Card Payments to Hold Significant Share in Online Payment Sector.
7. Are there any restraints impacting market growth?
Rising Concern Regarding e-Waste.
8. Can you provide examples of recent developments in the market?
November 2023 - JCB and Stripe Expanded their Partnership to Europe, Singapore, and Hong Kong. As part of this expansion, Stripe added JCB to its default payment scheme for merchants in the United Kingdom and Ireland in August and for merchants in other European countries, Singapore and Hong Kong.
9. What pricing options are available for accessing the report?
Pricing options include single-user, multi-user, and enterprise licenses priced at USD 3800, USD 4500, and USD 5800 respectively.
10. Is the market size provided in terms of value or volume?
The market size is provided in terms of value, measured in Million.
11. Are there any specific market keywords associated with the report?
Yes, the market keyword associated with the report is "Hong Kong Payment Industry," which aids in identifying and referencing the specific market segment covered.
12. How do I determine which pricing option suits my needs best?
The pricing options vary based on user requirements and access needs. Individual users may opt for single-user licenses, while businesses requiring broader access may choose multi-user or enterprise licenses for cost-effective access to the report.
13. Are there any additional resources or data provided in the Hong Kong Payment Industry report?
While the report offers comprehensive insights, it's advisable to review the specific contents or supplementary materials provided to ascertain if additional resources or data are available.
14. How can I stay updated on further developments or reports in the Hong Kong Payment Industry?
To stay informed about further developments, trends, and reports in the Hong Kong Payment Industry, consider subscribing to industry newsletters, following relevant companies and organizations, or regularly checking reputable industry news sources and publications.
Methodology
Step 1 - Identification of Relevant Samples Size from Population Database


Step 2 - Approaches for Defining Global Market Size (Value, Volume* & Price*)

Note*: In applicable scenarios
Step 3 - Data Sources
Primary Research
- Web Analytics
- Survey Reports
- Research Institute
- Latest Research Reports
- Opinion Leaders
Secondary Research
- Annual Reports
- White Paper
- Latest Press Release
- Industry Association
- Paid Database
- Investor Presentations

Step 4 - Data Triangulation
Involves using different sources of information in order to increase the validity of a study
These sources are likely to be stakeholders in a program - participants, other researchers, program staff, other community members, and so on.
Then we put all data in single framework & apply various statistical tools to find out the dynamic on the market.
During the analysis stage, feedback from the stakeholder groups would be compared to determine areas of agreement as well as areas of divergence