
Key Insights
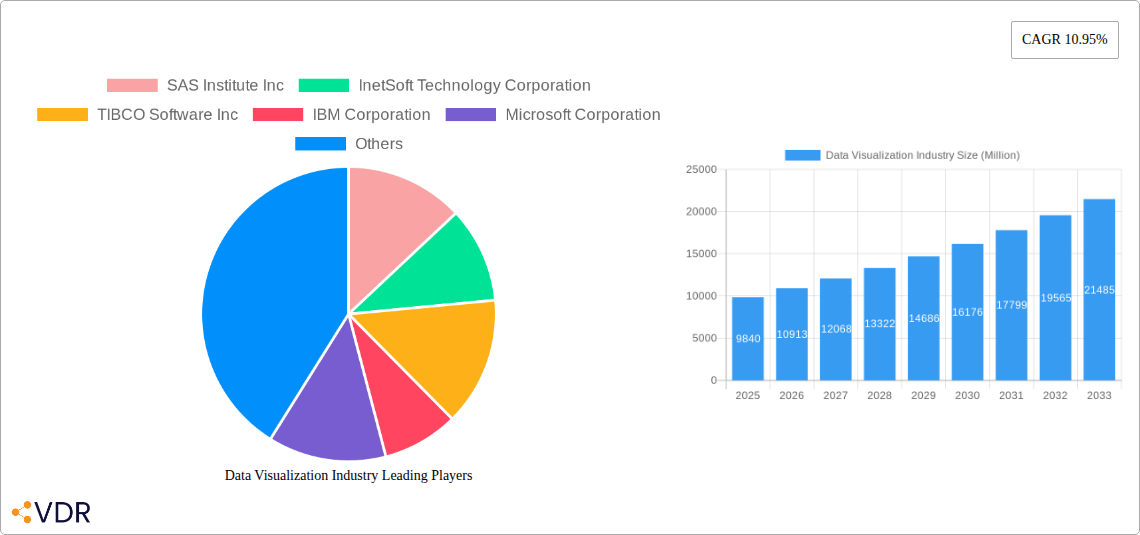
The global data visualization market is experiencing robust growth, projected to reach a value of $9.84 billion in 2025 and maintain a Compound Annual Growth Rate (CAGR) of 10.95% from 2025 to 2033. This expansion is fueled by several key drivers. The increasing volume and complexity of data generated across various industries necessitates effective visualization tools for insightful analysis and decision-making. Furthermore, the rising adoption of cloud-based solutions offers scalability, accessibility, and cost-effectiveness, propelling market growth. Advancements in artificial intelligence (AI) and machine learning (ML) are integrating seamlessly with data visualization platforms, automating insights extraction and enhancing user experience. Specific industry segments, such as BFSI (Banking, Financial Services, and Insurance), IT and Telecommunications, and Retail/E-commerce, are leading the adoption curve due to their heavy reliance on data-driven strategies. The competitive landscape is characterized by a mix of established players like SAS, IBM, and Tableau, alongside emerging technology providers, fostering innovation and competition.
Despite the positive trajectory, market growth faces some challenges. The initial investment in implementing data visualization solutions can be substantial for some organizations, acting as a barrier to entry. Moreover, the need for specialized skills and expertise to effectively utilize these tools presents a hurdle for smaller businesses or those lacking in-house technical capabilities. However, the long-term benefits of enhanced decision-making, improved operational efficiency, and competitive advantage are likely to outweigh these challenges, ensuring continued market expansion. The diverse range of deployment models (on-premise and cloud) and organizational departments utilizing these tools (Executive Management, Marketing, Operations, Finance, and Sales) demonstrate the versatility and widespread applicability of data visualization across various organizational structures. The projected growth indicates a substantial market opportunity for both established players and new entrants.
This comprehensive report provides a detailed analysis of the Data Visualization industry, encompassing market dynamics, growth trends, dominant segments, and key players. The study period covers 2019-2033, with 2025 as the base and estimated year. The forecast period is 2025-2033, and the historical period is 2019-2024. This report is crucial for businesses, investors, and researchers seeking a deep understanding of this rapidly evolving market. The total market size in 2025 is estimated at xx Million.
Data Visualization Industry Market Dynamics & Structure
The Data Visualization market is characterized by a moderately concentrated landscape with several major players and numerous smaller niche vendors. Technological innovation, driven by advancements in AI, big data analytics, and cloud computing, is a primary growth driver. Regulatory frameworks surrounding data privacy (e.g., GDPR) significantly influence market practices. Competitive substitutes include traditional reporting methods and spreadsheet software, though the demand for sophisticated visualization tools is increasing. End-user demographics are diversifying, with adoption across various industries and organizational departments. The market has witnessed a moderate level of M&A activity in recent years.
- Market Concentration: Moderately concentrated, with top 10 players holding approximately 60% market share in 2025.
- Technological Innovation: AI-powered insights, interactive dashboards, and self-service BI tools are key drivers.
- Regulatory Frameworks: Data privacy regulations are shaping data visualization solutions and implementation strategies.
- Competitive Substitutes: Spreadsheets and basic reporting tools face competition from advanced visualization platforms.
- M&A Activity: An average of xx M&A deals per year (2019-2024), indicating consolidation and expansion.
- Innovation Barriers: High initial investment costs and a shortage of skilled professionals can hinder innovation.
Data Visualization Industry Growth Trends & Insights
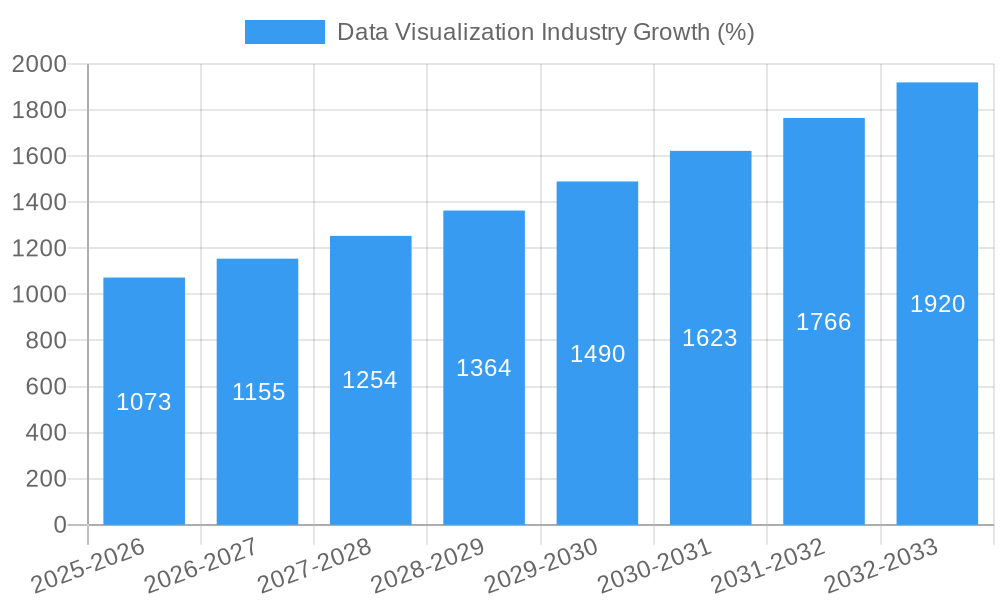
The Data Visualization market has experienced robust growth over the past few years, driven by the increasing need for data-driven decision-making across various sectors. The market size witnessed a CAGR of xx% during the historical period (2019-2024) and is projected to maintain a healthy CAGR of xx% during the forecast period (2025-2033), reaching xx Million by 2033. This growth is fueled by increased data volumes, wider adoption of cloud-based solutions, and the rising demand for real-time business intelligence. Technological disruptions, such as the rise of AI and augmented analytics, are reshaping the market landscape, driving demand for more sophisticated and intuitive data visualization tools. Consumer behavior shifts toward self-service analytics and preference for user-friendly interfaces are also contributing factors.
Dominant Regions, Countries, or Segments in Data Visualization Industry
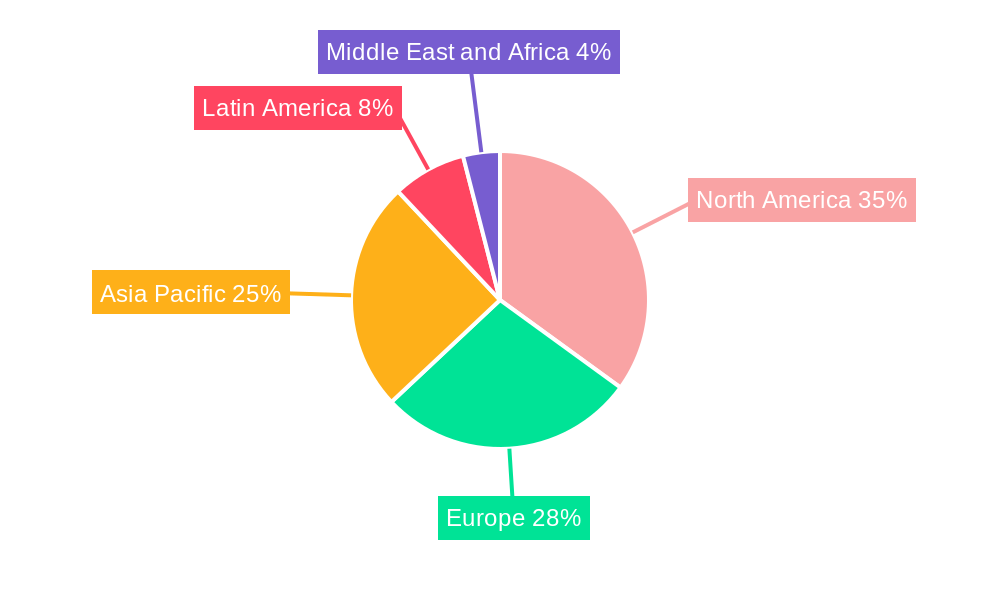
North America currently dominates the Data Visualization market, driven by high technological adoption rates, strong presence of major vendors, and mature data analytics ecosystem. Within organizational departments, Executive Management and Marketing show the highest adoption rates, reflecting the crucial role of data visualization in strategic decision-making and marketing campaigns. The Cloud/On-demand deployment mode is experiencing the fastest growth, driven by scalability, cost-effectiveness, and accessibility. The BFSI and IT & Telecommunication sectors are significant end-users, due to their data-intensive operations and need for robust analytics.
- Key Regional Drivers: North America (strong tech adoption, established vendors); Europe (growing demand, increased regulations); Asia-Pacific (rapid digitalization, rising investments).
- Dominant Segments: Executive Management (strategic decision-making); Cloud/On-demand deployment (scalability, cost-effectiveness); BFSI (data-intensive operations).
- Growth Potential: Asia-Pacific exhibits high growth potential due to rapid digital transformation and increasing data volumes.
Data Visualization Industry Product Landscape
The Data Visualization market offers a diverse range of products, from basic charting tools to advanced interactive dashboards and AI-powered analytics platforms. Product innovations focus on enhancing user experience, improving data integration capabilities, and incorporating advanced analytics features. Key performance metrics include ease of use, data visualization quality, integration capabilities, and cost-effectiveness. Unique selling propositions often center on specialized industry solutions, AI-driven insights, and superior visualization capabilities. Technological advancements include the integration of augmented reality (AR) and virtual reality (VR) for immersive data exploration.
Key Drivers, Barriers & Challenges in Data Visualization Industry
Key Drivers:
- Growing data volumes and the need for effective data analysis.
- Increasing adoption of cloud-based solutions.
- Rise of AI and machine learning in data visualization.
- Growing demand for real-time business intelligence.
Challenges & Restraints:
- High initial investment costs can hinder adoption, especially for SMEs.
- Data security and privacy concerns remain a significant challenge.
- Shortage of skilled professionals limits the effective implementation of data visualization solutions.
- The competitive landscape presents challenges, requiring continuous innovation.
Emerging Opportunities in Data Visualization Industry
- The increasing use of IoT devices is generating massive amounts of data, creating new opportunities for data visualization.
- The integration of AR/VR technologies is opening up new avenues for immersive data exploration.
- Untapped markets in developing economies offer significant growth potential.
- Growing focus on data storytelling and communication to enhance decision-making presents opportunities.
Growth Accelerators in the Data Visualization Industry
Technological breakthroughs, particularly in AI and machine learning, are fueling the growth of the Data Visualization market. Strategic partnerships between data visualization vendors and cloud providers are expanding market reach and accessibility. Market expansion strategies focusing on emerging markets and untapped industry segments contribute to sustained growth.
Key Players Shaping the Data Visualization Industry Market
- SAS Institute Inc
- InetSoft Technology Corporation
- TIBCO Software Inc
- IBM Corporation
- Microsoft Corporation
- Pentaho Corporation
- Dundas Data Visualization Inc
- Information Builders
- Oracle Corporation
- Salesforce com Inc (Tableau Software Inc )
- SAP SE
- MicroStrategy Inc
- List Not Exhaustive
Notable Milestones in Data Visualization Industry Sector
- September 2022: SymphonyAI Industrial unveils KPI 360, an AI-driven solution for manufacturing operational data visualization.
- January 2022: INT releases an updated IVAAP platform for subsurface visualization and analytics in the energy sector, enhancing cloud-based data exploration.
In-Depth Data Visualization Industry Market Outlook
The Data Visualization market is poised for continued strong growth, driven by ongoing technological advancements, expanding adoption across industries, and the increasing need for data-driven decision-making. Strategic opportunities exist in developing innovative solutions leveraging AI, expanding into untapped markets, and forging strategic partnerships to accelerate market penetration. The future holds significant potential for growth, with the market expected to reach xx Million by 2033.
Data Visualization Industry Segmentation
-
1. Organizational Department
- 1.1. Executive Management
- 1.2. Marketing
- 1.3. Operations
- 1.4. Finance
- 1.5. Sales
- 1.6. Other Organizational Departments
-
2. Deployment Mode
- 2.1. On-premise
- 2.2. Cloud/On-demand
-
3. End User
- 3.1. BFSI
- 3.2. IT and Telecommunication
- 3.3. Retail/E-commerce
- 3.4. Education
- 3.5. Manufacturing
- 3.6. Government
- 3.7. Other End Users
Data Visualization Industry Segmentation By Geography
- 1. North America
- 2. Europe
- 3. Asia Pacific
- 4. Latin America
- 5. Middle East and Africa
Data Visualization Industry REPORT HIGHLIGHTS
| Aspects | Details |
|---|---|
| Study Period | 2019-2033 |
| Base Year | 2024 |
| Estimated Year | 2025 |
| Forecast Period | 2025-2033 |
| Historical Period | 2019-2024 |
| Growth Rate | CAGR of 10.95% from 2019-2033 |
| Segmentation |
|
Table of Contents
- 1. Introduction
- 1.1. Research Scope
- 1.2. Market Segmentation
- 1.3. Research Methodology
- 1.4. Definitions and Assumptions
- 2. Executive Summary
- 2.1. Introduction
- 3. Market Dynamics
- 3.1. Introduction
- 3.2. Market Drivers
- 3.2.1. Cloud Deployment of Data Visualization Solutions; Increasing Need for Quick Decision Making
- 3.3. Market Restrains
- 3.3.1. Lack of Tech Savvy and Skilled Workforce/Inability
- 3.4. Market Trends
- 3.4.1. Retail Segment to Witness Significant Growth
- 4. Market Factor Analysis
- 4.1. Porters Five Forces
- 4.2. Supply/Value Chain
- 4.3. PESTEL analysis
- 4.4. Market Entropy
- 4.5. Patent/Trademark Analysis
- 5. Global Data Visualization Industry Analysis, Insights and Forecast, 2019-2031
- 5.1. Market Analysis, Insights and Forecast - by Organizational Department
- 5.1.1. Executive Management
- 5.1.2. Marketing
- 5.1.3. Operations
- 5.1.4. Finance
- 5.1.5. Sales
- 5.1.6. Other Organizational Departments
- 5.2. Market Analysis, Insights and Forecast - by Deployment Mode
- 5.2.1. On-premise
- 5.2.2. Cloud/On-demand
- 5.3. Market Analysis, Insights and Forecast - by End User
- 5.3.1. BFSI
- 5.3.2. IT and Telecommunication
- 5.3.3. Retail/E-commerce
- 5.3.4. Education
- 5.3.5. Manufacturing
- 5.3.6. Government
- 5.3.7. Other End Users
- 5.4. Market Analysis, Insights and Forecast - by Region
- 5.4.1. North America
- 5.4.2. Europe
- 5.4.3. Asia Pacific
- 5.4.4. Latin America
- 5.4.5. Middle East and Africa
- 5.1. Market Analysis, Insights and Forecast - by Organizational Department
- 6. North America Data Visualization Industry Analysis, Insights and Forecast, 2019-2031
- 6.1. Market Analysis, Insights and Forecast - by Organizational Department
- 6.1.1. Executive Management
- 6.1.2. Marketing
- 6.1.3. Operations
- 6.1.4. Finance
- 6.1.5. Sales
- 6.1.6. Other Organizational Departments
- 6.2. Market Analysis, Insights and Forecast - by Deployment Mode
- 6.2.1. On-premise
- 6.2.2. Cloud/On-demand
- 6.3. Market Analysis, Insights and Forecast - by End User
- 6.3.1. BFSI
- 6.3.2. IT and Telecommunication
- 6.3.3. Retail/E-commerce
- 6.3.4. Education
- 6.3.5. Manufacturing
- 6.3.6. Government
- 6.3.7. Other End Users
- 6.1. Market Analysis, Insights and Forecast - by Organizational Department
- 7. Europe Data Visualization Industry Analysis, Insights and Forecast, 2019-2031
- 7.1. Market Analysis, Insights and Forecast - by Organizational Department
- 7.1.1. Executive Management
- 7.1.2. Marketing
- 7.1.3. Operations
- 7.1.4. Finance
- 7.1.5. Sales
- 7.1.6. Other Organizational Departments
- 7.2. Market Analysis, Insights and Forecast - by Deployment Mode
- 7.2.1. On-premise
- 7.2.2. Cloud/On-demand
- 7.3. Market Analysis, Insights and Forecast - by End User
- 7.3.1. BFSI
- 7.3.2. IT and Telecommunication
- 7.3.3. Retail/E-commerce
- 7.3.4. Education
- 7.3.5. Manufacturing
- 7.3.6. Government
- 7.3.7. Other End Users
- 7.1. Market Analysis, Insights and Forecast - by Organizational Department
- 8. Asia Pacific Data Visualization Industry Analysis, Insights and Forecast, 2019-2031
- 8.1. Market Analysis, Insights and Forecast - by Organizational Department
- 8.1.1. Executive Management
- 8.1.2. Marketing
- 8.1.3. Operations
- 8.1.4. Finance
- 8.1.5. Sales
- 8.1.6. Other Organizational Departments
- 8.2. Market Analysis, Insights and Forecast - by Deployment Mode
- 8.2.1. On-premise
- 8.2.2. Cloud/On-demand
- 8.3. Market Analysis, Insights and Forecast - by End User
- 8.3.1. BFSI
- 8.3.2. IT and Telecommunication
- 8.3.3. Retail/E-commerce
- 8.3.4. Education
- 8.3.5. Manufacturing
- 8.3.6. Government
- 8.3.7. Other End Users
- 8.1. Market Analysis, Insights and Forecast - by Organizational Department
- 9. Latin America Data Visualization Industry Analysis, Insights and Forecast, 2019-2031
- 9.1. Market Analysis, Insights and Forecast - by Organizational Department
- 9.1.1. Executive Management
- 9.1.2. Marketing
- 9.1.3. Operations
- 9.1.4. Finance
- 9.1.5. Sales
- 9.1.6. Other Organizational Departments
- 9.2. Market Analysis, Insights and Forecast - by Deployment Mode
- 9.2.1. On-premise
- 9.2.2. Cloud/On-demand
- 9.3. Market Analysis, Insights and Forecast - by End User
- 9.3.1. BFSI
- 9.3.2. IT and Telecommunication
- 9.3.3. Retail/E-commerce
- 9.3.4. Education
- 9.3.5. Manufacturing
- 9.3.6. Government
- 9.3.7. Other End Users
- 9.1. Market Analysis, Insights and Forecast - by Organizational Department
- 10. Middle East and Africa Data Visualization Industry Analysis, Insights and Forecast, 2019-2031
- 10.1. Market Analysis, Insights and Forecast - by Organizational Department
- 10.1.1. Executive Management
- 10.1.2. Marketing
- 10.1.3. Operations
- 10.1.4. Finance
- 10.1.5. Sales
- 10.1.6. Other Organizational Departments
- 10.2. Market Analysis, Insights and Forecast - by Deployment Mode
- 10.2.1. On-premise
- 10.2.2. Cloud/On-demand
- 10.3. Market Analysis, Insights and Forecast - by End User
- 10.3.1. BFSI
- 10.3.2. IT and Telecommunication
- 10.3.3. Retail/E-commerce
- 10.3.4. Education
- 10.3.5. Manufacturing
- 10.3.6. Government
- 10.3.7. Other End Users
- 10.1. Market Analysis, Insights and Forecast - by Organizational Department
- 11. North America Data Visualization Industry Analysis, Insights and Forecast, 2019-2031
- 11.1. Market Analysis, Insights and Forecast - By Country/Sub-region
- 11.1.1.
- 12. Europe Data Visualization Industry Analysis, Insights and Forecast, 2019-2031
- 12.1. Market Analysis, Insights and Forecast - By Country/Sub-region
- 12.1.1.
- 13. Asia Pacific Data Visualization Industry Analysis, Insights and Forecast, 2019-2031
- 13.1. Market Analysis, Insights and Forecast - By Country/Sub-region
- 13.1.1.
- 14. Latin America Data Visualization Industry Analysis, Insights and Forecast, 2019-2031
- 14.1. Market Analysis, Insights and Forecast - By Country/Sub-region
- 14.1.1.
- 15. Middle East and Africa Data Visualization Industry Analysis, Insights and Forecast, 2019-2031
- 15.1. Market Analysis, Insights and Forecast - By Country/Sub-region
- 15.1.1.
- 16. Competitive Analysis
- 16.1. Global Market Share Analysis 2024
- 16.2. Company Profiles
- 16.2.1 SAS Institute Inc
- 16.2.1.1. Overview
- 16.2.1.2. Products
- 16.2.1.3. SWOT Analysis
- 16.2.1.4. Recent Developments
- 16.2.1.5. Financials (Based on Availability)
- 16.2.2 InetSoft Technology Corporation
- 16.2.2.1. Overview
- 16.2.2.2. Products
- 16.2.2.3. SWOT Analysis
- 16.2.2.4. Recent Developments
- 16.2.2.5. Financials (Based on Availability)
- 16.2.3 TIBCO Software Inc
- 16.2.3.1. Overview
- 16.2.3.2. Products
- 16.2.3.3. SWOT Analysis
- 16.2.3.4. Recent Developments
- 16.2.3.5. Financials (Based on Availability)
- 16.2.4 IBM Corporation
- 16.2.4.1. Overview
- 16.2.4.2. Products
- 16.2.4.3. SWOT Analysis
- 16.2.4.4. Recent Developments
- 16.2.4.5. Financials (Based on Availability)
- 16.2.5 Microsoft Corporation
- 16.2.5.1. Overview
- 16.2.5.2. Products
- 16.2.5.3. SWOT Analysis
- 16.2.5.4. Recent Developments
- 16.2.5.5. Financials (Based on Availability)
- 16.2.6 Pentaho Corporation
- 16.2.6.1. Overview
- 16.2.6.2. Products
- 16.2.6.3. SWOT Analysis
- 16.2.6.4. Recent Developments
- 16.2.6.5. Financials (Based on Availability)
- 16.2.7 Dundas Data Visualization Inc
- 16.2.7.1. Overview
- 16.2.7.2. Products
- 16.2.7.3. SWOT Analysis
- 16.2.7.4. Recent Developments
- 16.2.7.5. Financials (Based on Availability)
- 16.2.8 Information Builders
- 16.2.8.1. Overview
- 16.2.8.2. Products
- 16.2.8.3. SWOT Analysis
- 16.2.8.4. Recent Developments
- 16.2.8.5. Financials (Based on Availability)
- 16.2.9 Oracle Corporation
- 16.2.9.1. Overview
- 16.2.9.2. Products
- 16.2.9.3. SWOT Analysis
- 16.2.9.4. Recent Developments
- 16.2.9.5. Financials (Based on Availability)
- 16.2.10 Salesforce com Inc (Tableau Software Inc )
- 16.2.10.1. Overview
- 16.2.10.2. Products
- 16.2.10.3. SWOT Analysis
- 16.2.10.4. Recent Developments
- 16.2.10.5. Financials (Based on Availability)
- 16.2.11 SAP SE
- 16.2.11.1. Overview
- 16.2.11.2. Products
- 16.2.11.3. SWOT Analysis
- 16.2.11.4. Recent Developments
- 16.2.11.5. Financials (Based on Availability)
- 16.2.12 MicroStrategy Inc *List Not Exhaustive
- 16.2.12.1. Overview
- 16.2.12.2. Products
- 16.2.12.3. SWOT Analysis
- 16.2.12.4. Recent Developments
- 16.2.12.5. Financials (Based on Availability)
- 16.2.1 SAS Institute Inc
List of Figures
- Figure 1: Global Data Visualization Industry Revenue Breakdown (Million, %) by Region 2024 & 2032
- Figure 2: North America Data Visualization Industry Revenue (Million), by Country 2024 & 2032
- Figure 3: North America Data Visualization Industry Revenue Share (%), by Country 2024 & 2032
- Figure 4: Europe Data Visualization Industry Revenue (Million), by Country 2024 & 2032
- Figure 5: Europe Data Visualization Industry Revenue Share (%), by Country 2024 & 2032
- Figure 6: Asia Pacific Data Visualization Industry Revenue (Million), by Country 2024 & 2032
- Figure 7: Asia Pacific Data Visualization Industry Revenue Share (%), by Country 2024 & 2032
- Figure 8: Latin America Data Visualization Industry Revenue (Million), by Country 2024 & 2032
- Figure 9: Latin America Data Visualization Industry Revenue Share (%), by Country 2024 & 2032
- Figure 10: Middle East and Africa Data Visualization Industry Revenue (Million), by Country 2024 & 2032
- Figure 11: Middle East and Africa Data Visualization Industry Revenue Share (%), by Country 2024 & 2032
- Figure 12: North America Data Visualization Industry Revenue (Million), by Organizational Department 2024 & 2032
- Figure 13: North America Data Visualization Industry Revenue Share (%), by Organizational Department 2024 & 2032
- Figure 14: North America Data Visualization Industry Revenue (Million), by Deployment Mode 2024 & 2032
- Figure 15: North America Data Visualization Industry Revenue Share (%), by Deployment Mode 2024 & 2032
- Figure 16: North America Data Visualization Industry Revenue (Million), by End User 2024 & 2032
- Figure 17: North America Data Visualization Industry Revenue Share (%), by End User 2024 & 2032
- Figure 18: North America Data Visualization Industry Revenue (Million), by Country 2024 & 2032
- Figure 19: North America Data Visualization Industry Revenue Share (%), by Country 2024 & 2032
- Figure 20: Europe Data Visualization Industry Revenue (Million), by Organizational Department 2024 & 2032
- Figure 21: Europe Data Visualization Industry Revenue Share (%), by Organizational Department 2024 & 2032
- Figure 22: Europe Data Visualization Industry Revenue (Million), by Deployment Mode 2024 & 2032
- Figure 23: Europe Data Visualization Industry Revenue Share (%), by Deployment Mode 2024 & 2032
- Figure 24: Europe Data Visualization Industry Revenue (Million), by End User 2024 & 2032
- Figure 25: Europe Data Visualization Industry Revenue Share (%), by End User 2024 & 2032
- Figure 26: Europe Data Visualization Industry Revenue (Million), by Country 2024 & 2032
- Figure 27: Europe Data Visualization Industry Revenue Share (%), by Country 2024 & 2032
- Figure 28: Asia Pacific Data Visualization Industry Revenue (Million), by Organizational Department 2024 & 2032
- Figure 29: Asia Pacific Data Visualization Industry Revenue Share (%), by Organizational Department 2024 & 2032
- Figure 30: Asia Pacific Data Visualization Industry Revenue (Million), by Deployment Mode 2024 & 2032
- Figure 31: Asia Pacific Data Visualization Industry Revenue Share (%), by Deployment Mode 2024 & 2032
- Figure 32: Asia Pacific Data Visualization Industry Revenue (Million), by End User 2024 & 2032
- Figure 33: Asia Pacific Data Visualization Industry Revenue Share (%), by End User 2024 & 2032
- Figure 34: Asia Pacific Data Visualization Industry Revenue (Million), by Country 2024 & 2032
- Figure 35: Asia Pacific Data Visualization Industry Revenue Share (%), by Country 2024 & 2032
- Figure 36: Latin America Data Visualization Industry Revenue (Million), by Organizational Department 2024 & 2032
- Figure 37: Latin America Data Visualization Industry Revenue Share (%), by Organizational Department 2024 & 2032
- Figure 38: Latin America Data Visualization Industry Revenue (Million), by Deployment Mode 2024 & 2032
- Figure 39: Latin America Data Visualization Industry Revenue Share (%), by Deployment Mode 2024 & 2032
- Figure 40: Latin America Data Visualization Industry Revenue (Million), by End User 2024 & 2032
- Figure 41: Latin America Data Visualization Industry Revenue Share (%), by End User 2024 & 2032
- Figure 42: Latin America Data Visualization Industry Revenue (Million), by Country 2024 & 2032
- Figure 43: Latin America Data Visualization Industry Revenue Share (%), by Country 2024 & 2032
- Figure 44: Middle East and Africa Data Visualization Industry Revenue (Million), by Organizational Department 2024 & 2032
- Figure 45: Middle East and Africa Data Visualization Industry Revenue Share (%), by Organizational Department 2024 & 2032
- Figure 46: Middle East and Africa Data Visualization Industry Revenue (Million), by Deployment Mode 2024 & 2032
- Figure 47: Middle East and Africa Data Visualization Industry Revenue Share (%), by Deployment Mode 2024 & 2032
- Figure 48: Middle East and Africa Data Visualization Industry Revenue (Million), by End User 2024 & 2032
- Figure 49: Middle East and Africa Data Visualization Industry Revenue Share (%), by End User 2024 & 2032
- Figure 50: Middle East and Africa Data Visualization Industry Revenue (Million), by Country 2024 & 2032
- Figure 51: Middle East and Africa Data Visualization Industry Revenue Share (%), by Country 2024 & 2032
List of Tables
- Table 1: Global Data Visualization Industry Revenue Million Forecast, by Region 2019 & 2032
- Table 2: Global Data Visualization Industry Revenue Million Forecast, by Organizational Department 2019 & 2032
- Table 3: Global Data Visualization Industry Revenue Million Forecast, by Deployment Mode 2019 & 2032
- Table 4: Global Data Visualization Industry Revenue Million Forecast, by End User 2019 & 2032
- Table 5: Global Data Visualization Industry Revenue Million Forecast, by Region 2019 & 2032
- Table 6: Global Data Visualization Industry Revenue Million Forecast, by Country 2019 & 2032
- Table 7: Data Visualization Industry Revenue (Million) Forecast, by Application 2019 & 2032
- Table 8: Global Data Visualization Industry Revenue Million Forecast, by Country 2019 & 2032
- Table 9: Data Visualization Industry Revenue (Million) Forecast, by Application 2019 & 2032
- Table 10: Global Data Visualization Industry Revenue Million Forecast, by Country 2019 & 2032
- Table 11: Data Visualization Industry Revenue (Million) Forecast, by Application 2019 & 2032
- Table 12: Global Data Visualization Industry Revenue Million Forecast, by Country 2019 & 2032
- Table 13: Data Visualization Industry Revenue (Million) Forecast, by Application 2019 & 2032
- Table 14: Global Data Visualization Industry Revenue Million Forecast, by Country 2019 & 2032
- Table 15: Data Visualization Industry Revenue (Million) Forecast, by Application 2019 & 2032
- Table 16: Global Data Visualization Industry Revenue Million Forecast, by Organizational Department 2019 & 2032
- Table 17: Global Data Visualization Industry Revenue Million Forecast, by Deployment Mode 2019 & 2032
- Table 18: Global Data Visualization Industry Revenue Million Forecast, by End User 2019 & 2032
- Table 19: Global Data Visualization Industry Revenue Million Forecast, by Country 2019 & 2032
- Table 20: Global Data Visualization Industry Revenue Million Forecast, by Organizational Department 2019 & 2032
- Table 21: Global Data Visualization Industry Revenue Million Forecast, by Deployment Mode 2019 & 2032
- Table 22: Global Data Visualization Industry Revenue Million Forecast, by End User 2019 & 2032
- Table 23: Global Data Visualization Industry Revenue Million Forecast, by Country 2019 & 2032
- Table 24: Global Data Visualization Industry Revenue Million Forecast, by Organizational Department 2019 & 2032
- Table 25: Global Data Visualization Industry Revenue Million Forecast, by Deployment Mode 2019 & 2032
- Table 26: Global Data Visualization Industry Revenue Million Forecast, by End User 2019 & 2032
- Table 27: Global Data Visualization Industry Revenue Million Forecast, by Country 2019 & 2032
- Table 28: Global Data Visualization Industry Revenue Million Forecast, by Organizational Department 2019 & 2032
- Table 29: Global Data Visualization Industry Revenue Million Forecast, by Deployment Mode 2019 & 2032
- Table 30: Global Data Visualization Industry Revenue Million Forecast, by End User 2019 & 2032
- Table 31: Global Data Visualization Industry Revenue Million Forecast, by Country 2019 & 2032
- Table 32: Global Data Visualization Industry Revenue Million Forecast, by Organizational Department 2019 & 2032
- Table 33: Global Data Visualization Industry Revenue Million Forecast, by Deployment Mode 2019 & 2032
- Table 34: Global Data Visualization Industry Revenue Million Forecast, by End User 2019 & 2032
- Table 35: Global Data Visualization Industry Revenue Million Forecast, by Country 2019 & 2032
Frequently Asked Questions
1. What is the projected Compound Annual Growth Rate (CAGR) of the Data Visualization Industry?
The projected CAGR is approximately 10.95%.
2. Which companies are prominent players in the Data Visualization Industry?
Key companies in the market include SAS Institute Inc, InetSoft Technology Corporation, TIBCO Software Inc, IBM Corporation, Microsoft Corporation, Pentaho Corporation, Dundas Data Visualization Inc, Information Builders, Oracle Corporation, Salesforce com Inc (Tableau Software Inc ), SAP SE, MicroStrategy Inc *List Not Exhaustive.
3. What are the main segments of the Data Visualization Industry?
The market segments include Organizational Department, Deployment Mode, End User.
4. Can you provide details about the market size?
The market size is estimated to be USD 9.84 Million as of 2022.
5. What are some drivers contributing to market growth?
Cloud Deployment of Data Visualization Solutions; Increasing Need for Quick Decision Making.
6. What are the notable trends driving market growth?
Retail Segment to Witness Significant Growth.
7. Are there any restraints impacting market growth?
Lack of Tech Savvy and Skilled Workforce/Inability.
8. Can you provide examples of recent developments in the market?
September 2022: KPI 360, an AI-driven solution that uses real-time data monitoring and prediction to assist manufacturing organizations in seeing various operational data sources through a single, comprehensive industrial intelligence dashboard that sets up in hours, was recently unveiled by SymphonyAI Industrial.
9. What pricing options are available for accessing the report?
Pricing options include single-user, multi-user, and enterprise licenses priced at USD 4750, USD 5250, and USD 8750 respectively.
10. Is the market size provided in terms of value or volume?
The market size is provided in terms of value, measured in Million.
11. Are there any specific market keywords associated with the report?
Yes, the market keyword associated with the report is "Data Visualization Industry," which aids in identifying and referencing the specific market segment covered.
12. How do I determine which pricing option suits my needs best?
The pricing options vary based on user requirements and access needs. Individual users may opt for single-user licenses, while businesses requiring broader access may choose multi-user or enterprise licenses for cost-effective access to the report.
13. Are there any additional resources or data provided in the Data Visualization Industry report?
While the report offers comprehensive insights, it's advisable to review the specific contents or supplementary materials provided to ascertain if additional resources or data are available.
14. How can I stay updated on further developments or reports in the Data Visualization Industry?
To stay informed about further developments, trends, and reports in the Data Visualization Industry, consider subscribing to industry newsletters, following relevant companies and organizations, or regularly checking reputable industry news sources and publications.
Methodology
Step 1 - Identification of Relevant Samples Size from Population Database


Step 2 - Approaches for Defining Global Market Size (Value, Volume* & Price*)

Note*: In applicable scenarios
Step 3 - Data Sources
Primary Research
- Web Analytics
- Survey Reports
- Research Institute
- Latest Research Reports
- Opinion Leaders
Secondary Research
- Annual Reports
- White Paper
- Latest Press Release
- Industry Association
- Paid Database
- Investor Presentations

Step 4 - Data Triangulation
Involves using different sources of information in order to increase the validity of a study
These sources are likely to be stakeholders in a program - participants, other researchers, program staff, other community members, and so on.
Then we put all data in single framework & apply various statistical tools to find out the dynamic on the market.
During the analysis stage, feedback from the stakeholder groups would be compared to determine areas of agreement as well as areas of divergence


