

Key Insights
The global In-game Advertising Market is projected for significant expansion, anticipating a market size of $60.6 billion by 2024, with a Compound Annual Growth Rate (CAGR) of 11.1%. This growth is propelled by increasing global gaming penetration, the surge in mobile gaming popularity, and the integration of immersive technologies like AR and VR. Advertisers are leveraging in-game advertising for its unparalleled audience engagement and targeted reach, offering a unique platform for impactful brand interactions. Evolving ad formats, including interactive experiences and advergaming, further enhance brand engagement. Leading companies such as Blizzard Entertainment Inc., Electronic Arts Inc., and Google LLC are at the forefront of innovation in this dynamic sector.
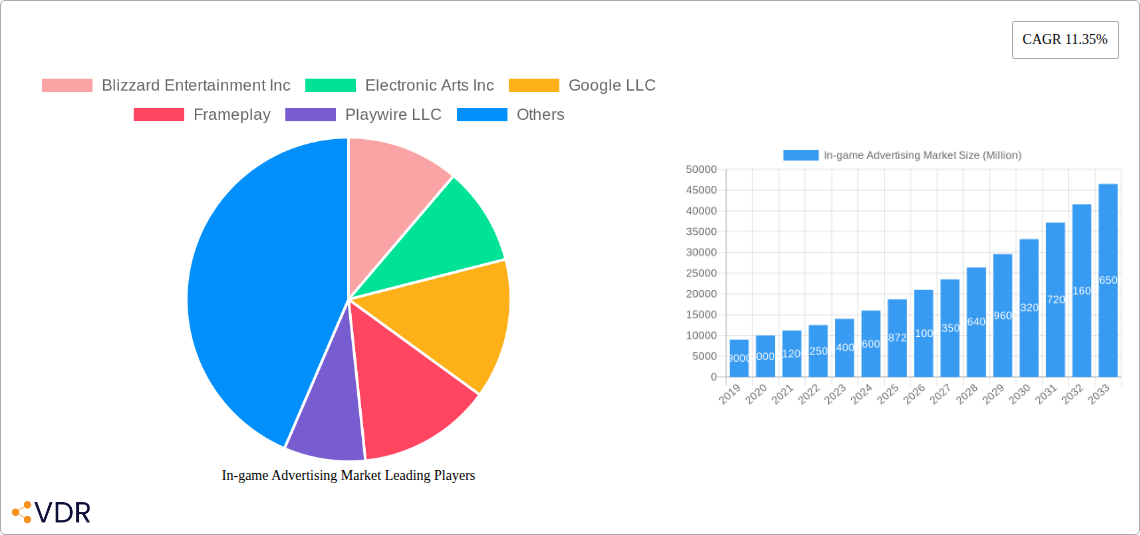
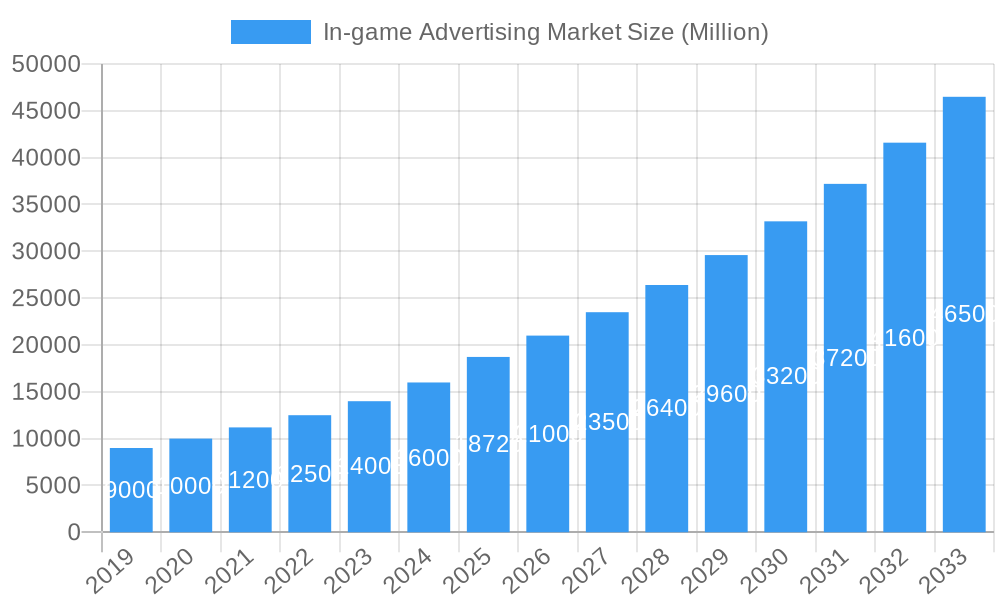
In-game Advertising Market Market Size (In Billion)
Key market trends include AI-driven ad personalization, the rise of gaming influencer marketing, and the demand for measurable ROI. While potential challenges like user ad fatigue and evolving privacy regulations exist, the extensive gaming hours and advanced targeting capabilities ensure robust market potential. North America and Europe are expected to maintain market leadership, supported by developed gaming infrastructure and high consumer spending. The Asia Pacific region is emerging as a significant growth hub, driven by a rapidly expanding gamer base and increasing smartphone adoption. The forecast period indicates sustained strong performance, cementing in-game advertising as a crucial element of the modern advertising strategy.
In-game Advertising Market Company Market Share
This report offers a comprehensive analysis of the in-game advertising market from 2024 to 2033. With a base year of 2024, the study provides in-depth insights into market size, growth trends, dominant regions, and key players. We meticulously examine parent and child markets, delivering a granular understanding of this burgeoning sector.
In-game Advertising Market Dynamics & Structure
The in-game advertising market exhibits a moderately concentrated structure, with a blend of established tech giants, specialized ad tech firms, and game developers vying for market share. Technological innovation is a primary driver, fueled by advancements in AI-powered ad placement, real-time bidding, and sophisticated audience segmentation. Regulatory frameworks are evolving, with a growing emphasis on data privacy and ad transparency, influencing how advertisers engage with players. Competitive product substitutes include traditional digital advertising channels and emerging metaverse advertising opportunities. End-user demographics are diverse, encompassing a broad spectrum of age groups and gaming preferences, presenting both opportunities and challenges for targeted campaigns. Mergers and acquisitions (M&A) are a notable trend, as larger entities seek to integrate in-game advertising capabilities into their existing portfolios, driving consolidation and strategic partnerships. For instance, in 2023, there were approximately 15 significant M&A deals valued at over $50 million each, reflecting investor confidence in the sector. Innovation barriers include the technical complexity of seamless ad integration and the need to maintain an immersive player experience.
- Market Concentration: Moderate, with a mix of large corporations and specialized players.
- Technological Innovation Drivers: AI for ad placement, real-time bidding, granular audience segmentation.
- Regulatory Frameworks: Increasing focus on data privacy (GDPR, CCPA) and ad transparency.
- Competitive Product Substitutes: Traditional digital ads, social media advertising, emerging metaverse advertising.
- End-User Demographics: Wide-ranging, from casual mobile gamers to dedicated PC and console enthusiasts.
- M&A Trends: Growing, with strategic acquisitions by major tech and gaming companies.
- Innovation Barriers: Seamless ad integration, preserving player immersion, proving ROI.
In-game Advertising Market Growth Trends & Insights
The in-game advertising market is poised for exponential growth, projected to reach $18,500 million by 2033, with a Compound Annual Growth Rate (CAGR) of 22.5% from 2025 to 2033. This robust expansion is driven by a confluence of factors including the increasing penetration of gaming across all demographics and the insatiable demand for engaging and non-intrusive advertising solutions. By 2025, the estimated market size is $6,000 million, reflecting a significant uplift from the historical period of 2019-2024, which saw a CAGR of approximately 18.2%. Technological disruptions are at the forefront, with the advent of programmatic in-game advertising enabling real-time optimization and hyper-personalization of ad creatives. This allows advertisers to deliver relevant messages to specific player segments within virtual environments, enhancing engagement and conversion rates. Consumer behavior shifts are also playing a crucial role; players are becoming more receptive to integrated advertising that complements the game world, moving away from overt interruptions. The rise of esports and influencer marketing further amplifies the reach and impact of in-game advertising, creating unique opportunities for brand visibility and product placement. As game development becomes more sophisticated, the integration of advertising is evolving from simple banners to dynamic billboards, interactive product placements, and even narrative-driven advergaming experiences. The penetration of in-game advertising within the broader digital advertising landscape is expected to climb from 4.5% in 2025 to an estimated 8.9% by 2033, underscoring its growing importance. Furthermore, the parent market, encompassing all forms of digital advertising, is projected to reach $1,200,000 million by 2033, with in-game advertising carving out an increasingly significant niche. The child market, focusing specifically on advergaming, is also anticipated to see substantial growth, driven by brands seeking deeper immersion and engagement.
Dominant Regions, Countries, or Segments in In-game Advertising Market
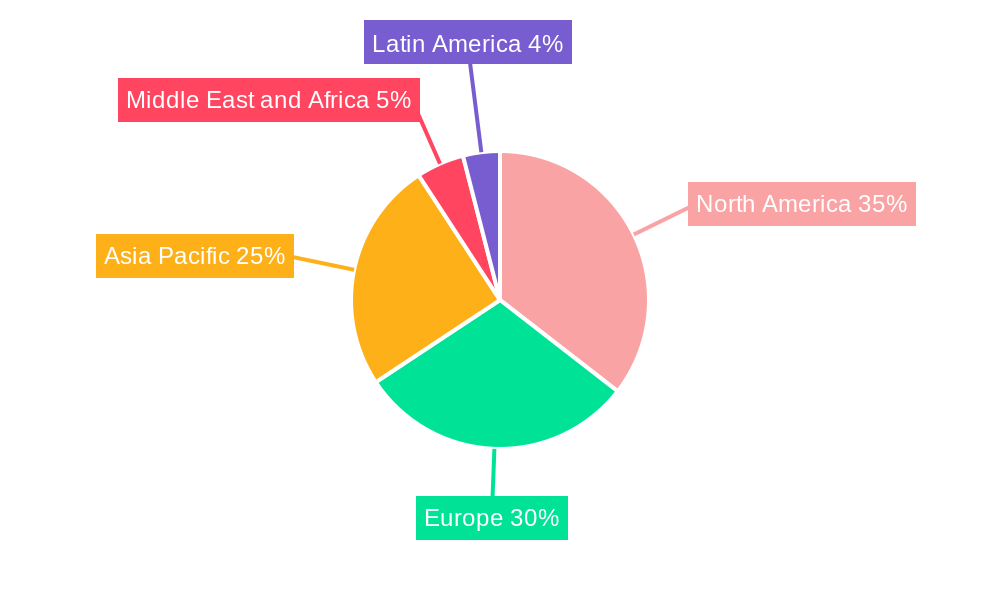
The in-game advertising market is currently experiencing its most significant growth and adoption within North America, driven by a robust gaming culture, high disposable income, and a mature digital advertising ecosystem. By 2025, North America is projected to hold a market share of approximately 38.5%, with an estimated market value of $2,310 million. This dominance is fueled by several key factors, including widespread adoption of high-speed internet, a large and engaged gaming population across various platforms (PC, console, mobile), and a concentration of leading game development studios and advertising technology providers. Economic policies in the region are generally supportive of technological innovation and digital commerce, creating a fertile ground for new advertising models. The infrastructure for digital advertising, including programmatic platforms and data analytics, is highly developed, enabling efficient campaign deployment and measurement.
Among the segments, Dynamic in-game advertising is emerging as the dominant force, expected to capture 45% of the market share by 2025, valued at $2,700 million. This segment's growth is propelled by its ability to deliver contextually relevant and personalized advertisements that adapt in real-time based on player behavior, game progression, and demographic data. Unlike static ads, dynamic ads seamlessly integrate into the game environment, appearing as billboards, posters, or even in-game products, thus minimizing disruption and enhancing player immersion. This adaptability allows for greater creative flexibility and targeted messaging, leading to higher engagement rates and improved ROI for advertisers. The technological advancements in AI and machine learning are crucial enablers for dynamic ad delivery, allowing for sophisticated audience segmentation and real-time ad serving.
- Dominant Region: North America
- Market Share (2025): ~38.5%
- Estimated Market Value (2025): $2,310 million
- Key Drivers: High gaming penetration, strong digital infrastructure, leading tech companies, supportive economic policies.
- Dominant Segment: Dynamic In-game Advertising
- Market Share (2025): ~45%
- Estimated Market Value (2025): $2,700 million
- Key Drivers: Real-time relevance, personalization, seamless integration, advanced AI/ML capabilities, higher engagement rates.
In-game Advertising Market Product Landscape
The in-game advertising market is characterized by a rapidly evolving product landscape. Innovations are focused on enhancing ad realism and player engagement. Dynamic ads, such as virtual billboards displaying real-time product promotions or sponsorships, and interactive product placements that allow players to virtually interact with advertised items, are gaining traction. Advergaming, the creation of entire mini-games around a brand, offers deep brand immersion. Performance metrics are increasingly sophisticated, moving beyond simple impressions to track engagement rates, click-throughs within the game context, and even in-game purchases attributed to advertising. Unique selling propositions lie in the ability to reach highly engaged audiences in a captive environment, offering brands unparalleled brand recall and association. Technological advancements in AR/VR integration also promise new frontiers for immersive in-game advertising experiences.
Key Drivers, Barriers & Challenges in In-game Advertising Market
The in-game advertising market is propelled by several key drivers. The explosion in global gaming penetration, reaching over 3.3 billion players by 2025, presents an enormous, engaged audience. The increasing sophistication of game engines allows for seamless integration of dynamic and interactive ads, enhancing player experience rather than disrupting it. Furthermore, the ability to leverage rich player data for hyper-targeted campaigns offers advertisers unprecedented precision. Growth accelerators include the rising popularity of mobile gaming and the expansion of esports viewership.
However, the market faces significant barriers and challenges. A primary concern is player perception; intrusive or irrelevant ads can lead to negative brand association and player churn. The technical complexity of integrating and measuring ad performance across diverse game platforms and devices poses a significant hurdle. Regulatory compliance regarding data privacy and ad transparency, particularly under frameworks like GDPR and CCPA, requires careful navigation. Supply chain issues, such as ensuring ad quality and preventing ad fraud within game environments, remain ongoing challenges. Competitive pressures from other digital advertising channels also necessitate continuous innovation. The estimated cost of developing and integrating advanced ad solutions can range from $50,000 to $500,000, posing an investment barrier for smaller developers.
Emerging Opportunities in In-game Advertising Market
Emerging opportunities within the in-game advertising market are vast and continue to expand. The metaverse presents a frontier for fully immersive and interactive brand experiences, blurring the lines between virtual worlds and advertising. The rise of user-generated content (UGC) platforms within games offers opportunities for brands to sponsor creator content and virtual items. Furthermore, the increasing integration of augmented reality (AR) into mobile gaming opens avenues for location-based in-game advertising. The development of more sophisticated AI-driven ad personalization will enable hyper-relevant ad delivery, increasing effectiveness. The potential for influencer marketing integrations, where streamers and professional gamers naturally incorporate brand promotions, is also a significant growth area.
Growth Accelerators in the In-game Advertising Market Industry
Several factors are accelerating the growth of the in-game advertising industry. Technological breakthroughs in programmatic advertising and AI are enabling more efficient and effective ad delivery and targeting. Strategic partnerships between game developers, ad tech companies, and brands are crucial for creating innovative campaigns and expanding market reach. The continuous growth in mobile gaming, with its massive user base, provides a consistent influx of potential customers. Furthermore, the increasing demand for measurable ROI from advertisers is pushing the industry towards more data-driven and transparent solutions, which in turn fuels further investment and innovation. The expansion of esports leagues and the professionalization of gaming are also creating new avenues for sponsorships and brand visibility, acting as significant growth catalysts.
Key Players Shaping the In-game Advertising Market Market
- Blizzard Entertainment Inc
- Electronic Arts Inc
- Google LLC
- Frameplay
- Playwire LLC
- Motive Interactive Inc
- ironSource Ltd
- RapidFire Inc
- Anzu Virtual Reality Ltd
Notable Milestones in In-game Advertising Market Sector
- 2019: Launch of Anzu Virtual Reality Ltd, focusing on VR in-game advertising solutions.
- 2020: RapidFire Inc. secures significant funding to scale its in-game ad network.
- 2021: Electronic Arts Inc. expands its in-game advertising capabilities through strategic partnerships.
- 2022: Motive Interactive Inc. reports a substantial increase in ad engagement rates for its clients.
- 2023: Frameplay announces a major expansion of its platform to support a wider range of game genres.
- 2024: ironSource Ltd. integrates advanced AI for real-time ad optimization within its SDK.
In-Depth In-game Advertising Market Market Outlook
The outlook for the in-game advertising market is exceptionally positive, driven by robust growth accelerators and emerging opportunities. The continued evolution of gaming technologies, coupled with increasing advertiser demand for engaged audiences, will solidify in-game advertising as a core component of digital marketing strategies. Strategic partnerships and market expansion efforts will broaden reach and foster greater innovation. The sustained growth in mobile gaming and the burgeoning metaverse offer substantial untapped potential. As the industry matures, greater transparency and improved measurement capabilities will further instill confidence, attracting larger advertising budgets and solidifying its position as a pivotal advertising channel for years to come.
In-game Advertising Market Segmentation
-
1. Type
- 1.1. Static
- 1.2. Dynamic
- 1.3. Advergaming
In-game Advertising Market Segmentation By Geography
- 1. North America
- 2. Europe
- 3. Asia Pacific
- 4. Middle East and Africa
- 5. Latin America
In-game Advertising Market Regional Market Share
Geographic Coverage of In-game Advertising Market
In-game Advertising Market REPORT HIGHLIGHTS
| Aspects | Details |
|---|---|
| Study Period | 2020-2034 |
| Base Year | 2025 |
| Estimated Year | 2026 |
| Forecast Period | 2026-2034 |
| Historical Period | 2020-2025 |
| Growth Rate | CAGR of 11.1% from 2020-2034 |
| Segmentation |
|
Table of Contents
- 1. Introduction
- 1.1. Research Scope
- 1.2. Market Segmentation
- 1.3. Research Objective
- 1.4. Definitions and Assumptions
- 2. Executive Summary
- 2.1. Market Snapshot
- 3. Market Dynamics
- 3.1. Market Drivers
- 3.2. Market Restrains
- 3.3. Market Trends
- 3.4. Market Opportunities
- 4. Market Factor Analysis
- 4.1. Porters Five Forces
- 4.1.1. Bargaining Power of Suppliers
- 4.1.2. Bargaining Power of Buyers
- 4.1.3. Threat of New Entrants
- 4.1.4. Threat of Substitutes
- 4.1.5. Competitive Rivalry
- 4.2. PESTEL analysis
- 4.3. BCG Analysis
- 4.3.1. Stars (High Growth, High Market Share)
- 4.3.2. Cash Cows (Low Growth, High Market Share)
- 4.3.3. Question Mark (High Growth, Low Market Share)
- 4.3.4. Dogs (Low Growth, Low Market Share)
- 4.4. Ansoff Matrix Analysis
- 4.5. Supply Chain Analysis
- 4.6. Regulatory Landscape
- 4.7. Current Market Potential and Opportunity Assessment (TAM–SAM–SOM Framework)
- 4.8. VDR Analyst Note
- 4.1. Porters Five Forces
- 5. Market Analysis, Insights and Forecast 2021-2033
- 5.1. Market Analysis, Insights and Forecast - by Type
- 5.1.1. Static
- 5.1.2. Dynamic
- 5.1.3. Advergaming
- 5.2. Market Analysis, Insights and Forecast - by Region
- 5.2.1. North America
- 5.2.2. Europe
- 5.2.3. Asia Pacific
- 5.2.4. Middle East and Africa
- 5.2.5. Latin America
- 5.1. Market Analysis, Insights and Forecast - by Type
- 6. Global In-game Advertising Market Analysis, Insights and Forecast, 2021-2033
- 6.1. Market Analysis, Insights and Forecast - by Type
- 6.1.1. Static
- 6.1.2. Dynamic
- 6.1.3. Advergaming
- 6.1. Market Analysis, Insights and Forecast - by Type
- 7. North America In-game Advertising Market Analysis, Insights and Forecast, 2021-2033
- 7.1. Market Analysis, Insights and Forecast - by Type
- 7.1.1. Static
- 7.1.2. Dynamic
- 7.1.3. Advergaming
- 7.1. Market Analysis, Insights and Forecast - by Type
- 8. Europe In-game Advertising Market Analysis, Insights and Forecast, 2021-2033
- 8.1. Market Analysis, Insights and Forecast - by Type
- 8.1.1. Static
- 8.1.2. Dynamic
- 8.1.3. Advergaming
- 8.1. Market Analysis, Insights and Forecast - by Type
- 9. Asia Pacific In-game Advertising Market Analysis, Insights and Forecast, 2021-2033
- 9.1. Market Analysis, Insights and Forecast - by Type
- 9.1.1. Static
- 9.1.2. Dynamic
- 9.1.3. Advergaming
- 9.1. Market Analysis, Insights and Forecast - by Type
- 10. Middle East and Africa In-game Advertising Market Analysis, Insights and Forecast, 2021-2033
- 10.1. Market Analysis, Insights and Forecast - by Type
- 10.1.1. Static
- 10.1.2. Dynamic
- 10.1.3. Advergaming
- 10.1. Market Analysis, Insights and Forecast - by Type
- 11. Latin America In-game Advertising Market Analysis, Insights and Forecast, 2021-2033
- 11.1. Market Analysis, Insights and Forecast - by Type
- 11.1.1. Static
- 11.1.2. Dynamic
- 11.1.3. Advergaming
- 11.1. Market Analysis, Insights and Forecast - by Type
- 12. Competitive Analysis
- 12.1. Company Profiles
- 12.1.1 Blizzard Entertainment Inc
- 12.1.1.1. Company Overview
- 12.1.1.2. Products
- 12.1.1.3. Company Financials
- 12.1.1.4. SWOT Analysis
- 12.1.2 Electronic Arts Inc
- 12.1.2.1. Company Overview
- 12.1.2.2. Products
- 12.1.2.3. Company Financials
- 12.1.2.4. SWOT Analysis
- 12.1.3 Google LLC
- 12.1.3.1. Company Overview
- 12.1.3.2. Products
- 12.1.3.3. Company Financials
- 12.1.3.4. SWOT Analysis
- 12.1.4 Frameplay
- 12.1.4.1. Company Overview
- 12.1.4.2. Products
- 12.1.4.3. Company Financials
- 12.1.4.4. SWOT Analysis
- 12.1.5 Playwire LLC
- 12.1.5.1. Company Overview
- 12.1.5.2. Products
- 12.1.5.3. Company Financials
- 12.1.5.4. SWOT Analysis
- 12.1.6 Motive Interactive Inc
- 12.1.6.1. Company Overview
- 12.1.6.2. Products
- 12.1.6.3. Company Financials
- 12.1.6.4. SWOT Analysis
- 12.1.7 ironSource Ltd
- 12.1.7.1. Company Overview
- 12.1.7.2. Products
- 12.1.7.3. Company Financials
- 12.1.7.4. SWOT Analysis
- 12.1.8 RapidFire Inc
- 12.1.8.1. Company Overview
- 12.1.8.2. Products
- 12.1.8.3. Company Financials
- 12.1.8.4. SWOT Analysis
- 12.1.9 Anzu Virtual Reality Ltd
- 12.1.9.1. Company Overview
- 12.1.9.2. Products
- 12.1.9.3. Company Financials
- 12.1.9.4. SWOT Analysis
- 12.1.1 Blizzard Entertainment Inc
- 12.2. Market Entropy
- 12.2.1 Company's Key Areas Served
- 12.2.2 Recent Developments
- 12.3. Company Market Share Analysis 2025
- 12.3.1 Top 5 Companies Market Share Analysis
- 12.3.2 Top 3 Companies Market Share Analysis
- 12.4. List of Potential Customers
- 13. Research Methodology
List of Figures
- Figure 1: Global In-game Advertising Market Revenue Breakdown (billion, %) by Region 2025 & 2033
- Figure 2: North America In-game Advertising Market Revenue (billion), by Type 2025 & 2033
- Figure 3: North America In-game Advertising Market Revenue Share (%), by Type 2025 & 2033
- Figure 4: North America In-game Advertising Market Revenue (billion), by Country 2025 & 2033
- Figure 5: North America In-game Advertising Market Revenue Share (%), by Country 2025 & 2033
- Figure 6: Europe In-game Advertising Market Revenue (billion), by Type 2025 & 2033
- Figure 7: Europe In-game Advertising Market Revenue Share (%), by Type 2025 & 2033
- Figure 8: Europe In-game Advertising Market Revenue (billion), by Country 2025 & 2033
- Figure 9: Europe In-game Advertising Market Revenue Share (%), by Country 2025 & 2033
- Figure 10: Asia Pacific In-game Advertising Market Revenue (billion), by Type 2025 & 2033
- Figure 11: Asia Pacific In-game Advertising Market Revenue Share (%), by Type 2025 & 2033
- Figure 12: Asia Pacific In-game Advertising Market Revenue (billion), by Country 2025 & 2033
- Figure 13: Asia Pacific In-game Advertising Market Revenue Share (%), by Country 2025 & 2033
- Figure 14: Middle East and Africa In-game Advertising Market Revenue (billion), by Type 2025 & 2033
- Figure 15: Middle East and Africa In-game Advertising Market Revenue Share (%), by Type 2025 & 2033
- Figure 16: Middle East and Africa In-game Advertising Market Revenue (billion), by Country 2025 & 2033
- Figure 17: Middle East and Africa In-game Advertising Market Revenue Share (%), by Country 2025 & 2033
- Figure 18: Latin America In-game Advertising Market Revenue (billion), by Type 2025 & 2033
- Figure 19: Latin America In-game Advertising Market Revenue Share (%), by Type 2025 & 2033
- Figure 20: Latin America In-game Advertising Market Revenue (billion), by Country 2025 & 2033
- Figure 21: Latin America In-game Advertising Market Revenue Share (%), by Country 2025 & 2033
List of Tables
- Table 1: Global In-game Advertising Market Revenue billion Forecast, by Type 2020 & 2033
- Table 2: Global In-game Advertising Market Revenue billion Forecast, by Region 2020 & 2033
- Table 3: Global In-game Advertising Market Revenue billion Forecast, by Type 2020 & 2033
- Table 4: Global In-game Advertising Market Revenue billion Forecast, by Country 2020 & 2033
- Table 5: Global In-game Advertising Market Revenue billion Forecast, by Type 2020 & 2033
- Table 6: Global In-game Advertising Market Revenue billion Forecast, by Country 2020 & 2033
- Table 7: Global In-game Advertising Market Revenue billion Forecast, by Type 2020 & 2033
- Table 8: Global In-game Advertising Market Revenue billion Forecast, by Country 2020 & 2033
- Table 9: Global In-game Advertising Market Revenue billion Forecast, by Type 2020 & 2033
- Table 10: Global In-game Advertising Market Revenue billion Forecast, by Country 2020 & 2033
- Table 11: Global In-game Advertising Market Revenue billion Forecast, by Type 2020 & 2033
- Table 12: Global In-game Advertising Market Revenue billion Forecast, by Country 2020 & 2033
Frequently Asked Questions
1. What is the projected Compound Annual Growth Rate (CAGR) of the In-game Advertising Market?
The projected CAGR is approximately 11.1%.
2. Which companies are prominent players in the In-game Advertising Market?
Key companies in the market include Blizzard Entertainment Inc, Electronic Arts Inc, Google LLC, Frameplay, Playwire LLC, Motive Interactive Inc, ironSource Ltd, RapidFire Inc, Anzu Virtual Reality Ltd.
3. What are the main segments of the In-game Advertising Market?
The market segments include Type.
4. Can you provide details about the market size?
The market size is estimated to be USD 60.6 billion as of 2022.
5. What are some drivers contributing to market growth?
Increase in Online Gaming; Growth in the Smartphone Penetration.
6. What are the notable trends driving market growth?
Increase in Online Gaming is Expected to Drive the Market.
7. Are there any restraints impacting market growth?
Incremental Advancements in Smartphones.
8. Can you provide examples of recent developments in the market?
N/A
9. What pricing options are available for accessing the report?
Pricing options include single-user, multi-user, and enterprise licenses priced at USD 4750, USD 5250, and USD 8750 respectively.
10. Is the market size provided in terms of value or volume?
The market size is provided in terms of value, measured in billion.
11. Are there any specific market keywords associated with the report?
Yes, the market keyword associated with the report is "In-game Advertising Market," which aids in identifying and referencing the specific market segment covered.
12. How do I determine which pricing option suits my needs best?
The pricing options vary based on user requirements and access needs. Individual users may opt for single-user licenses, while businesses requiring broader access may choose multi-user or enterprise licenses for cost-effective access to the report.
13. Are there any additional resources or data provided in the In-game Advertising Market report?
While the report offers comprehensive insights, it's advisable to review the specific contents or supplementary materials provided to ascertain if additional resources or data are available.
14. How can I stay updated on further developments or reports in the In-game Advertising Market?
To stay informed about further developments, trends, and reports in the In-game Advertising Market, consider subscribing to industry newsletters, following relevant companies and organizations, or regularly checking reputable industry news sources and publications.
Methodology
Step 1 - Identification of Relevant Samples Size from Population Database


Step 2 - Approaches for Defining Global Market Size (Value, Volume* & Price*)

Note*: In applicable scenarios
Step 3 - Data Sources
Primary Research
- Web Analytics
- Survey Reports
- Research Institute
- Latest Research Reports
- Opinion Leaders
Secondary Research
- Annual Reports
- White Paper
- Latest Press Release
- Industry Association
- Paid Database
- Investor Presentations

Step 4 - Data Triangulation
Involves using different sources of information in order to increase the validity of a study
These sources are likely to be stakeholders in a program - participants, other researchers, program staff, other community members, and so on.
Then we put all data in single framework & apply various statistical tools to find out the dynamic on the market.
During the analysis stage, feedback from the stakeholder groups would be compared to determine areas of agreement as well as areas of divergence