

Key Insights
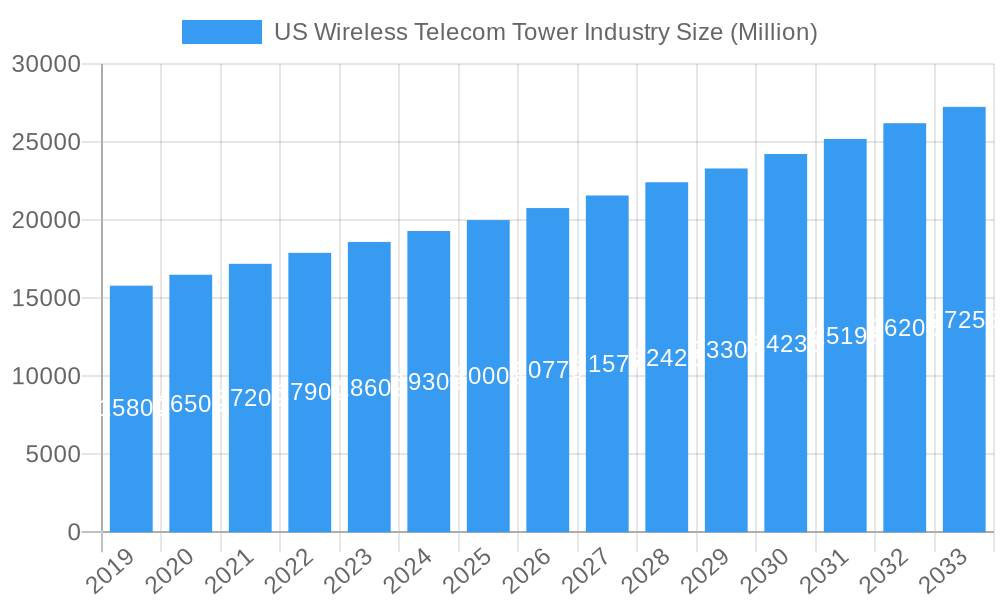
The US Wireless Telecom Tower Industry is projected for substantial growth, with an estimated market size of $14.1 billion by 2025, growing at a Compound Annual Growth Rate (CAGR) of 4.7% through 2033. This expansion is driven by increasing demand for enhanced mobile broadband, ongoing 5G network deployment, and the need for denser tower infrastructure to support these advancements. The proliferation of data-intensive applications, the growth of the Internet of Things (IoT) ecosystem, and the consistent requirement for reliable wireless connectivity in both urban and rural areas are key growth catalysts. Strategic investments in network upgrades by major Mobile Network Operators (MNOs) further underscore the industry's sustained upward trajectory.
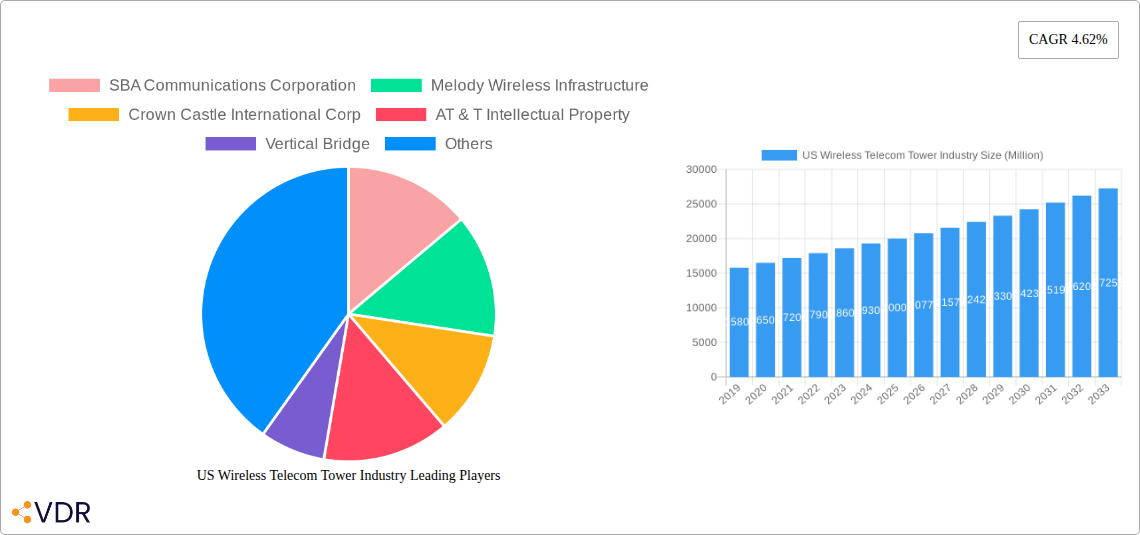
US Wireless Telecom Tower Industry Market Size (In Billion)
The market is shaped by key drivers and emerging trends. The demand for high-speed wireless access fuels investments in new tower construction and infrastructure acquisition. Trends such as the rise of small cells, edge computing integration, and the adoption of renewable energy for tower operations are defining the industry's future. Challenges include significant capital expenditure for new constructions, complex regulatory environments, and MNO consolidation which can influence lease agreements and infrastructure demand. The industry encompasses diverse operational strategies across various fuel types, installation methods, and ownership models. Key players include SBA Communications Corporation, Crown Castle International Corp, and Vertical Bridge, alongside emerging competitors.
US Wireless Telecom Tower Industry Company Market Share
This report offers an in-depth analysis of the US wireless telecom tower industry, providing critical insights into market dynamics, growth trajectories, and future opportunities. Utilizing extensive historical data from 2019-2024 and detailed forecasts for 2025-2033, this study is essential for stakeholders seeking to understand the evolving wireless infrastructure landscape. The report examines parent and child markets, segment performance, and strategic initiatives of leading companies, serving as a vital tool for investment and strategic planning. All monetary values are presented in billion units.
US Wireless Telecom Tower Industry Market Dynamics & Structure
The US wireless telecom tower industry exhibits a moderately concentrated market structure, dominated by a few key players who control a significant portion of tower infrastructure. Technological innovation, particularly the relentless demand for enhanced mobile broadband (eMBB) and the rollout of 5G networks, acts as a primary driver, necessitating continuous investment in new tower deployments and upgrades. Regulatory frameworks, while generally supportive of infrastructure expansion, can introduce complexities related to zoning, environmental approvals, and spectrum allocation. Competitive product substitutes, such as fiber optic networks and satellite broadband, exert indirect pressure, but the foundational need for robust wireless tower infrastructure remains paramount. End-user demographics are characterized by a growing reliance on mobile data, increasing smartphone penetration, and the proliferation of IoT devices, fueling demand for greater network capacity and coverage. Mergers and acquisitions (M&A) are a consistent feature, driven by the pursuit of economies of scale, portfolio consolidation, and strategic access to key markets.
- Market Concentration: Dominated by major tower companies with significant market share.
- Technological Innovation: Driven by 5G deployment, densification, and IoT integration.
- Regulatory Frameworks: Influenced by FCC regulations, local zoning laws, and spectrum policies.
- Competitive Substitutes: Fiber optics and satellite broadband, though distinct in their deployment models.
- End-User Demographics: Growing demand from consumers, enterprises, and government entities.
- M&A Trends: Ongoing consolidation for portfolio enhancement and market expansion.
US Wireless Telecom Tower Industry Growth Trends & Insights
The US wireless telecom tower industry has experienced robust growth driven by the insatiable demand for ubiquitous and high-speed wireless connectivity. Market size evolution has been characterized by consistent expansion, fueled by the ongoing 4G LTE densification and the transformative rollout of 5G technologies. Adoption rates for advanced wireless services are escalating, propelled by increasing consumer reliance on mobile devices for communication, entertainment, and productivity. Technological disruptions, such as the advent of massive MIMO, beamforming, and network slicing, are reshaping tower requirements and driving innovation in tower design and deployment strategies. Consumer behavior shifts, including the increasing adoption of video streaming, online gaming, and remote work, have significantly amplified the need for higher bandwidth and lower latency, directly impacting the demand for tower infrastructure. The forecast period (2025–2033) is anticipated to witness continued, strong growth, with a projected Compound Annual Growth Rate (CAGR) of xx%, driven by ongoing 5G expansion, the development of private wireless networks for enterprises, and the increasing demand for edge computing capabilities facilitated by distributed tower networks. Market penetration is expected to deepen as rural and underserved areas gain access to advanced wireless services.
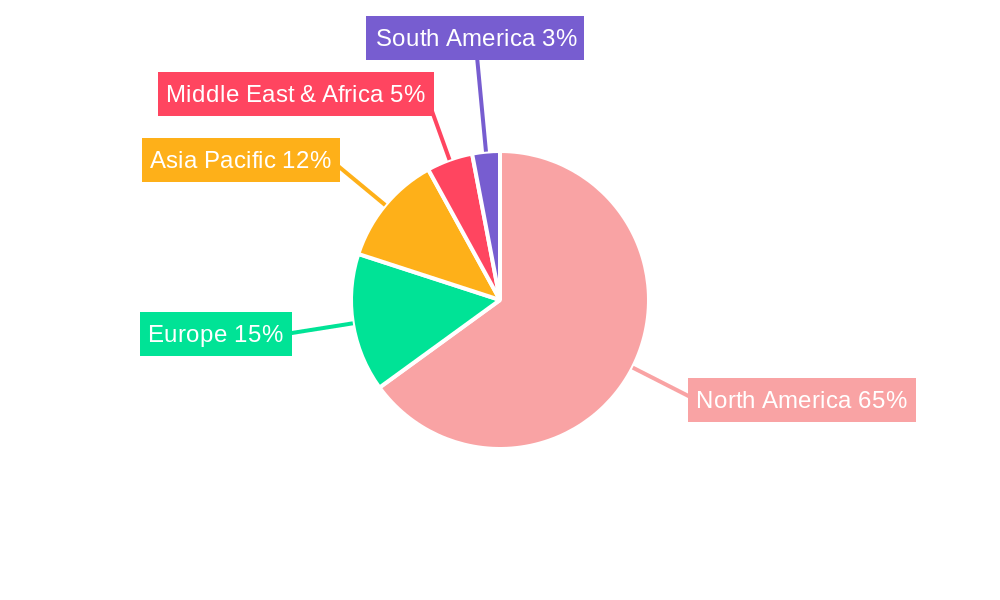
Dominant Regions, Countries, or Segments in US Wireless Telecom Tower Industry
The ground-based installation segment is poised to be a dominant force in driving market growth within the US wireless telecom tower industry. This dominance stems from its fundamental role in providing the core infrastructure for macro networks that offer widespread coverage. Ground-based towers are essential for supporting the deployment of 5G macro cells, which are critical for achieving broad geographic reach and enabling high-speed data services across urban, suburban, and rural landscapes.
- Ground-based Installation:
- Key Drivers: Essential for macro network coverage, supports 5G macro cells, critical for rural broadband initiatives, provides a stable platform for multiple tenant equipment.
- Market Share: Expected to hold a significant majority of the market share due to its foundational role.
- Growth Potential: High growth potential driven by the ongoing expansion of 5G networks and the need to replace aging infrastructure.
- Economic Policies: Supportive government initiatives for broadband expansion and infrastructure development directly benefit ground-based deployments.
- Infrastructure: Availability of suitable land and established construction capabilities facilitate rapid deployment.
While rooftop installations play a crucial role in urban densification and small cell deployments, the sheer scale and reach required for comprehensive national 5G coverage will continue to favor ground-based infrastructure as the primary growth engine. The non-renewable fuel type segment will remain dominant in powering tower infrastructure, though increasing attention is being paid to renewable energy integration for sustainability and cost efficiency. In terms of ownership, private-owned and joint venture models are expected to see substantial growth as independent tower companies and strategic partnerships emerge to meet the capital-intensive demands of network expansion.
US Wireless Telecom Tower Industry Product Landscape
The US wireless telecom tower industry product landscape is defined by increasing sophistication and customization to meet evolving network demands. Tower manufacturers and service providers are focusing on designing and deploying resilient, high-capacity structures capable of supporting advanced antenna systems and multiple tenants. Key product innovations include modular tower designs for faster deployment, lighter yet stronger materials for enhanced load-bearing capacity, and integrated solutions for power and cooling. Applications range from supporting traditional macro sites for 4G and 5G coverage to facilitating the deployment of small cells for urban densification and private wireless networks for enterprises. Performance metrics are increasingly centered on structural integrity, adaptability to future technology upgrades, and efficient space utilization for colocation.
Key Drivers, Barriers & Challenges in US Wireless Telecom Tower Industry
Key Drivers:
- 5G Network Expansion: The primary catalyst, requiring extensive new tower deployments and upgrades.
- Increasing Data Consumption: Growing demand for mobile data, streaming, and online services.
- IoT Proliferation: The rise of connected devices necessitates broader and more robust wireless coverage.
- Government Initiatives: Subsidies and policies promoting broadband expansion, particularly in rural areas.
- Technological Advancements: Evolution of wireless technologies demanding more sophisticated infrastructure.
Barriers & Challenges:
- High Capital Investment: Significant upfront costs for site acquisition, construction, and equipment.
- Regulatory Hurdles: Zoning regulations, permitting processes, and environmental compliance can cause delays.
- Site Acquisition Difficulties: Securing suitable locations can be challenging and time-consuming.
- Supply Chain Disruptions: Potential for material shortages and increased lead times for tower components.
- Competitive Pressures: Intense competition among tower companies and MNOs seeking optimal infrastructure.
- Spectrum Allocation Uncertainty: Future spectrum availability can influence long-term infrastructure planning.
Emerging Opportunities in US Wireless Telecom Tower Industry
Emerging opportunities in the US wireless telecom tower industry are centered on the expansive potential of private wireless networks for enterprises, smart city initiatives, and the increasing demand for edge computing infrastructure. The deployment of specialized towers to support these niche applications presents a significant growth avenue. Furthermore, the integration of renewable energy solutions for tower power presents both an environmental opportunity and a cost-saving measure for operators. The ongoing densification of urban areas and the need to support enhanced mobile broadband (eMBB) for applications like augmented reality (AR) and virtual reality (VR) will continue to drive demand for small cell deployments and innovative tower designs.
Growth Accelerators in the US Wireless Telecom Tower Industry Industry
Growth accelerators in the US wireless telecom tower industry are predominantly driven by the continuous demand for enhanced connectivity and the rapid evolution of wireless technologies. The persistent rollout of 5G networks, requiring significant investment in new tower construction and upgrades, remains the primary growth engine. Furthermore, the increasing adoption of IoT devices across various sectors, from smart homes to industrial automation, is creating a sustained demand for ubiquitous wireless coverage. Strategic partnerships between tower companies and Mobile Network Operators (MNOs) are crucial, facilitating infrastructure sharing and accelerating deployment timelines. Government initiatives aimed at expanding broadband access to underserved rural areas also act as a significant growth catalyst, opening up new markets for tower development.
Key Players Shaping the US Wireless Telecom Tower Industry Market
- SBA Communications Corporation
- Melody Wireless Infrastructure
- Crown Castle International Corp
- AT & T Intellectual Property
- Vertical Bridge
- Helios Towers plc
- Tillman Infrastructure LLC
- United States Cellular Co
- ATC IP LLC
- Insite Wireless Group
- BNSF Railroad
Notable Milestones in US Wireless Telecom Tower Industry Sector
- January 2022: T-Mobile US, Inc. and Crown Castle International Corp. announced a new 12-year collaboration, granting T-Mobile expanded access to Crown Castle's towers and small cell sites to bolster its national 5G network expansion.
- January 2022: American Tower Corporation completed the acquisition of CoreSite Realty Corporation through the merger of a wholly-owned subsidiary with and into CoreSite, aiming to leverage CoreSite's data center capabilities and cloud on-ramps for enhanced tower real estate value and growth.
In-Depth US Wireless Telecom Tower Industry Market Outlook
The in-depth US wireless telecom tower industry market outlook indicates a trajectory of sustained and significant growth. The ongoing 5G network expansion, coupled with the increasing demand for enhanced mobile broadband and the proliferation of IoT devices, will continue to be the primary growth drivers. Strategic investments in network densification, particularly in urban and suburban areas, alongside efforts to bridge the digital divide in rural regions, will create substantial opportunities for tower development and colocation. The report forecasts a robust market expansion, driven by technological innovation, favorable regulatory environments, and evolving consumer behavior, positioning the US wireless telecom tower industry as a critical enabler of the digital economy.
US Wireless Telecom Tower Industry Segmentation
-
1. Fuel Type
- 1.1. Renewable
- 1.2. Non-renewable
-
2. Installation
- 2.1. Rooftop
- 2.2. Ground-based
-
3. Ownership
- 3.1. Operator-owned
- 3.2. Joint Venture
- 3.3. Private-owned
- 3.4. MNO Captive
US Wireless Telecom Tower Industry Segmentation By Geography
-
1. North America
- 1.1. United States
- 1.2. Canada
- 1.3. Mexico
-
2. South America
- 2.1. Brazil
- 2.2. Argentina
- 2.3. Rest of South America
-
3. Europe
- 3.1. United Kingdom
- 3.2. Germany
- 3.3. France
- 3.4. Italy
- 3.5. Spain
- 3.6. Russia
- 3.7. Benelux
- 3.8. Nordics
- 3.9. Rest of Europe
-
4. Middle East & Africa
- 4.1. Turkey
- 4.2. Israel
- 4.3. GCC
- 4.4. North Africa
- 4.5. South Africa
- 4.6. Rest of Middle East & Africa
-
5. Asia Pacific
- 5.1. China
- 5.2. India
- 5.3. Japan
- 5.4. South Korea
- 5.5. ASEAN
- 5.6. Oceania
- 5.7. Rest of Asia Pacific
US Wireless Telecom Tower Industry Regional Market Share
Geographic Coverage of US Wireless Telecom Tower Industry
US Wireless Telecom Tower Industry REPORT HIGHLIGHTS
| Aspects | Details |
|---|---|
| Study Period | 2020-2034 |
| Base Year | 2025 |
| Estimated Year | 2026 |
| Forecast Period | 2026-2034 |
| Historical Period | 2020-2025 |
| Growth Rate | CAGR of 4.7% from 2020-2034 |
| Segmentation |
|
Table of Contents
- 1. Introduction
- 1.1. Research Scope
- 1.2. Market Segmentation
- 1.3. Research Objective
- 1.4. Definitions and Assumptions
- 2. Executive Summary
- 2.1. Market Snapshot
- 3. Market Dynamics
- 3.1. Market Drivers
- 3.2. Market Restrains
- 3.3. Market Trends
- 3.4. Market Opportunities
- 4. Market Factor Analysis
- 4.1. Porters Five Forces
- 4.1.1. Bargaining Power of Suppliers
- 4.1.2. Bargaining Power of Buyers
- 4.1.3. Threat of New Entrants
- 4.1.4. Threat of Substitutes
- 4.1.5. Competitive Rivalry
- 4.2. PESTEL analysis
- 4.3. BCG Analysis
- 4.3.1. Stars (High Growth, High Market Share)
- 4.3.2. Cash Cows (Low Growth, High Market Share)
- 4.3.3. Question Mark (High Growth, Low Market Share)
- 4.3.4. Dogs (Low Growth, Low Market Share)
- 4.4. Ansoff Matrix Analysis
- 4.5. Supply Chain Analysis
- 4.6. Regulatory Landscape
- 4.7. Current Market Potential and Opportunity Assessment (TAM–SAM–SOM Framework)
- 4.8. VDR Analyst Note
- 4.1. Porters Five Forces
- 5. Market Analysis, Insights and Forecast 2021-2033
- 5.1. Market Analysis, Insights and Forecast - by Fuel Type
- 5.1.1. Renewable
- 5.1.2. Non-renewable
- 5.2. Market Analysis, Insights and Forecast - by Installation
- 5.2.1. Rooftop
- 5.2.2. Ground-based
- 5.3. Market Analysis, Insights and Forecast - by Ownership
- 5.3.1. Operator-owned
- 5.3.2. Joint Venture
- 5.3.3. Private-owned
- 5.3.4. MNO Captive
- 5.4. Market Analysis, Insights and Forecast - by Region
- 5.4.1. North America
- 5.4.2. South America
- 5.4.3. Europe
- 5.4.4. Middle East & Africa
- 5.4.5. Asia Pacific
- 5.1. Market Analysis, Insights and Forecast - by Fuel Type
- 6. Global US Wireless Telecom Tower Industry Analysis, Insights and Forecast, 2021-2033
- 6.1. Market Analysis, Insights and Forecast - by Fuel Type
- 6.1.1. Renewable
- 6.1.2. Non-renewable
- 6.2. Market Analysis, Insights and Forecast - by Installation
- 6.2.1. Rooftop
- 6.2.2. Ground-based
- 6.3. Market Analysis, Insights and Forecast - by Ownership
- 6.3.1. Operator-owned
- 6.3.2. Joint Venture
- 6.3.3. Private-owned
- 6.3.4. MNO Captive
- 6.1. Market Analysis, Insights and Forecast - by Fuel Type
- 7. North America US Wireless Telecom Tower Industry Analysis, Insights and Forecast, 2021-2033
- 7.1. Market Analysis, Insights and Forecast - by Fuel Type
- 7.1.1. Renewable
- 7.1.2. Non-renewable
- 7.2. Market Analysis, Insights and Forecast - by Installation
- 7.2.1. Rooftop
- 7.2.2. Ground-based
- 7.3. Market Analysis, Insights and Forecast - by Ownership
- 7.3.1. Operator-owned
- 7.3.2. Joint Venture
- 7.3.3. Private-owned
- 7.3.4. MNO Captive
- 7.1. Market Analysis, Insights and Forecast - by Fuel Type
- 8. South America US Wireless Telecom Tower Industry Analysis, Insights and Forecast, 2021-2033
- 8.1. Market Analysis, Insights and Forecast - by Fuel Type
- 8.1.1. Renewable
- 8.1.2. Non-renewable
- 8.2. Market Analysis, Insights and Forecast - by Installation
- 8.2.1. Rooftop
- 8.2.2. Ground-based
- 8.3. Market Analysis, Insights and Forecast - by Ownership
- 8.3.1. Operator-owned
- 8.3.2. Joint Venture
- 8.3.3. Private-owned
- 8.3.4. MNO Captive
- 8.1. Market Analysis, Insights and Forecast - by Fuel Type
- 9. Europe US Wireless Telecom Tower Industry Analysis, Insights and Forecast, 2021-2033
- 9.1. Market Analysis, Insights and Forecast - by Fuel Type
- 9.1.1. Renewable
- 9.1.2. Non-renewable
- 9.2. Market Analysis, Insights and Forecast - by Installation
- 9.2.1. Rooftop
- 9.2.2. Ground-based
- 9.3. Market Analysis, Insights and Forecast - by Ownership
- 9.3.1. Operator-owned
- 9.3.2. Joint Venture
- 9.3.3. Private-owned
- 9.3.4. MNO Captive
- 9.1. Market Analysis, Insights and Forecast - by Fuel Type
- 10. Middle East & Africa US Wireless Telecom Tower Industry Analysis, Insights and Forecast, 2021-2033
- 10.1. Market Analysis, Insights and Forecast - by Fuel Type
- 10.1.1. Renewable
- 10.1.2. Non-renewable
- 10.2. Market Analysis, Insights and Forecast - by Installation
- 10.2.1. Rooftop
- 10.2.2. Ground-based
- 10.3. Market Analysis, Insights and Forecast - by Ownership
- 10.3.1. Operator-owned
- 10.3.2. Joint Venture
- 10.3.3. Private-owned
- 10.3.4. MNO Captive
- 10.1. Market Analysis, Insights and Forecast - by Fuel Type
- 11. Asia Pacific US Wireless Telecom Tower Industry Analysis, Insights and Forecast, 2021-2033
- 11.1. Market Analysis, Insights and Forecast - by Fuel Type
- 11.1.1. Renewable
- 11.1.2. Non-renewable
- 11.2. Market Analysis, Insights and Forecast - by Installation
- 11.2.1. Rooftop
- 11.2.2. Ground-based
- 11.3. Market Analysis, Insights and Forecast - by Ownership
- 11.3.1. Operator-owned
- 11.3.2. Joint Venture
- 11.3.3. Private-owned
- 11.3.4. MNO Captive
- 11.1. Market Analysis, Insights and Forecast - by Fuel Type
- 12. Competitive Analysis
- 12.1. Company Profiles
- 12.1.1 SBA Communications Corporation
- 12.1.1.1. Company Overview
- 12.1.1.2. Products
- 12.1.1.3. Company Financials
- 12.1.1.4. SWOT Analysis
- 12.1.2 Melody Wireless Infrastructure
- 12.1.2.1. Company Overview
- 12.1.2.2. Products
- 12.1.2.3. Company Financials
- 12.1.2.4. SWOT Analysis
- 12.1.3 Crown Castle International Corp
- 12.1.3.1. Company Overview
- 12.1.3.2. Products
- 12.1.3.3. Company Financials
- 12.1.3.4. SWOT Analysis
- 12.1.4 AT & T Intellectual Property
- 12.1.4.1. Company Overview
- 12.1.4.2. Products
- 12.1.4.3. Company Financials
- 12.1.4.4. SWOT Analysis
- 12.1.5 Vertical Bridge
- 12.1.5.1. Company Overview
- 12.1.5.2. Products
- 12.1.5.3. Company Financials
- 12.1.5.4. SWOT Analysis
- 12.1.6 Helios Towers plc
- 12.1.6.1. Company Overview
- 12.1.6.2. Products
- 12.1.6.3. Company Financials
- 12.1.6.4. SWOT Analysis
- 12.1.7 Tillman Infrastructure LLC
- 12.1.7.1. Company Overview
- 12.1.7.2. Products
- 12.1.7.3. Company Financials
- 12.1.7.4. SWOT Analysis
- 12.1.8 United States Cellular Co
- 12.1.8.1. Company Overview
- 12.1.8.2. Products
- 12.1.8.3. Company Financials
- 12.1.8.4. SWOT Analysis
- 12.1.9 ATC IP LLC
- 12.1.9.1. Company Overview
- 12.1.9.2. Products
- 12.1.9.3. Company Financials
- 12.1.9.4. SWOT Analysis
- 12.1.10 Insite Wireless Group
- 12.1.10.1. Company Overview
- 12.1.10.2. Products
- 12.1.10.3. Company Financials
- 12.1.10.4. SWOT Analysis
- 12.1.11 BNSF Railroad
- 12.1.11.1. Company Overview
- 12.1.11.2. Products
- 12.1.11.3. Company Financials
- 12.1.11.4. SWOT Analysis
- 12.1.1 SBA Communications Corporation
- 12.2. Market Entropy
- 12.2.1 Company's Key Areas Served
- 12.2.2 Recent Developments
- 12.3. Company Market Share Analysis 2025
- 12.3.1 Top 5 Companies Market Share Analysis
- 12.3.2 Top 3 Companies Market Share Analysis
- 12.4. List of Potential Customers
- 13. Research Methodology
List of Figures
- Figure 1: Global US Wireless Telecom Tower Industry Revenue Breakdown (billion, %) by Region 2025 & 2033
- Figure 2: Global US Wireless Telecom Tower Industry Volume Breakdown (K Unit, %) by Region 2025 & 2033
- Figure 3: North America US Wireless Telecom Tower Industry Revenue (billion), by Fuel Type 2025 & 2033
- Figure 4: North America US Wireless Telecom Tower Industry Volume (K Unit), by Fuel Type 2025 & 2033
- Figure 5: North America US Wireless Telecom Tower Industry Revenue Share (%), by Fuel Type 2025 & 2033
- Figure 6: North America US Wireless Telecom Tower Industry Volume Share (%), by Fuel Type 2025 & 2033
- Figure 7: North America US Wireless Telecom Tower Industry Revenue (billion), by Installation 2025 & 2033
- Figure 8: North America US Wireless Telecom Tower Industry Volume (K Unit), by Installation 2025 & 2033
- Figure 9: North America US Wireless Telecom Tower Industry Revenue Share (%), by Installation 2025 & 2033
- Figure 10: North America US Wireless Telecom Tower Industry Volume Share (%), by Installation 2025 & 2033
- Figure 11: North America US Wireless Telecom Tower Industry Revenue (billion), by Ownership 2025 & 2033
- Figure 12: North America US Wireless Telecom Tower Industry Volume (K Unit), by Ownership 2025 & 2033
- Figure 13: North America US Wireless Telecom Tower Industry Revenue Share (%), by Ownership 2025 & 2033
- Figure 14: North America US Wireless Telecom Tower Industry Volume Share (%), by Ownership 2025 & 2033
- Figure 15: North America US Wireless Telecom Tower Industry Revenue (billion), by Country 2025 & 2033
- Figure 16: North America US Wireless Telecom Tower Industry Volume (K Unit), by Country 2025 & 2033
- Figure 17: North America US Wireless Telecom Tower Industry Revenue Share (%), by Country 2025 & 2033
- Figure 18: North America US Wireless Telecom Tower Industry Volume Share (%), by Country 2025 & 2033
- Figure 19: South America US Wireless Telecom Tower Industry Revenue (billion), by Fuel Type 2025 & 2033
- Figure 20: South America US Wireless Telecom Tower Industry Volume (K Unit), by Fuel Type 2025 & 2033
- Figure 21: South America US Wireless Telecom Tower Industry Revenue Share (%), by Fuel Type 2025 & 2033
- Figure 22: South America US Wireless Telecom Tower Industry Volume Share (%), by Fuel Type 2025 & 2033
- Figure 23: South America US Wireless Telecom Tower Industry Revenue (billion), by Installation 2025 & 2033
- Figure 24: South America US Wireless Telecom Tower Industry Volume (K Unit), by Installation 2025 & 2033
- Figure 25: South America US Wireless Telecom Tower Industry Revenue Share (%), by Installation 2025 & 2033
- Figure 26: South America US Wireless Telecom Tower Industry Volume Share (%), by Installation 2025 & 2033
- Figure 27: South America US Wireless Telecom Tower Industry Revenue (billion), by Ownership 2025 & 2033
- Figure 28: South America US Wireless Telecom Tower Industry Volume (K Unit), by Ownership 2025 & 2033
- Figure 29: South America US Wireless Telecom Tower Industry Revenue Share (%), by Ownership 2025 & 2033
- Figure 30: South America US Wireless Telecom Tower Industry Volume Share (%), by Ownership 2025 & 2033
- Figure 31: South America US Wireless Telecom Tower Industry Revenue (billion), by Country 2025 & 2033
- Figure 32: South America US Wireless Telecom Tower Industry Volume (K Unit), by Country 2025 & 2033
- Figure 33: South America US Wireless Telecom Tower Industry Revenue Share (%), by Country 2025 & 2033
- Figure 34: South America US Wireless Telecom Tower Industry Volume Share (%), by Country 2025 & 2033
- Figure 35: Europe US Wireless Telecom Tower Industry Revenue (billion), by Fuel Type 2025 & 2033
- Figure 36: Europe US Wireless Telecom Tower Industry Volume (K Unit), by Fuel Type 2025 & 2033
- Figure 37: Europe US Wireless Telecom Tower Industry Revenue Share (%), by Fuel Type 2025 & 2033
- Figure 38: Europe US Wireless Telecom Tower Industry Volume Share (%), by Fuel Type 2025 & 2033
- Figure 39: Europe US Wireless Telecom Tower Industry Revenue (billion), by Installation 2025 & 2033
- Figure 40: Europe US Wireless Telecom Tower Industry Volume (K Unit), by Installation 2025 & 2033
- Figure 41: Europe US Wireless Telecom Tower Industry Revenue Share (%), by Installation 2025 & 2033
- Figure 42: Europe US Wireless Telecom Tower Industry Volume Share (%), by Installation 2025 & 2033
- Figure 43: Europe US Wireless Telecom Tower Industry Revenue (billion), by Ownership 2025 & 2033
- Figure 44: Europe US Wireless Telecom Tower Industry Volume (K Unit), by Ownership 2025 & 2033
- Figure 45: Europe US Wireless Telecom Tower Industry Revenue Share (%), by Ownership 2025 & 2033
- Figure 46: Europe US Wireless Telecom Tower Industry Volume Share (%), by Ownership 2025 & 2033
- Figure 47: Europe US Wireless Telecom Tower Industry Revenue (billion), by Country 2025 & 2033
- Figure 48: Europe US Wireless Telecom Tower Industry Volume (K Unit), by Country 2025 & 2033
- Figure 49: Europe US Wireless Telecom Tower Industry Revenue Share (%), by Country 2025 & 2033
- Figure 50: Europe US Wireless Telecom Tower Industry Volume Share (%), by Country 2025 & 2033
- Figure 51: Middle East & Africa US Wireless Telecom Tower Industry Revenue (billion), by Fuel Type 2025 & 2033
- Figure 52: Middle East & Africa US Wireless Telecom Tower Industry Volume (K Unit), by Fuel Type 2025 & 2033
- Figure 53: Middle East & Africa US Wireless Telecom Tower Industry Revenue Share (%), by Fuel Type 2025 & 2033
- Figure 54: Middle East & Africa US Wireless Telecom Tower Industry Volume Share (%), by Fuel Type 2025 & 2033
- Figure 55: Middle East & Africa US Wireless Telecom Tower Industry Revenue (billion), by Installation 2025 & 2033
- Figure 56: Middle East & Africa US Wireless Telecom Tower Industry Volume (K Unit), by Installation 2025 & 2033
- Figure 57: Middle East & Africa US Wireless Telecom Tower Industry Revenue Share (%), by Installation 2025 & 2033
- Figure 58: Middle East & Africa US Wireless Telecom Tower Industry Volume Share (%), by Installation 2025 & 2033
- Figure 59: Middle East & Africa US Wireless Telecom Tower Industry Revenue (billion), by Ownership 2025 & 2033
- Figure 60: Middle East & Africa US Wireless Telecom Tower Industry Volume (K Unit), by Ownership 2025 & 2033
- Figure 61: Middle East & Africa US Wireless Telecom Tower Industry Revenue Share (%), by Ownership 2025 & 2033
- Figure 62: Middle East & Africa US Wireless Telecom Tower Industry Volume Share (%), by Ownership 2025 & 2033
- Figure 63: Middle East & Africa US Wireless Telecom Tower Industry Revenue (billion), by Country 2025 & 2033
- Figure 64: Middle East & Africa US Wireless Telecom Tower Industry Volume (K Unit), by Country 2025 & 2033
- Figure 65: Middle East & Africa US Wireless Telecom Tower Industry Revenue Share (%), by Country 2025 & 2033
- Figure 66: Middle East & Africa US Wireless Telecom Tower Industry Volume Share (%), by Country 2025 & 2033
- Figure 67: Asia Pacific US Wireless Telecom Tower Industry Revenue (billion), by Fuel Type 2025 & 2033
- Figure 68: Asia Pacific US Wireless Telecom Tower Industry Volume (K Unit), by Fuel Type 2025 & 2033
- Figure 69: Asia Pacific US Wireless Telecom Tower Industry Revenue Share (%), by Fuel Type 2025 & 2033
- Figure 70: Asia Pacific US Wireless Telecom Tower Industry Volume Share (%), by Fuel Type 2025 & 2033
- Figure 71: Asia Pacific US Wireless Telecom Tower Industry Revenue (billion), by Installation 2025 & 2033
- Figure 72: Asia Pacific US Wireless Telecom Tower Industry Volume (K Unit), by Installation 2025 & 2033
- Figure 73: Asia Pacific US Wireless Telecom Tower Industry Revenue Share (%), by Installation 2025 & 2033
- Figure 74: Asia Pacific US Wireless Telecom Tower Industry Volume Share (%), by Installation 2025 & 2033
- Figure 75: Asia Pacific US Wireless Telecom Tower Industry Revenue (billion), by Ownership 2025 & 2033
- Figure 76: Asia Pacific US Wireless Telecom Tower Industry Volume (K Unit), by Ownership 2025 & 2033
- Figure 77: Asia Pacific US Wireless Telecom Tower Industry Revenue Share (%), by Ownership 2025 & 2033
- Figure 78: Asia Pacific US Wireless Telecom Tower Industry Volume Share (%), by Ownership 2025 & 2033
- Figure 79: Asia Pacific US Wireless Telecom Tower Industry Revenue (billion), by Country 2025 & 2033
- Figure 80: Asia Pacific US Wireless Telecom Tower Industry Volume (K Unit), by Country 2025 & 2033
- Figure 81: Asia Pacific US Wireless Telecom Tower Industry Revenue Share (%), by Country 2025 & 2033
- Figure 82: Asia Pacific US Wireless Telecom Tower Industry Volume Share (%), by Country 2025 & 2033
List of Tables
- Table 1: Global US Wireless Telecom Tower Industry Revenue billion Forecast, by Fuel Type 2020 & 2033
- Table 2: Global US Wireless Telecom Tower Industry Volume K Unit Forecast, by Fuel Type 2020 & 2033
- Table 3: Global US Wireless Telecom Tower Industry Revenue billion Forecast, by Installation 2020 & 2033
- Table 4: Global US Wireless Telecom Tower Industry Volume K Unit Forecast, by Installation 2020 & 2033
- Table 5: Global US Wireless Telecom Tower Industry Revenue billion Forecast, by Ownership 2020 & 2033
- Table 6: Global US Wireless Telecom Tower Industry Volume K Unit Forecast, by Ownership 2020 & 2033
- Table 7: Global US Wireless Telecom Tower Industry Revenue billion Forecast, by Region 2020 & 2033
- Table 8: Global US Wireless Telecom Tower Industry Volume K Unit Forecast, by Region 2020 & 2033
- Table 9: Global US Wireless Telecom Tower Industry Revenue billion Forecast, by Fuel Type 2020 & 2033
- Table 10: Global US Wireless Telecom Tower Industry Volume K Unit Forecast, by Fuel Type 2020 & 2033
- Table 11: Global US Wireless Telecom Tower Industry Revenue billion Forecast, by Installation 2020 & 2033
- Table 12: Global US Wireless Telecom Tower Industry Volume K Unit Forecast, by Installation 2020 & 2033
- Table 13: Global US Wireless Telecom Tower Industry Revenue billion Forecast, by Ownership 2020 & 2033
- Table 14: Global US Wireless Telecom Tower Industry Volume K Unit Forecast, by Ownership 2020 & 2033
- Table 15: Global US Wireless Telecom Tower Industry Revenue billion Forecast, by Country 2020 & 2033
- Table 16: Global US Wireless Telecom Tower Industry Volume K Unit Forecast, by Country 2020 & 2033
- Table 17: United States US Wireless Telecom Tower Industry Revenue (billion) Forecast, by Application 2020 & 2033
- Table 18: United States US Wireless Telecom Tower Industry Volume (K Unit) Forecast, by Application 2020 & 2033
- Table 19: Canada US Wireless Telecom Tower Industry Revenue (billion) Forecast, by Application 2020 & 2033
- Table 20: Canada US Wireless Telecom Tower Industry Volume (K Unit) Forecast, by Application 2020 & 2033
- Table 21: Mexico US Wireless Telecom Tower Industry Revenue (billion) Forecast, by Application 2020 & 2033
- Table 22: Mexico US Wireless Telecom Tower Industry Volume (K Unit) Forecast, by Application 2020 & 2033
- Table 23: Global US Wireless Telecom Tower Industry Revenue billion Forecast, by Fuel Type 2020 & 2033
- Table 24: Global US Wireless Telecom Tower Industry Volume K Unit Forecast, by Fuel Type 2020 & 2033
- Table 25: Global US Wireless Telecom Tower Industry Revenue billion Forecast, by Installation 2020 & 2033
- Table 26: Global US Wireless Telecom Tower Industry Volume K Unit Forecast, by Installation 2020 & 2033
- Table 27: Global US Wireless Telecom Tower Industry Revenue billion Forecast, by Ownership 2020 & 2033
- Table 28: Global US Wireless Telecom Tower Industry Volume K Unit Forecast, by Ownership 2020 & 2033
- Table 29: Global US Wireless Telecom Tower Industry Revenue billion Forecast, by Country 2020 & 2033
- Table 30: Global US Wireless Telecom Tower Industry Volume K Unit Forecast, by Country 2020 & 2033
- Table 31: Brazil US Wireless Telecom Tower Industry Revenue (billion) Forecast, by Application 2020 & 2033
- Table 32: Brazil US Wireless Telecom Tower Industry Volume (K Unit) Forecast, by Application 2020 & 2033
- Table 33: Argentina US Wireless Telecom Tower Industry Revenue (billion) Forecast, by Application 2020 & 2033
- Table 34: Argentina US Wireless Telecom Tower Industry Volume (K Unit) Forecast, by Application 2020 & 2033
- Table 35: Rest of South America US Wireless Telecom Tower Industry Revenue (billion) Forecast, by Application 2020 & 2033
- Table 36: Rest of South America US Wireless Telecom Tower Industry Volume (K Unit) Forecast, by Application 2020 & 2033
- Table 37: Global US Wireless Telecom Tower Industry Revenue billion Forecast, by Fuel Type 2020 & 2033
- Table 38: Global US Wireless Telecom Tower Industry Volume K Unit Forecast, by Fuel Type 2020 & 2033
- Table 39: Global US Wireless Telecom Tower Industry Revenue billion Forecast, by Installation 2020 & 2033
- Table 40: Global US Wireless Telecom Tower Industry Volume K Unit Forecast, by Installation 2020 & 2033
- Table 41: Global US Wireless Telecom Tower Industry Revenue billion Forecast, by Ownership 2020 & 2033
- Table 42: Global US Wireless Telecom Tower Industry Volume K Unit Forecast, by Ownership 2020 & 2033
- Table 43: Global US Wireless Telecom Tower Industry Revenue billion Forecast, by Country 2020 & 2033
- Table 44: Global US Wireless Telecom Tower Industry Volume K Unit Forecast, by Country 2020 & 2033
- Table 45: United Kingdom US Wireless Telecom Tower Industry Revenue (billion) Forecast, by Application 2020 & 2033
- Table 46: United Kingdom US Wireless Telecom Tower Industry Volume (K Unit) Forecast, by Application 2020 & 2033
- Table 47: Germany US Wireless Telecom Tower Industry Revenue (billion) Forecast, by Application 2020 & 2033
- Table 48: Germany US Wireless Telecom Tower Industry Volume (K Unit) Forecast, by Application 2020 & 2033
- Table 49: France US Wireless Telecom Tower Industry Revenue (billion) Forecast, by Application 2020 & 2033
- Table 50: France US Wireless Telecom Tower Industry Volume (K Unit) Forecast, by Application 2020 & 2033
- Table 51: Italy US Wireless Telecom Tower Industry Revenue (billion) Forecast, by Application 2020 & 2033
- Table 52: Italy US Wireless Telecom Tower Industry Volume (K Unit) Forecast, by Application 2020 & 2033
- Table 53: Spain US Wireless Telecom Tower Industry Revenue (billion) Forecast, by Application 2020 & 2033
- Table 54: Spain US Wireless Telecom Tower Industry Volume (K Unit) Forecast, by Application 2020 & 2033
- Table 55: Russia US Wireless Telecom Tower Industry Revenue (billion) Forecast, by Application 2020 & 2033
- Table 56: Russia US Wireless Telecom Tower Industry Volume (K Unit) Forecast, by Application 2020 & 2033
- Table 57: Benelux US Wireless Telecom Tower Industry Revenue (billion) Forecast, by Application 2020 & 2033
- Table 58: Benelux US Wireless Telecom Tower Industry Volume (K Unit) Forecast, by Application 2020 & 2033
- Table 59: Nordics US Wireless Telecom Tower Industry Revenue (billion) Forecast, by Application 2020 & 2033
- Table 60: Nordics US Wireless Telecom Tower Industry Volume (K Unit) Forecast, by Application 2020 & 2033
- Table 61: Rest of Europe US Wireless Telecom Tower Industry Revenue (billion) Forecast, by Application 2020 & 2033
- Table 62: Rest of Europe US Wireless Telecom Tower Industry Volume (K Unit) Forecast, by Application 2020 & 2033
- Table 63: Global US Wireless Telecom Tower Industry Revenue billion Forecast, by Fuel Type 2020 & 2033
- Table 64: Global US Wireless Telecom Tower Industry Volume K Unit Forecast, by Fuel Type 2020 & 2033
- Table 65: Global US Wireless Telecom Tower Industry Revenue billion Forecast, by Installation 2020 & 2033
- Table 66: Global US Wireless Telecom Tower Industry Volume K Unit Forecast, by Installation 2020 & 2033
- Table 67: Global US Wireless Telecom Tower Industry Revenue billion Forecast, by Ownership 2020 & 2033
- Table 68: Global US Wireless Telecom Tower Industry Volume K Unit Forecast, by Ownership 2020 & 2033
- Table 69: Global US Wireless Telecom Tower Industry Revenue billion Forecast, by Country 2020 & 2033
- Table 70: Global US Wireless Telecom Tower Industry Volume K Unit Forecast, by Country 2020 & 2033
- Table 71: Turkey US Wireless Telecom Tower Industry Revenue (billion) Forecast, by Application 2020 & 2033
- Table 72: Turkey US Wireless Telecom Tower Industry Volume (K Unit) Forecast, by Application 2020 & 2033
- Table 73: Israel US Wireless Telecom Tower Industry Revenue (billion) Forecast, by Application 2020 & 2033
- Table 74: Israel US Wireless Telecom Tower Industry Volume (K Unit) Forecast, by Application 2020 & 2033
- Table 75: GCC US Wireless Telecom Tower Industry Revenue (billion) Forecast, by Application 2020 & 2033
- Table 76: GCC US Wireless Telecom Tower Industry Volume (K Unit) Forecast, by Application 2020 & 2033
- Table 77: North Africa US Wireless Telecom Tower Industry Revenue (billion) Forecast, by Application 2020 & 2033
- Table 78: North Africa US Wireless Telecom Tower Industry Volume (K Unit) Forecast, by Application 2020 & 2033
- Table 79: South Africa US Wireless Telecom Tower Industry Revenue (billion) Forecast, by Application 2020 & 2033
- Table 80: South Africa US Wireless Telecom Tower Industry Volume (K Unit) Forecast, by Application 2020 & 2033
- Table 81: Rest of Middle East & Africa US Wireless Telecom Tower Industry Revenue (billion) Forecast, by Application 2020 & 2033
- Table 82: Rest of Middle East & Africa US Wireless Telecom Tower Industry Volume (K Unit) Forecast, by Application 2020 & 2033
- Table 83: Global US Wireless Telecom Tower Industry Revenue billion Forecast, by Fuel Type 2020 & 2033
- Table 84: Global US Wireless Telecom Tower Industry Volume K Unit Forecast, by Fuel Type 2020 & 2033
- Table 85: Global US Wireless Telecom Tower Industry Revenue billion Forecast, by Installation 2020 & 2033
- Table 86: Global US Wireless Telecom Tower Industry Volume K Unit Forecast, by Installation 2020 & 2033
- Table 87: Global US Wireless Telecom Tower Industry Revenue billion Forecast, by Ownership 2020 & 2033
- Table 88: Global US Wireless Telecom Tower Industry Volume K Unit Forecast, by Ownership 2020 & 2033
- Table 89: Global US Wireless Telecom Tower Industry Revenue billion Forecast, by Country 2020 & 2033
- Table 90: Global US Wireless Telecom Tower Industry Volume K Unit Forecast, by Country 2020 & 2033
- Table 91: China US Wireless Telecom Tower Industry Revenue (billion) Forecast, by Application 2020 & 2033
- Table 92: China US Wireless Telecom Tower Industry Volume (K Unit) Forecast, by Application 2020 & 2033
- Table 93: India US Wireless Telecom Tower Industry Revenue (billion) Forecast, by Application 2020 & 2033
- Table 94: India US Wireless Telecom Tower Industry Volume (K Unit) Forecast, by Application 2020 & 2033
- Table 95: Japan US Wireless Telecom Tower Industry Revenue (billion) Forecast, by Application 2020 & 2033
- Table 96: Japan US Wireless Telecom Tower Industry Volume (K Unit) Forecast, by Application 2020 & 2033
- Table 97: South Korea US Wireless Telecom Tower Industry Revenue (billion) Forecast, by Application 2020 & 2033
- Table 98: South Korea US Wireless Telecom Tower Industry Volume (K Unit) Forecast, by Application 2020 & 2033
- Table 99: ASEAN US Wireless Telecom Tower Industry Revenue (billion) Forecast, by Application 2020 & 2033
- Table 100: ASEAN US Wireless Telecom Tower Industry Volume (K Unit) Forecast, by Application 2020 & 2033
- Table 101: Oceania US Wireless Telecom Tower Industry Revenue (billion) Forecast, by Application 2020 & 2033
- Table 102: Oceania US Wireless Telecom Tower Industry Volume (K Unit) Forecast, by Application 2020 & 2033
- Table 103: Rest of Asia Pacific US Wireless Telecom Tower Industry Revenue (billion) Forecast, by Application 2020 & 2033
- Table 104: Rest of Asia Pacific US Wireless Telecom Tower Industry Volume (K Unit) Forecast, by Application 2020 & 2033
Frequently Asked Questions
1. What is the projected Compound Annual Growth Rate (CAGR) of the US Wireless Telecom Tower Industry?
The projected CAGR is approximately 4.7%.
2. Which companies are prominent players in the US Wireless Telecom Tower Industry?
Key companies in the market include SBA Communications Corporation, Melody Wireless Infrastructure, Crown Castle International Corp, AT & T Intellectual Property, Vertical Bridge, Helios Towers plc, Tillman Infrastructure LLC, United States Cellular Co, ATC IP LLC, Insite Wireless Group, BNSF Railroad.
3. What are the main segments of the US Wireless Telecom Tower Industry?
The market segments include Fuel Type, Installation, Ownership.
4. Can you provide details about the market size?
The market size is estimated to be USD 14.1 billion as of 2022.
5. What are some drivers contributing to market growth?
5G deployments are a major catalyst for growth in the cell-tower leasing environment.
6. What are the notable trends driving market growth?
Adoption of 5G to Drive the Market.
7. Are there any restraints impacting market growth?
Availability of Limited Spectrum.
8. Can you provide examples of recent developments in the market?
January 2022 - The announcement of a new 12-year collaboration between T-Mobile US, Inc. and Crown Castle International Corp. would enable T-Mobile to have more access to Crown Castle's towers and small cell sites as the company expands its national 5G network. With the help of the deal, the Un-carrier may serve customers across the United States by further extending and broadening the coverage of the company's 5G network and generating financial synergies after its merger. Additionally, the deal assists Crown Castle in developing long-term income development from small cells and towers.
9. What pricing options are available for accessing the report?
Pricing options include single-user, multi-user, and enterprise licenses priced at USD 3800, USD 4500, and USD 5800 respectively.
10. Is the market size provided in terms of value or volume?
The market size is provided in terms of value, measured in billion and volume, measured in K Unit.
11. Are there any specific market keywords associated with the report?
Yes, the market keyword associated with the report is "US Wireless Telecom Tower Industry," which aids in identifying and referencing the specific market segment covered.
12. How do I determine which pricing option suits my needs best?
The pricing options vary based on user requirements and access needs. Individual users may opt for single-user licenses, while businesses requiring broader access may choose multi-user or enterprise licenses for cost-effective access to the report.
13. Are there any additional resources or data provided in the US Wireless Telecom Tower Industry report?
While the report offers comprehensive insights, it's advisable to review the specific contents or supplementary materials provided to ascertain if additional resources or data are available.
14. How can I stay updated on further developments or reports in the US Wireless Telecom Tower Industry?
To stay informed about further developments, trends, and reports in the US Wireless Telecom Tower Industry, consider subscribing to industry newsletters, following relevant companies and organizations, or regularly checking reputable industry news sources and publications.
Methodology
Step 1 - Identification of Relevant Samples Size from Population Database


Step 2 - Approaches for Defining Global Market Size (Value, Volume* & Price*)

Note*: In applicable scenarios
Step 3 - Data Sources
Primary Research
- Web Analytics
- Survey Reports
- Research Institute
- Latest Research Reports
- Opinion Leaders
Secondary Research
- Annual Reports
- White Paper
- Latest Press Release
- Industry Association
- Paid Database
- Investor Presentations

Step 4 - Data Triangulation
Involves using different sources of information in order to increase the validity of a study
These sources are likely to be stakeholders in a program - participants, other researchers, program staff, other community members, and so on.
Then we put all data in single framework & apply various statistical tools to find out the dynamic on the market.
During the analysis stage, feedback from the stakeholder groups would be compared to determine areas of agreement as well as areas of divergence