

Key Insights
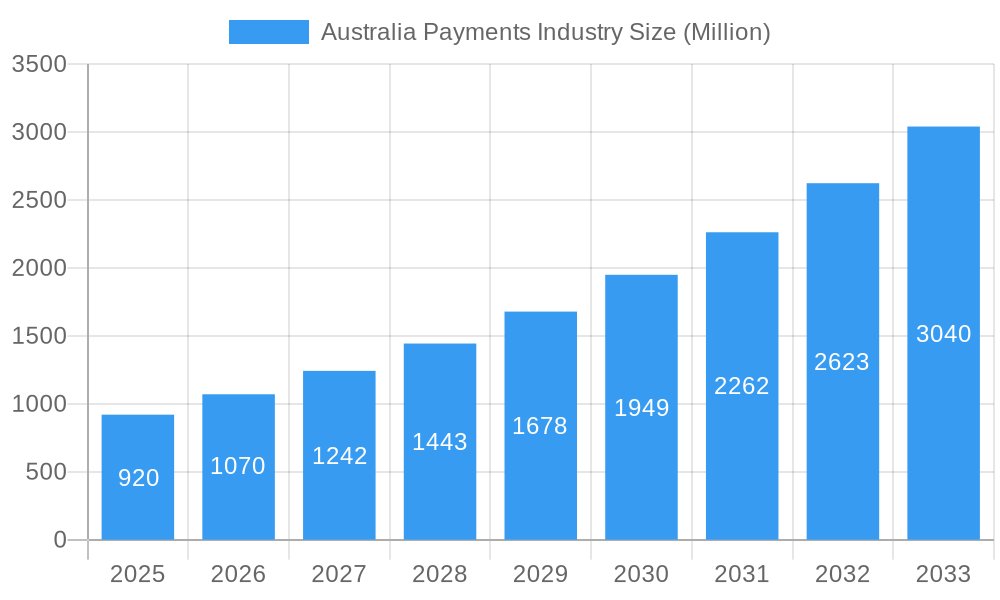
The Australian payments industry is experiencing robust growth, projected to reach a market size of $0.92 billion in 2025, expanding at a Compound Annual Growth Rate (CAGR) of 16.44% from 2025 to 2033. This significant expansion is driven by several key factors. The increasing adoption of digital wallets and mobile payment solutions, fueled by rising smartphone penetration and consumer preference for contactless transactions, is a major catalyst. Furthermore, the growth of e-commerce and online shopping, particularly within the retail, entertainment, and hospitality sectors, is significantly boosting the demand for secure and efficient online payment gateways. The industry's evolution is also shaped by the ongoing shift towards cashless transactions, government initiatives promoting digital payments, and the continuous innovation in payment technologies. While the industry faces challenges like cybersecurity concerns and the need for robust regulatory frameworks to ensure consumer protection, the overall outlook remains optimistic. The competitive landscape is dynamic, with established players like Mastercard and Visa competing alongside innovative fintech companies such as Pin Payments, Secure Pay, and Amazon Pay, offering a diverse range of payment solutions to cater to evolving consumer needs and business requirements. The industry’s segmentation by payment method (POS, digital wallets, cash) and end-user industry (retail, entertainment, healthcare, hospitality) reflects its diversity and adaptability to the unique needs of each sector.
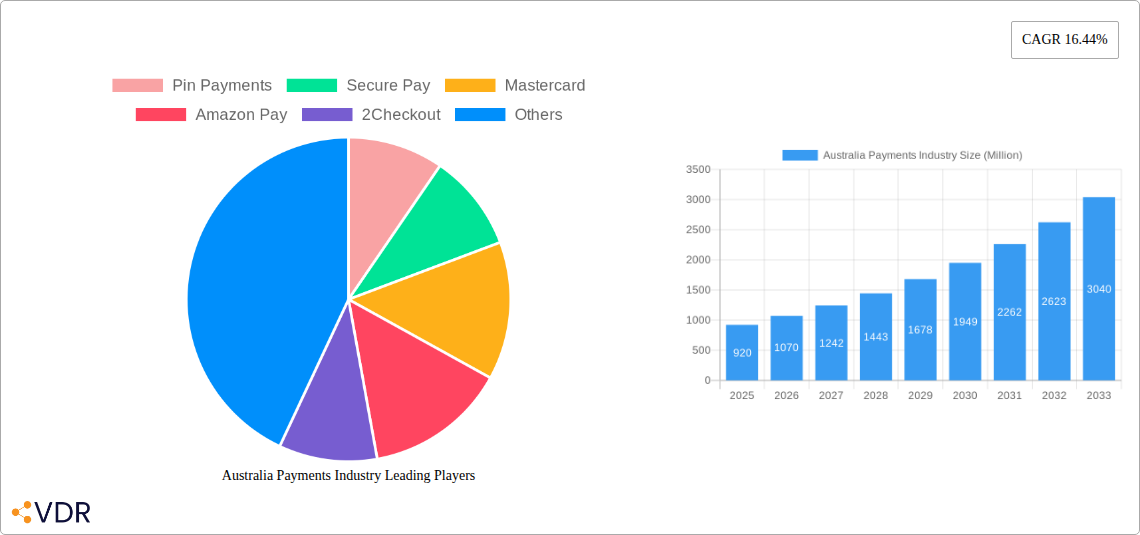
Australia Payments Industry Market Size (In Million)
The forecast period (2025-2033) suggests continued dominance of digital payment methods, with a notable increase in the market share of mobile wallets and digital payment platforms. While cash transactions will likely remain a significant segment, particularly in certain sectors, the trend indicates a gradual decrease in its relative importance. Further growth will be influenced by the development and adoption of new technologies such as biometric authentication and open banking, alongside government regulations that balance innovation with the need for financial security. The continued expansion of the e-commerce sector in Australia, including the growth of online marketplaces and subscription services, will provide a robust foundation for the long-term growth of the Australian payments industry. Competition will likely intensify, with companies constantly innovating to offer faster, more secure, and user-friendly payment solutions.
Australia Payments Industry Company Market Share
Australia Payments Industry Market Report: 2019-2033
This comprehensive report provides an in-depth analysis of the Australian payments industry, encompassing market dynamics, growth trends, key players, and future outlook. With a focus on both online and point-of-sale transactions across diverse end-user industries, this report is an essential resource for industry professionals, investors, and strategists seeking to understand and capitalize on the evolving landscape of Australian payments. The study period covers 2019-2033, with a base and estimated year of 2025.
Australia Payments Industry Market Dynamics & Structure
This section analyzes the competitive landscape, regulatory environment, and technological advancements shaping the Australian payments market. We examine market concentration, highlighting the share held by key players like Visa, Mastercard, and emerging fintechs such as Pin Payments and Square. The report also explores the impact of regulatory frameworks, the influence of technological innovations (e.g., mobile wallets, open banking), and the prevalence of competitive substitutes. M&A activity within the sector is quantified, providing insights into deal volumes and their influence on market structure. We analyze end-user demographics across key segments (Retail, Hospitality, Healthcare, etc.) to illustrate payment preferences and market opportunities.
- Market Concentration: Visa and Mastercard hold a combined xx% market share in 2025, while smaller players like Pin Payments and Square account for a combined xx%.
- Technological Innovation: Rapid adoption of digital wallets and mobile payment solutions is driving significant growth.
- Regulatory Framework: The Australian government’s initiatives towards open banking and consumer data rights are shaping the competitive landscape.
- M&A Activity: xx M&A deals were recorded in the period 2019-2024, with an estimated xx deals predicted for 2025-2033.
- Innovation Barriers: High infrastructure costs and integration complexities pose challenges to smaller players.
Australia Payments Industry Growth Trends & Insights
This section details the evolution of the Australian payments market size from 2019 to 2033, analyzing growth trajectories across different payment modes and end-user industries. We examine the adoption rates of various payment technologies, including digital wallets (Apple Pay, Google Pay), card payments (credit/debit), and alternative payment methods. The report also explores consumer behavioral shifts, focusing on the increasing preference for contactless and digital payments. Key metrics such as Compound Annual Growth Rate (CAGR) and market penetration are provided to offer a comprehensive understanding of market evolution. The analysis leverages proprietary data and publicly available information to present a robust and detailed overview of market trends.
- Market Size: The total market size is estimated at $xx million in 2025, projected to reach $xx million by 2033.
- CAGR: The market is expected to exhibit a CAGR of xx% during the forecast period (2025-2033).
- Adoption Rates: Digital wallet adoption is projected to reach xx% by 2033, up from xx% in 2025.
Dominant Regions, Countries, or Segments in Australia Payments Industry
This section identifies the leading regions, countries, and market segments within the Australian payments industry driving market growth. We analyze the dominance of specific payment modes (Point of Sale – Card Pay, Digital Wallet, Cash; Online Sale – Others), and end-user industries (Retail, Entertainment, Healthcare, Hospitality). Key drivers and dominance factors, such as economic policies, infrastructure development, consumer preferences, and regulatory changes, are examined for each segment. Market share data and growth potential projections further clarify the dominance of each segment.
- Mode of Payment: Card payments (Point of Sale) dominate with an xx% market share in 2025, followed by digital wallets at xx%.
- End-User Industry: The retail sector holds the largest market share (xx% in 2025), driven by high transaction volumes.
- Key Drivers: Increased smartphone penetration, government initiatives promoting digital payments, and rising e-commerce activity are key growth drivers.
Australia Payments Industry Product Landscape
This section provides a concise overview of the product landscape, encompassing various payment solutions and their unique selling propositions. We examine technological advancements within the industry, such as enhanced security features, improved user interfaces, and the integration of AI and machine learning for fraud detection and risk management.
The Australian payments landscape features diverse offerings, from traditional card payment systems to innovative mobile wallets and specialized solutions for specific industries. These solutions showcase improvements in security protocols, streamlined user interfaces, and sophisticated analytics capabilities for fraud prevention. Key innovations include the adoption of biometric authentication, tokenization, and real-time transaction processing.
Key Drivers, Barriers & Challenges in Australia Payments Industry
This section identifies the key factors driving market growth and the challenges hindering its progress.
Key Drivers:
- Technological advancements in mobile payments and digital wallets
- Rising e-commerce adoption
- Government initiatives to promote digital financial inclusion
Key Barriers & Challenges:
- Security concerns related to data breaches and fraud
- Regulatory complexities and compliance requirements
- Competition from established and emerging players
- xx% of businesses still rely on cash-based transactions, hindering digital adoption.
Emerging Opportunities in Australia Payments Industry
This section highlights the emerging trends and opportunities in the Australian payments industry. These include growth in the Buy Now, Pay Later (BNPL) sector, the increasing adoption of open banking, and the potential for the expansion of digital payment solutions in underserved markets. The expansion of mobile payment services within regional areas presents a significant opportunity for market expansion.
- Expansion into underserved rural markets.
- Growth of innovative payment solutions catering to specific demographics and industries.
Growth Accelerators in the Australia Payments Industry Industry
Technological advancements, strategic partnerships, and expansion into untapped markets are key growth accelerators. The integration of blockchain technology for secure and transparent transactions, combined with collaborations between fintechs and established financial institutions, will shape future growth. Furthermore, the focus on enhancing user experience and customer service will play a crucial role in driving adoption rates.
Key Players Shaping the Australia Payments Industry Market
- Pin Payments
- Secure Pay
- Mastercard
- Amazon Pay
- 2Checkout
- Google Pay
- Visa
- eway
- WorldPay
- Square
Notable Milestones in Australia Payments Industry Sector
- 2020: The Australian government implemented new regulations for open banking.
- 2022: Significant growth in the adoption of mobile wallets was observed.
- 2023: Launch of several new BNPL services.
- 2024: Increase in fraud detection initiatives.
In-Depth Australia Payments Industry Market Outlook
The Australian payments industry is poised for continued growth driven by increasing digitalization, the rising popularity of e-commerce, and government initiatives promoting digital payments. Strategic partnerships between established players and fintechs will accelerate innovation and market expansion. The focus on enhanced security and customer-centric solutions will be critical for sustained success in this dynamic market. The forecast period offers significant potential for market expansion and innovative service offerings, particularly in underserved segments.
Australia Payments Industry Segmentation
-
1. Mode of Payment
-
1.1. Point of Sale
- 1.1.1. Card Pay
- 1.1.2. Digital Wallet (includes Mobile Wallets)
- 1.1.3. Cash
- 1.1.4. Others
-
1.2. Online Sale
- 1.2.1. Others (
-
1.1. Point of Sale
-
2. End-user Industry
- 2.1. Retail
- 2.2. Entertainment
- 2.3. Healthcare
- 2.4. Hospitality
- 2.5. Other End-user Industries
Australia Payments Industry Segmentation By Geography
- 1. Australia
Australia Payments Industry Regional Market Share
Geographic Coverage of Australia Payments Industry
Australia Payments Industry REPORT HIGHLIGHTS
| Aspects | Details |
|---|---|
| Study Period | 2020-2034 |
| Base Year | 2025 |
| Estimated Year | 2026 |
| Forecast Period | 2026-2034 |
| Historical Period | 2020-2025 |
| Growth Rate | CAGR of 16.44% from 2020-2034 |
| Segmentation |
|
Table of Contents
- 1. Introduction
- 1.1. Research Scope
- 1.2. Market Segmentation
- 1.3. Research Objective
- 1.4. Definitions and Assumptions
- 2. Executive Summary
- 2.1. Market Snapshot
- 3. Market Dynamics
- 3.1. Market Drivers
- 3.2. Market Restrains
- 3.3. Market Trends
- 3.4. Market Opportunities
- 4. Market Factor Analysis
- 4.1. Porters Five Forces
- 4.1.1. Bargaining Power of Suppliers
- 4.1.2. Bargaining Power of Buyers
- 4.1.3. Threat of New Entrants
- 4.1.4. Threat of Substitutes
- 4.1.5. Competitive Rivalry
- 4.2. PESTEL analysis
- 4.3. BCG Analysis
- 4.3.1. Stars (High Growth, High Market Share)
- 4.3.2. Cash Cows (Low Growth, High Market Share)
- 4.3.3. Question Mark (High Growth, Low Market Share)
- 4.3.4. Dogs (Low Growth, Low Market Share)
- 4.4. Ansoff Matrix Analysis
- 4.5. Supply Chain Analysis
- 4.6. Regulatory Landscape
- 4.7. Current Market Potential and Opportunity Assessment (TAM–SAM–SOM Framework)
- 4.8. VDR Analyst Note
- 4.1. Porters Five Forces
- 5. Market Analysis, Insights and Forecast 2021-2033
- 5.1. Market Analysis, Insights and Forecast - by Mode of Payment
- 5.1.1. Point of Sale
- 5.1.1.1. Card Pay
- 5.1.1.2. Digital Wallet (includes Mobile Wallets)
- 5.1.1.3. Cash
- 5.1.1.4. Others
- 5.1.2. Online Sale
- 5.1.2.1. Others (
- 5.1.1. Point of Sale
- 5.2. Market Analysis, Insights and Forecast - by End-user Industry
- 5.2.1. Retail
- 5.2.2. Entertainment
- 5.2.3. Healthcare
- 5.2.4. Hospitality
- 5.2.5. Other End-user Industries
- 5.3. Market Analysis, Insights and Forecast - by Region
- 5.3.1. Australia
- 5.1. Market Analysis, Insights and Forecast - by Mode of Payment
- 6. Australia Payments Industry Analysis, Insights and Forecast, 2021-2033
- 6.1. Market Analysis, Insights and Forecast - by Mode of Payment
- 6.1.1. Point of Sale
- 6.1.1.1. Card Pay
- 6.1.1.2. Digital Wallet (includes Mobile Wallets)
- 6.1.1.3. Cash
- 6.1.1.4. Others
- 6.1.2. Online Sale
- 6.1.2.1. Others (
- 6.1.1. Point of Sale
- 6.2. Market Analysis, Insights and Forecast - by End-user Industry
- 6.2.1. Retail
- 6.2.2. Entertainment
- 6.2.3. Healthcare
- 6.2.4. Hospitality
- 6.2.5. Other End-user Industries
- 6.1. Market Analysis, Insights and Forecast - by Mode of Payment
- 7. Competitive Analysis
- 7.1. Company Profiles
- 7.1.1 Pin Payments
- 7.1.1.1. Company Overview
- 7.1.1.2. Products
- 7.1.1.3. Company Financials
- 7.1.1.4. SWOT Analysis
- 7.1.2 Secure Pay
- 7.1.2.1. Company Overview
- 7.1.2.2. Products
- 7.1.2.3. Company Financials
- 7.1.2.4. SWOT Analysis
- 7.1.3 Mastercard
- 7.1.3.1. Company Overview
- 7.1.3.2. Products
- 7.1.3.3. Company Financials
- 7.1.3.4. SWOT Analysis
- 7.1.4 Amazon Pay
- 7.1.4.1. Company Overview
- 7.1.4.2. Products
- 7.1.4.3. Company Financials
- 7.1.4.4. SWOT Analysis
- 7.1.5 2Checkout
- 7.1.5.1. Company Overview
- 7.1.5.2. Products
- 7.1.5.3. Company Financials
- 7.1.5.4. SWOT Analysis
- 7.1.6 Google Pay
- 7.1.6.1. Company Overview
- 7.1.6.2. Products
- 7.1.6.3. Company Financials
- 7.1.6.4. SWOT Analysis
- 7.1.7 Visa*List Not Exhaustive
- 7.1.7.1. Company Overview
- 7.1.7.2. Products
- 7.1.7.3. Company Financials
- 7.1.7.4. SWOT Analysis
- 7.1.8 eway
- 7.1.8.1. Company Overview
- 7.1.8.2. Products
- 7.1.8.3. Company Financials
- 7.1.8.4. SWOT Analysis
- 7.1.9 WorldPay
- 7.1.9.1. Company Overview
- 7.1.9.2. Products
- 7.1.9.3. Company Financials
- 7.1.9.4. SWOT Analysis
- 7.1.10 Square
- 7.1.10.1. Company Overview
- 7.1.10.2. Products
- 7.1.10.3. Company Financials
- 7.1.10.4. SWOT Analysis
- 7.1.1 Pin Payments
- 7.2. Market Entropy
- 7.2.1 Company's Key Areas Served
- 7.2.2 Recent Developments
- 7.3. Company Market Share Analysis 2025
- 7.3.1 Top 5 Companies Market Share Analysis
- 7.3.2 Top 3 Companies Market Share Analysis
- 7.4. List of Potential Customers
- 8. Research Methodology
List of Figures
- Figure 1: Australia Payments Industry Revenue Breakdown (Million, %) by Product 2025 & 2033
- Figure 2: Australia Payments Industry Share (%) by Company 2025
List of Tables
- Table 1: Australia Payments Industry Revenue Million Forecast, by Mode of Payment 2020 & 2033
- Table 2: Australia Payments Industry Revenue Million Forecast, by End-user Industry 2020 & 2033
- Table 3: Australia Payments Industry Revenue Million Forecast, by Region 2020 & 2033
- Table 4: Australia Payments Industry Revenue Million Forecast, by Mode of Payment 2020 & 2033
- Table 5: Australia Payments Industry Revenue Million Forecast, by End-user Industry 2020 & 2033
- Table 6: Australia Payments Industry Revenue Million Forecast, by Country 2020 & 2033
Frequently Asked Questions
1. What is the projected Compound Annual Growth Rate (CAGR) of the Australia Payments Industry?
The projected CAGR is approximately 16.44%.
2. Which companies are prominent players in the Australia Payments Industry?
Key companies in the market include Pin Payments, Secure Pay, Mastercard, Amazon Pay, 2Checkout, Google Pay, Visa*List Not Exhaustive, eway, WorldPay, Square.
3. What are the main segments of the Australia Payments Industry?
The market segments include Mode of Payment, End-user Industry.
4. Can you provide details about the market size?
The market size is estimated to be USD 0.92 Million as of 2022.
5. What are some drivers contributing to market growth?
High Proliferation of E-commerce. including the rise of m-commerce and cross-border e-commerce supported by the increase in purchasing power; Enablement Programs by Key Retailers and Government encouraging digitization of the market; Growth of Real-time Payments in Germany.
6. What are the notable trends driving market growth?
E-Commerce Segment is Anticipated to Witness Significant Growth.
7. Are there any restraints impacting market growth?
; Threat to Security of Fingerprint Data Within the System; Limitations of the Technology Leading to Breaches.
8. Can you provide examples of recent developments in the market?
N/A
9. What pricing options are available for accessing the report?
Pricing options include single-user, multi-user, and enterprise licenses priced at USD 3800, USD 4500, and USD 5800 respectively.
10. Is the market size provided in terms of value or volume?
The market size is provided in terms of value, measured in Million.
11. Are there any specific market keywords associated with the report?
Yes, the market keyword associated with the report is "Australia Payments Industry," which aids in identifying and referencing the specific market segment covered.
12. How do I determine which pricing option suits my needs best?
The pricing options vary based on user requirements and access needs. Individual users may opt for single-user licenses, while businesses requiring broader access may choose multi-user or enterprise licenses for cost-effective access to the report.
13. Are there any additional resources or data provided in the Australia Payments Industry report?
While the report offers comprehensive insights, it's advisable to review the specific contents or supplementary materials provided to ascertain if additional resources or data are available.
14. How can I stay updated on further developments or reports in the Australia Payments Industry?
To stay informed about further developments, trends, and reports in the Australia Payments Industry, consider subscribing to industry newsletters, following relevant companies and organizations, or regularly checking reputable industry news sources and publications.
Methodology
Step 1 - Identification of Relevant Samples Size from Population Database


Step 2 - Approaches for Defining Global Market Size (Value, Volume* & Price*)

Note*: In applicable scenarios
Step 3 - Data Sources
Primary Research
- Web Analytics
- Survey Reports
- Research Institute
- Latest Research Reports
- Opinion Leaders
Secondary Research
- Annual Reports
- White Paper
- Latest Press Release
- Industry Association
- Paid Database
- Investor Presentations

Step 4 - Data Triangulation
Involves using different sources of information in order to increase the validity of a study
These sources are likely to be stakeholders in a program - participants, other researchers, program staff, other community members, and so on.
Then we put all data in single framework & apply various statistical tools to find out the dynamic on the market.
During the analysis stage, feedback from the stakeholder groups would be compared to determine areas of agreement as well as areas of divergence