

Key Insights
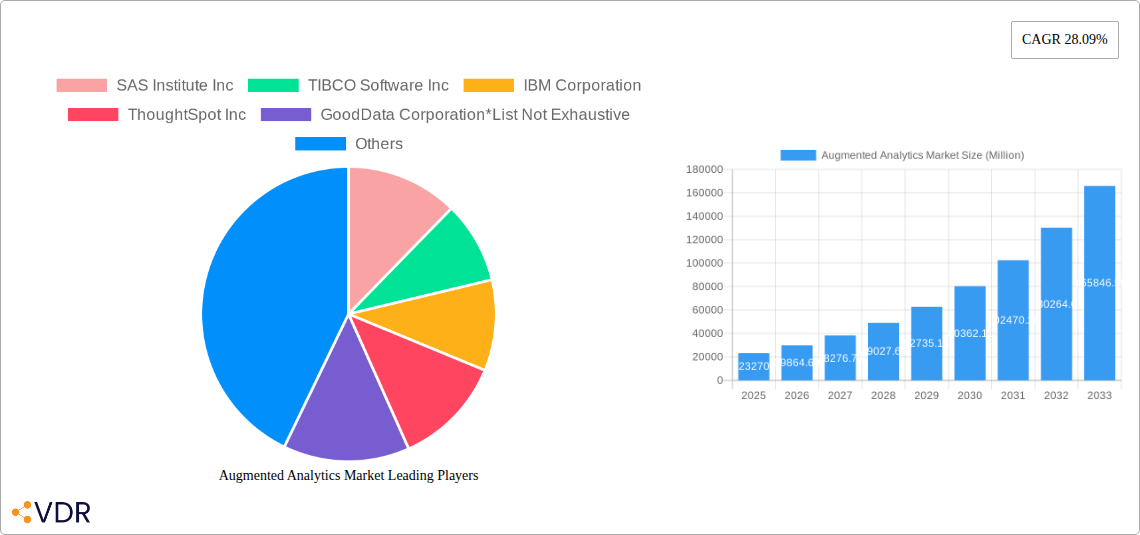
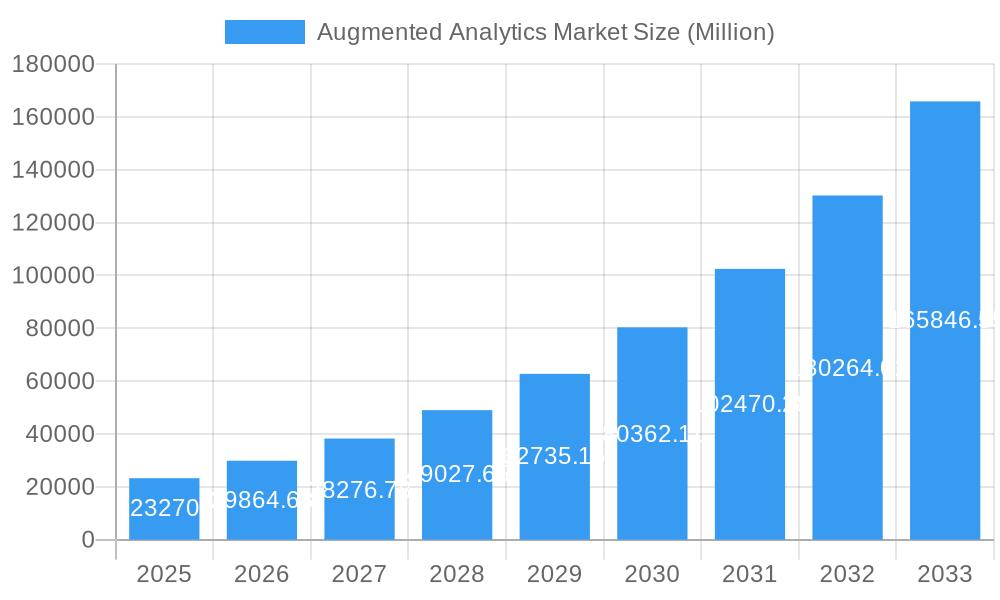
The Augmented Analytics market is experiencing robust growth, projected to reach \$23.27 billion in 2025 and maintain a Compound Annual Growth Rate (CAGR) of 28.09% from 2025 to 2033. This expansion is fueled by several key drivers. The increasing volume and complexity of data generated across various industries necessitates efficient and insightful data analysis, a need directly addressed by augmented analytics' automated capabilities. Businesses across sectors, including BFSI (Banking, Financial Services, and Insurance), Telecom & IT, Retail, Healthcare, and Manufacturing, are adopting augmented analytics to improve decision-making, optimize operations, and gain a competitive edge. Furthermore, the growing prevalence of cloud-based solutions is simplifying deployment and accessibility, further accelerating market penetration. While data security concerns and the need for skilled professionals represent potential restraints, the overall market outlook remains positive, driven by continuous technological advancements and rising demand for data-driven insights. The diverse range of solutions offered by major players like SAS, TIBCO, IBM, and ThoughtSpot caters to various industry-specific needs, fostering innovation and competition. The North American market currently holds a significant share, but regions like Asia Pacific are witnessing rapid growth, presenting substantial future opportunities.
Augmented Analytics Market Market Size (In Billion)
The segmentation by deployment (on-premise vs. cloud) highlights a clear trend towards cloud-based solutions. This is driven by their scalability, cost-effectiveness, and ease of access. The end-user industry segmentation reveals a widespread adoption across sectors, with BFSI and Telecom & IT leading the way due to their high data volumes and the critical need for timely, accurate insights. The competitive landscape is dynamic, characterized by both established players and emerging startups. Ongoing innovations in areas like natural language processing (NLP) and machine learning (ML) are further enhancing the capabilities of augmented analytics solutions, pushing the boundaries of data analysis and predictive modeling. This continued innovation, combined with increasing data volumes and the rising demand for data-driven decision-making, ensures the sustained growth of the augmented analytics market in the coming years.
Augmented Analytics Market Company Market Share
Augmented Analytics Market: A Comprehensive Report (2019-2033)
This comprehensive report provides an in-depth analysis of the Augmented Analytics market, encompassing market dynamics, growth trends, regional dominance, product landscape, key players, and future outlook. The study period covers 2019-2033, with 2025 as the base and estimated year. The forecast period spans 2025-2033, and the historical period covers 2019-2024. The market is segmented by deployment (on-premise, cloud) and end-user industry (BFSI, Telecom & IT, Retail, Healthcare, Manufacturing, Media & Entertainment, and Other End-user Industries). Key players analyzed include SAS Institute Inc, TIBCO Software Inc, IBM Corporation, ThoughtSpot Inc, GoodData Corporation, Microsoft Corporation, QlikTech International AB, Sisense Inc, SAP SE, MicroStrategy Inc, and Salesforce com inc.
Augmented Analytics Market Market Dynamics & Structure
The Augmented Analytics market is experiencing robust growth fueled by increasing data volumes, the need for faster insights, and advancements in artificial intelligence (AI) and machine learning (ML). Market concentration is moderate, with a few major players holding significant market share, while several smaller companies are also competing. Technological innovation, particularly in natural language processing (NLP) and automated data preparation, is a key driver. Regulatory frameworks concerning data privacy (e.g., GDPR) are influencing market practices. Competitive product substitutes include traditional business intelligence (BI) tools, but augmented analytics offers a distinct advantage in ease of use and speed of insight generation. End-user demographics are expanding across various industries, with a growing preference for cloud-based solutions. M&A activity is moderate, with strategic acquisitions driving consolidation.
- Market Concentration: Moderately concentrated, with top 5 players holding xx% market share in 2025.
- Technological Innovation: Rapid advancements in AI, ML, and NLP are key drivers.
- Regulatory Landscape: Data privacy regulations influence product development and deployment.
- M&A Activity: Approximately xx M&A deals in the last 5 years, driven by strategic acquisitions.
- Innovation Barriers: High initial investment costs and lack of skilled professionals can hinder adoption.
Augmented Analytics Market Growth Trends & Insights
The Augmented Analytics market is experiencing significant growth, driven by the increasing need for data-driven decision-making across various industries. The market size is estimated at xx Million in 2025 and is projected to reach xx Million by 2033, exhibiting a CAGR of xx%. Adoption rates are accelerating, particularly in cloud-based deployments. Technological disruptions, such as the rise of serverless computing and edge analytics, are further shaping market dynamics. Consumer behavior shifts are evident in the preference for user-friendly interfaces and self-service analytics capabilities. The market penetration rate is expected to increase from xx% in 2025 to xx% by 2033.
Dominant Regions, Countries, or Segments in Augmented Analytics Market
North America currently dominates the Augmented Analytics market, driven by strong technological advancements, high adoption rates, and a significant presence of key players. The cloud deployment segment holds a significant market share, propelled by scalability, cost-effectiveness, and accessibility. Within end-user industries, BFSI and Telecom & IT sectors are leading adopters due to their significant data volumes and need for real-time insights. Europe and Asia-Pacific are expected to experience substantial growth in the forecast period.
- Key Drivers (North America): Strong technological infrastructure, high data maturity, early adoption of cloud technologies.
- Key Drivers (Cloud Segment): Scalability, cost-effectiveness, ease of access and maintenance.
- Key Drivers (BFSI & Telecom & IT): High data volumes, need for real-time insights, regulatory compliance needs.
- Growth Potential: Asia-Pacific is poised for significant growth due to increasing digitalization and rising adoption of advanced analytics.
Augmented Analytics Market Product Landscape
Augmented analytics products are evolving rapidly, incorporating features such as natural language processing for intuitive query generation, automated data preparation and cleaning, and advanced visualization tools. These products offer unique selling propositions like ease of use, faster time-to-insights, and improved accessibility for business users without extensive technical expertise. Key technological advancements include the integration of AI/ML algorithms for predictive modeling and anomaly detection.
Key Drivers, Barriers & Challenges in Augmented Analytics Market
Key Drivers: The increasing volume and velocity of data, the growing need for faster and more accurate business insights, and the development of sophisticated AI/ML algorithms are key drivers. The demand for self-service analytics and the reduction in the need for specialized IT personnel also contribute to growth.
Key Challenges: High initial investment costs, the need for skilled data scientists and analysts, and concerns about data security and privacy remain significant challenges. Integration with existing enterprise systems can also be complex. The risk of inaccurate insights due to biased data or flawed algorithms is a growing concern.
Emerging Opportunities in Augmented Analytics Market
Emerging opportunities lie in the expansion into untapped markets, particularly in developing economies, and in the application of augmented analytics to new sectors such as education and agriculture. The development of more specialized solutions for specific industries, improved explainability of AI/ML models, and the integration of augmented analytics with other emerging technologies like IoT present significant growth potential.
Growth Accelerators in the Augmented Analytics Market Industry
Strategic partnerships between augmented analytics vendors and cloud providers are accelerating market growth. Continuous technological breakthroughs in AI and ML are enabling the development of more powerful and user-friendly tools. The expansion into new geographical markets and the development of specialized solutions for specific industry verticals are also fueling market expansion.
Key Players Shaping the Augmented Analytics Market Market
- SAS Institute Inc
- TIBCO Software Inc
- IBM Corporation
- ThoughtSpot Inc
- GoodData Corporation
- Microsoft Corporation
- QlikTech International AB
- Sisense Inc
- SAP SE
- MicroStrategy Inc
- Salesforce com inc
Notable Milestones in Augmented Analytics Market Sector
- May 2023: TrinityLife Sciences and WhizAI announced a strategic partnership, expanding the reach of AI-driven insights in life sciences.
- January 2023: Seerist Inc. enhanced its augmented analytics solution with new capabilities, improving contextual intelligence and customization.
In-Depth Augmented Analytics Market Market Outlook
The Augmented Analytics market is poised for continued strong growth, driven by technological advancements, increasing data volumes, and expanding adoption across various industries. Strategic partnerships, product innovation, and expansion into new markets will be key factors in shaping future market dynamics. The market presents significant opportunities for both established players and new entrants, with substantial growth potential in the coming years.
Augmented Analytics Market Segmentation
-
1. Deployment
- 1.1. On-premise
- 1.2. Cloud
-
2. End-user Industry
- 2.1. BFSI
- 2.2. Telecom & IT
- 2.3. Retail
- 2.4. Healthcare
- 2.5. Manufacturing
- 2.6. Media & Entertainment
- 2.7. Other End-user Industries
Augmented Analytics Market Segmentation By Geography
- 1. North America
- 2. Europe
- 3. Asia Pacific
- 4. Rest of the World
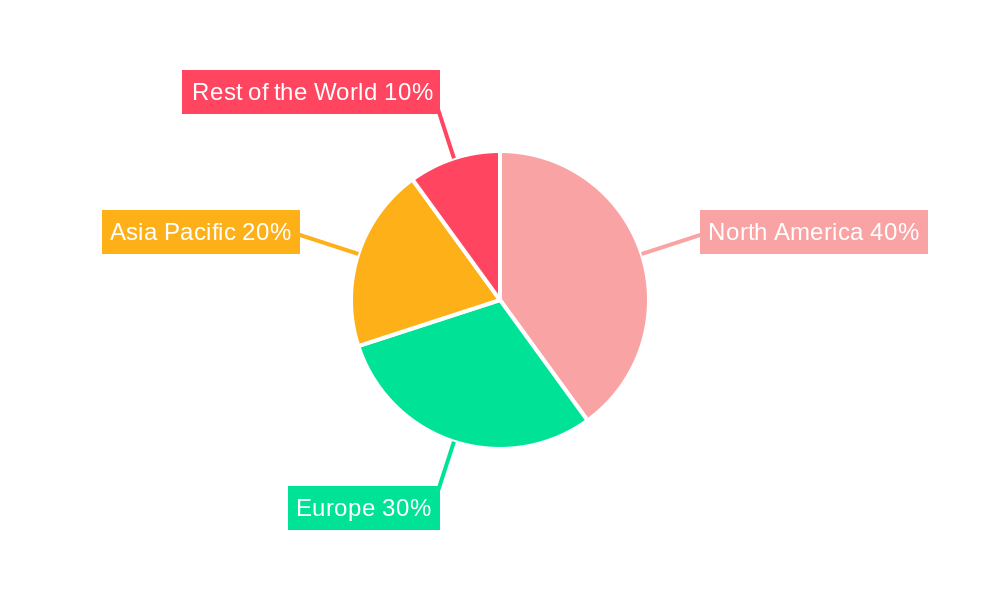
Augmented Analytics Market Regional Market Share
Geographic Coverage of Augmented Analytics Market
Augmented Analytics Market REPORT HIGHLIGHTS
| Aspects | Details |
|---|---|
| Study Period | 2020-2034 |
| Base Year | 2025 |
| Estimated Year | 2026 |
| Forecast Period | 2026-2034 |
| Historical Period | 2020-2025 |
| Growth Rate | CAGR of 28.09% from 2020-2034 |
| Segmentation |
|
Table of Contents
- 1. Introduction
- 1.1. Research Scope
- 1.2. Market Segmentation
- 1.3. Research Objective
- 1.4. Definitions and Assumptions
- 2. Executive Summary
- 2.1. Market Snapshot
- 3. Market Dynamics
- 3.1. Market Drivers
- 3.2. Market Restrains
- 3.3. Market Trends
- 3.4. Market Opportunities
- 4. Market Factor Analysis
- 4.1. Porters Five Forces
- 4.1.1. Bargaining Power of Suppliers
- 4.1.2. Bargaining Power of Buyers
- 4.1.3. Threat of New Entrants
- 4.1.4. Threat of Substitutes
- 4.1.5. Competitive Rivalry
- 4.2. PESTEL analysis
- 4.3. BCG Analysis
- 4.3.1. Stars (High Growth, High Market Share)
- 4.3.2. Cash Cows (Low Growth, High Market Share)
- 4.3.3. Question Mark (High Growth, Low Market Share)
- 4.3.4. Dogs (Low Growth, Low Market Share)
- 4.4. Ansoff Matrix Analysis
- 4.5. Supply Chain Analysis
- 4.6. Regulatory Landscape
- 4.7. Current Market Potential and Opportunity Assessment (TAM–SAM–SOM Framework)
- 4.8. VDR Analyst Note
- 4.1. Porters Five Forces
- 5. Market Analysis, Insights and Forecast 2021-2033
- 5.1. Market Analysis, Insights and Forecast - by Deployment
- 5.1.1. On-premise
- 5.1.2. Cloud
- 5.2. Market Analysis, Insights and Forecast - by End-user Industry
- 5.2.1. BFSI
- 5.2.2. Telecom & IT
- 5.2.3. Retail
- 5.2.4. Healthcare
- 5.2.5. Manufacturing
- 5.2.6. Media & Entertainment
- 5.2.7. Other End-user Industries
- 5.3. Market Analysis, Insights and Forecast - by Region
- 5.3.1. North America
- 5.3.2. Europe
- 5.3.3. Asia Pacific
- 5.3.4. Rest of the World
- 5.1. Market Analysis, Insights and Forecast - by Deployment
- 6. Global Augmented Analytics Market Analysis, Insights and Forecast, 2021-2033
- 6.1. Market Analysis, Insights and Forecast - by Deployment
- 6.1.1. On-premise
- 6.1.2. Cloud
- 6.2. Market Analysis, Insights and Forecast - by End-user Industry
- 6.2.1. BFSI
- 6.2.2. Telecom & IT
- 6.2.3. Retail
- 6.2.4. Healthcare
- 6.2.5. Manufacturing
- 6.2.6. Media & Entertainment
- 6.2.7. Other End-user Industries
- 6.1. Market Analysis, Insights and Forecast - by Deployment
- 7. North America Augmented Analytics Market Analysis, Insights and Forecast, 2021-2033
- 7.1. Market Analysis, Insights and Forecast - by Deployment
- 7.1.1. On-premise
- 7.1.2. Cloud
- 7.2. Market Analysis, Insights and Forecast - by End-user Industry
- 7.2.1. BFSI
- 7.2.2. Telecom & IT
- 7.2.3. Retail
- 7.2.4. Healthcare
- 7.2.5. Manufacturing
- 7.2.6. Media & Entertainment
- 7.2.7. Other End-user Industries
- 7.1. Market Analysis, Insights and Forecast - by Deployment
- 8. Europe Augmented Analytics Market Analysis, Insights and Forecast, 2021-2033
- 8.1. Market Analysis, Insights and Forecast - by Deployment
- 8.1.1. On-premise
- 8.1.2. Cloud
- 8.2. Market Analysis, Insights and Forecast - by End-user Industry
- 8.2.1. BFSI
- 8.2.2. Telecom & IT
- 8.2.3. Retail
- 8.2.4. Healthcare
- 8.2.5. Manufacturing
- 8.2.6. Media & Entertainment
- 8.2.7. Other End-user Industries
- 8.1. Market Analysis, Insights and Forecast - by Deployment
- 9. Asia Pacific Augmented Analytics Market Analysis, Insights and Forecast, 2021-2033
- 9.1. Market Analysis, Insights and Forecast - by Deployment
- 9.1.1. On-premise
- 9.1.2. Cloud
- 9.2. Market Analysis, Insights and Forecast - by End-user Industry
- 9.2.1. BFSI
- 9.2.2. Telecom & IT
- 9.2.3. Retail
- 9.2.4. Healthcare
- 9.2.5. Manufacturing
- 9.2.6. Media & Entertainment
- 9.2.7. Other End-user Industries
- 9.1. Market Analysis, Insights and Forecast - by Deployment
- 10. Rest of the World Augmented Analytics Market Analysis, Insights and Forecast, 2021-2033
- 10.1. Market Analysis, Insights and Forecast - by Deployment
- 10.1.1. On-premise
- 10.1.2. Cloud
- 10.2. Market Analysis, Insights and Forecast - by End-user Industry
- 10.2.1. BFSI
- 10.2.2. Telecom & IT
- 10.2.3. Retail
- 10.2.4. Healthcare
- 10.2.5. Manufacturing
- 10.2.6. Media & Entertainment
- 10.2.7. Other End-user Industries
- 10.1. Market Analysis, Insights and Forecast - by Deployment
- 11. Competitive Analysis
- 11.1. Company Profiles
- 11.1.1 SAS Institute Inc
- 11.1.1.1. Company Overview
- 11.1.1.2. Products
- 11.1.1.3. Company Financials
- 11.1.1.4. SWOT Analysis
- 11.1.2 TIBCO Software Inc
- 11.1.2.1. Company Overview
- 11.1.2.2. Products
- 11.1.2.3. Company Financials
- 11.1.2.4. SWOT Analysis
- 11.1.3 IBM Corporation
- 11.1.3.1. Company Overview
- 11.1.3.2. Products
- 11.1.3.3. Company Financials
- 11.1.3.4. SWOT Analysis
- 11.1.4 ThoughtSpot Inc
- 11.1.4.1. Company Overview
- 11.1.4.2. Products
- 11.1.4.3. Company Financials
- 11.1.4.4. SWOT Analysis
- 11.1.5 GoodData Corporation*List Not Exhaustive
- 11.1.5.1. Company Overview
- 11.1.5.2. Products
- 11.1.5.3. Company Financials
- 11.1.5.4. SWOT Analysis
- 11.1.6 Microsoft Corporation
- 11.1.6.1. Company Overview
- 11.1.6.2. Products
- 11.1.6.3. Company Financials
- 11.1.6.4. SWOT Analysis
- 11.1.7 QlikTech International AB
- 11.1.7.1. Company Overview
- 11.1.7.2. Products
- 11.1.7.3. Company Financials
- 11.1.7.4. SWOT Analysis
- 11.1.8 Sisense Inc
- 11.1.8.1. Company Overview
- 11.1.8.2. Products
- 11.1.8.3. Company Financials
- 11.1.8.4. SWOT Analysis
- 11.1.9 SAP SE
- 11.1.9.1. Company Overview
- 11.1.9.2. Products
- 11.1.9.3. Company Financials
- 11.1.9.4. SWOT Analysis
- 11.1.10 MicroStrategy Inc
- 11.1.10.1. Company Overview
- 11.1.10.2. Products
- 11.1.10.3. Company Financials
- 11.1.10.4. SWOT Analysis
- 11.1.11 Salesforce com inc
- 11.1.11.1. Company Overview
- 11.1.11.2. Products
- 11.1.11.3. Company Financials
- 11.1.11.4. SWOT Analysis
- 11.1.1 SAS Institute Inc
- 11.2. Market Entropy
- 11.2.1 Company's Key Areas Served
- 11.2.2 Recent Developments
- 11.3. Company Market Share Analysis 2025
- 11.3.1 Top 5 Companies Market Share Analysis
- 11.3.2 Top 3 Companies Market Share Analysis
- 11.4. List of Potential Customers
- 12. Research Methodology
List of Figures
- Figure 1: Global Augmented Analytics Market Revenue Breakdown (Million, %) by Region 2025 & 2033
- Figure 2: North America Augmented Analytics Market Revenue (Million), by Deployment 2025 & 2033
- Figure 3: North America Augmented Analytics Market Revenue Share (%), by Deployment 2025 & 2033
- Figure 4: North America Augmented Analytics Market Revenue (Million), by End-user Industry 2025 & 2033
- Figure 5: North America Augmented Analytics Market Revenue Share (%), by End-user Industry 2025 & 2033
- Figure 6: North America Augmented Analytics Market Revenue (Million), by Country 2025 & 2033
- Figure 7: North America Augmented Analytics Market Revenue Share (%), by Country 2025 & 2033
- Figure 8: Europe Augmented Analytics Market Revenue (Million), by Deployment 2025 & 2033
- Figure 9: Europe Augmented Analytics Market Revenue Share (%), by Deployment 2025 & 2033
- Figure 10: Europe Augmented Analytics Market Revenue (Million), by End-user Industry 2025 & 2033
- Figure 11: Europe Augmented Analytics Market Revenue Share (%), by End-user Industry 2025 & 2033
- Figure 12: Europe Augmented Analytics Market Revenue (Million), by Country 2025 & 2033
- Figure 13: Europe Augmented Analytics Market Revenue Share (%), by Country 2025 & 2033
- Figure 14: Asia Pacific Augmented Analytics Market Revenue (Million), by Deployment 2025 & 2033
- Figure 15: Asia Pacific Augmented Analytics Market Revenue Share (%), by Deployment 2025 & 2033
- Figure 16: Asia Pacific Augmented Analytics Market Revenue (Million), by End-user Industry 2025 & 2033
- Figure 17: Asia Pacific Augmented Analytics Market Revenue Share (%), by End-user Industry 2025 & 2033
- Figure 18: Asia Pacific Augmented Analytics Market Revenue (Million), by Country 2025 & 2033
- Figure 19: Asia Pacific Augmented Analytics Market Revenue Share (%), by Country 2025 & 2033
- Figure 20: Rest of the World Augmented Analytics Market Revenue (Million), by Deployment 2025 & 2033
- Figure 21: Rest of the World Augmented Analytics Market Revenue Share (%), by Deployment 2025 & 2033
- Figure 22: Rest of the World Augmented Analytics Market Revenue (Million), by End-user Industry 2025 & 2033
- Figure 23: Rest of the World Augmented Analytics Market Revenue Share (%), by End-user Industry 2025 & 2033
- Figure 24: Rest of the World Augmented Analytics Market Revenue (Million), by Country 2025 & 2033
- Figure 25: Rest of the World Augmented Analytics Market Revenue Share (%), by Country 2025 & 2033
List of Tables
- Table 1: Global Augmented Analytics Market Revenue Million Forecast, by Deployment 2020 & 2033
- Table 2: Global Augmented Analytics Market Revenue Million Forecast, by End-user Industry 2020 & 2033
- Table 3: Global Augmented Analytics Market Revenue Million Forecast, by Region 2020 & 2033
- Table 4: Global Augmented Analytics Market Revenue Million Forecast, by Deployment 2020 & 2033
- Table 5: Global Augmented Analytics Market Revenue Million Forecast, by End-user Industry 2020 & 2033
- Table 6: Global Augmented Analytics Market Revenue Million Forecast, by Country 2020 & 2033
- Table 7: Global Augmented Analytics Market Revenue Million Forecast, by Deployment 2020 & 2033
- Table 8: Global Augmented Analytics Market Revenue Million Forecast, by End-user Industry 2020 & 2033
- Table 9: Global Augmented Analytics Market Revenue Million Forecast, by Country 2020 & 2033
- Table 10: Global Augmented Analytics Market Revenue Million Forecast, by Deployment 2020 & 2033
- Table 11: Global Augmented Analytics Market Revenue Million Forecast, by End-user Industry 2020 & 2033
- Table 12: Global Augmented Analytics Market Revenue Million Forecast, by Country 2020 & 2033
- Table 13: Global Augmented Analytics Market Revenue Million Forecast, by Deployment 2020 & 2033
- Table 14: Global Augmented Analytics Market Revenue Million Forecast, by End-user Industry 2020 & 2033
- Table 15: Global Augmented Analytics Market Revenue Million Forecast, by Country 2020 & 2033
Frequently Asked Questions
1. What is the projected Compound Annual Growth Rate (CAGR) of the Augmented Analytics Market?
The projected CAGR is approximately 28.09%.
2. Which companies are prominent players in the Augmented Analytics Market?
Key companies in the market include SAS Institute Inc, TIBCO Software Inc, IBM Corporation, ThoughtSpot Inc, GoodData Corporation*List Not Exhaustive, Microsoft Corporation, QlikTech International AB, Sisense Inc, SAP SE, MicroStrategy Inc, Salesforce com inc.
3. What are the main segments of the Augmented Analytics Market?
The market segments include Deployment, End-user Industry.
4. Can you provide details about the market size?
The market size is estimated to be USD 23.27 Million as of 2022.
5. What are some drivers contributing to market growth?
Increasing Demand to Cater Complex Business Data; Huge Adoption of Business Intelligence Tools.
6. What are the notable trends driving market growth?
Retail Sector is Expected to Have a Significant Growth During the Forecast Period.
7. Are there any restraints impacting market growth?
Resistance Due to Replacement of Human Intelligence.
8. Can you provide examples of recent developments in the market?
May 2023: TrinityLife Sciences, a leader in global life sciences commercialization solutions, and WhizAI, a leader in AI-powered analytics for life sciences and healthcare, announced a strategic partnership that allows life sciences companies to quickly and easily generate and share AI-driven insights. WhizAI’s augmented analytics can be layered on Trinity’s enterprise reporting platforms to bring insights to more organizational stakeholders.
9. What pricing options are available for accessing the report?
Pricing options include single-user, multi-user, and enterprise licenses priced at USD 4750, USD 5250, and USD 8750 respectively.
10. Is the market size provided in terms of value or volume?
The market size is provided in terms of value, measured in Million.
11. Are there any specific market keywords associated with the report?
Yes, the market keyword associated with the report is "Augmented Analytics Market," which aids in identifying and referencing the specific market segment covered.
12. How do I determine which pricing option suits my needs best?
The pricing options vary based on user requirements and access needs. Individual users may opt for single-user licenses, while businesses requiring broader access may choose multi-user or enterprise licenses for cost-effective access to the report.
13. Are there any additional resources or data provided in the Augmented Analytics Market report?
While the report offers comprehensive insights, it's advisable to review the specific contents or supplementary materials provided to ascertain if additional resources or data are available.
14. How can I stay updated on further developments or reports in the Augmented Analytics Market?
To stay informed about further developments, trends, and reports in the Augmented Analytics Market, consider subscribing to industry newsletters, following relevant companies and organizations, or regularly checking reputable industry news sources and publications.
Methodology
Step 1 - Identification of Relevant Samples Size from Population Database


Step 2 - Approaches for Defining Global Market Size (Value, Volume* & Price*)

Note*: In applicable scenarios
Step 3 - Data Sources
Primary Research
- Web Analytics
- Survey Reports
- Research Institute
- Latest Research Reports
- Opinion Leaders
Secondary Research
- Annual Reports
- White Paper
- Latest Press Release
- Industry Association
- Paid Database
- Investor Presentations

Step 4 - Data Triangulation
Involves using different sources of information in order to increase the validity of a study
These sources are likely to be stakeholders in a program - participants, other researchers, program staff, other community members, and so on.
Then we put all data in single framework & apply various statistical tools to find out the dynamic on the market.
During the analysis stage, feedback from the stakeholder groups would be compared to determine areas of agreement as well as areas of divergence