
Key Insights
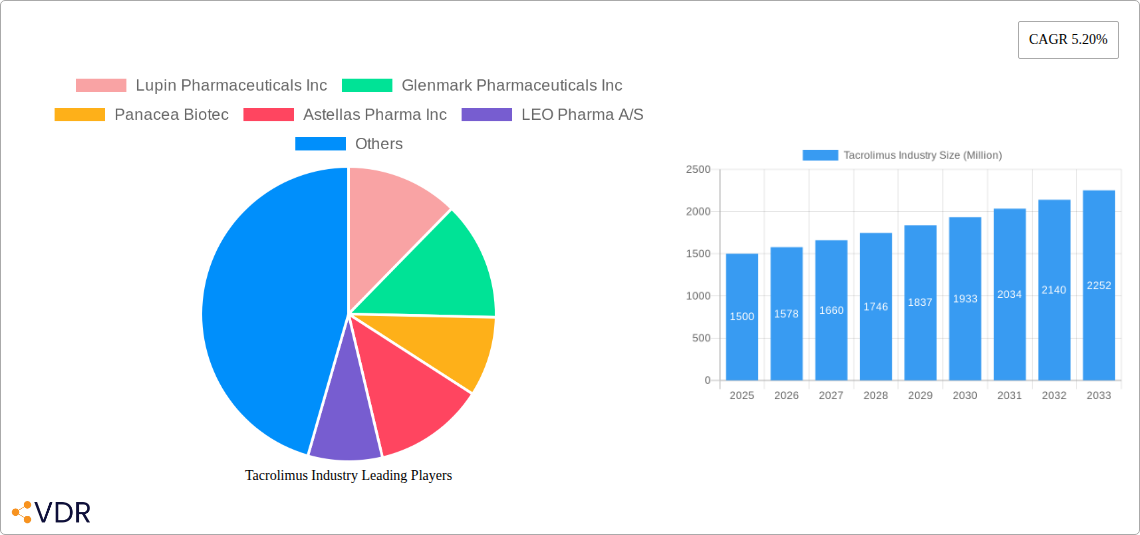
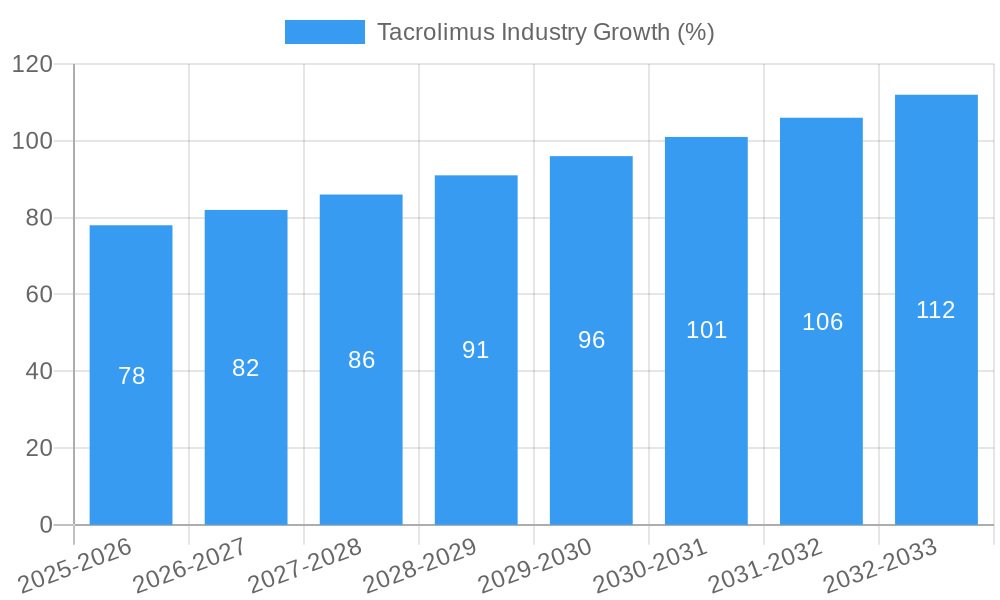
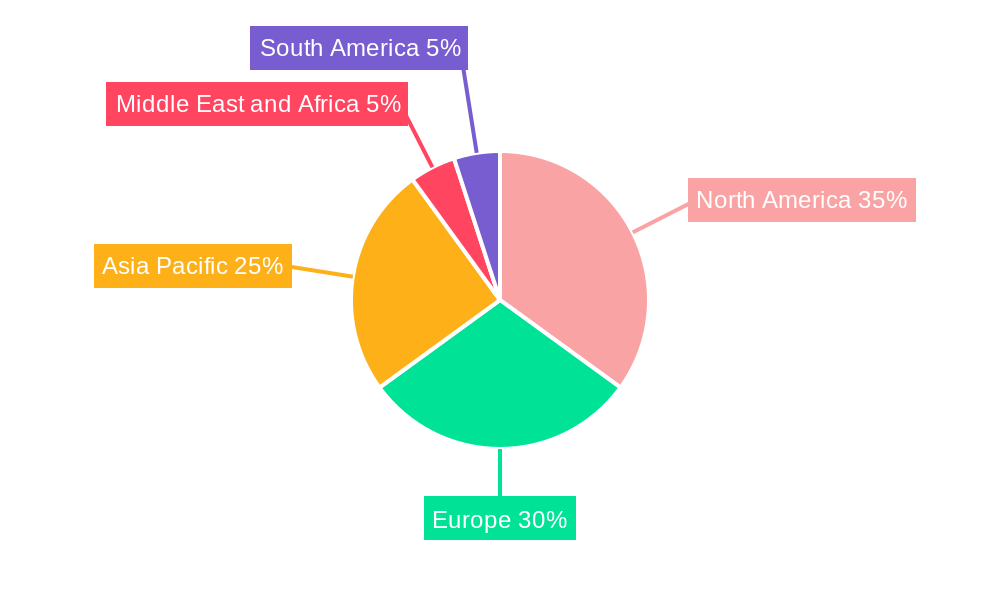
The global Tacrolimus market, valued at approximately $1.5 billion in 2025, is projected to experience robust growth, exhibiting a Compound Annual Growth Rate (CAGR) of 5.20% from 2025 to 2033. This expansion is driven by several key factors. The rising prevalence of autoimmune diseases like dermatitis and organ transplantation procedures fuels the demand for immunosuppressants such as Tacrolimus. Furthermore, ongoing research and development efforts focused on improving drug delivery systems (e.g., novel formulations like prolonged-release capsules) and expanding its applications in other therapeutic areas contribute to market growth. Increased awareness among healthcare professionals and patients regarding the efficacy and safety of Tacrolimus also plays a significant role. The market is segmented by product type (tablets and capsules holding the largest share, followed by injections and others), application (immunosuppression dominating due to its crucial role in transplantation), and end-users (hospitals and clinics being the primary consumers). Geographical growth is expected to be significant across regions, with North America and Europe likely maintaining substantial market shares due to high healthcare expenditure and established healthcare infrastructure, while Asia Pacific is poised for rapid expansion driven by increasing healthcare investment and growing prevalence of target diseases. However, factors like stringent regulatory approvals and the potential for adverse effects associated with Tacrolimus could act as restraints on market growth.
Competitive landscape analysis reveals a mix of established pharmaceutical giants (such as Novartis AG, GlaxoSmithKline plc, and Pfizer Inc.) and specialized companies (like Astellas Pharma Inc. and LEO Pharma A/S) vying for market share. These companies are actively engaged in strategic initiatives, including product diversification, geographic expansion, and mergers and acquisitions, to enhance their market position. The increasing focus on biosimilars could also impact the market dynamics in the coming years, presenting both opportunities and challenges for existing players. The forecast period (2025-2033) anticipates consistent growth, primarily fueled by the continuous rise in autoimmune diseases and the expanding application of Tacrolimus in various therapeutic areas, leading to an expected market value exceeding $2.5 billion by 2033.
Tacrolimus Industry Market Report: 2019-2033
This comprehensive report provides a detailed analysis of the global Tacrolimus market, covering market dynamics, growth trends, regional segmentation, product landscape, key players, and future outlook. The study period spans 2019-2033, with a base year of 2025 and a forecast period of 2025-2033. The report leverages extensive primary and secondary research to deliver actionable insights for industry professionals, investors, and stakeholders. The market is segmented by product type (Tablets and Capsules, Injections, Others), application (Immunosuppression, Dermatitis, Others), and end-users (Hospitals, Clinics, Other End Users).
Tacrolimus Industry Market Dynamics & Structure
The global Tacrolimus market is characterized by a moderately concentrated structure with a few major players holding significant market share. The market exhibits a dynamic interplay of technological advancements, stringent regulatory frameworks, and the presence of competitive substitute therapies. Market growth is primarily driven by the increasing prevalence of autoimmune diseases and dermatological conditions requiring immunosuppression. Mergers and acquisitions (M&A) activity has been moderate, with strategic partnerships playing a more significant role in shaping market dynamics. Innovation in drug delivery systems and the development of biosimilars are key factors impacting the market landscape.
- Market Concentration: The top 5 players hold approximately xx% of the market share (2024).
- Technological Innovation: Ongoing research focuses on improving drug delivery, reducing side effects, and developing biosimilars.
- Regulatory Framework: Stringent regulatory approvals and post-market surveillance impact market entry and product lifecycle.
- Competitive Substitutes: Other immunosuppressants and topical corticosteroids pose competitive pressure.
- End-User Demographics: Growing geriatric population and increasing prevalence of autoimmune disorders are key drivers.
- M&A Trends: xx M&A deals recorded between 2019 and 2024, primarily focused on strategic partnerships and licensing agreements.
Tacrolimus Industry Growth Trends & Insights
The global Tacrolimus market witnessed substantial growth during the historical period (2019-2024), driven by rising incidence of autoimmune diseases and a growing demand for effective immunosuppressants. The market is projected to maintain a healthy CAGR of xx% during the forecast period (2025-2033), fueled by factors such as increasing healthcare expenditure, rising awareness about autoimmune disorders, and advancements in drug delivery systems. The adoption rate of Tacrolimus is influenced by factors like cost-effectiveness, efficacy, and the availability of generic alternatives. Market penetration remains high in developed regions but is expected to increase significantly in emerging markets.
Dominant Regions, Countries, or Segments in Tacrolimus Industry
North America currently holds the largest market share in the Tacrolimus industry, followed by Europe and Asia-Pacific. Within product types, Tablets and Capsules dominate the market due to their ease of administration and cost-effectiveness. Immunosuppression remains the leading application segment, driven by the increasing prevalence of organ transplantation and autoimmune diseases. Hospitals and clinics constitute the major end-user segments due to the specialized nature of Tacrolimus administration and monitoring.
- Key Drivers (North America): High healthcare expenditure, advanced healthcare infrastructure, and established distribution channels.
- Key Drivers (Europe): Rising prevalence of autoimmune diseases, robust healthcare systems, and favorable regulatory environment.
- Key Drivers (Asia-Pacific): Increasing healthcare spending, rising awareness of autoimmune disorders, and growing adoption of advanced therapies.
- Segment Dominance: Tablets and Capsules (xx Million units in 2024), Immunosuppression Application (xx Million units in 2024), Hospitals (xx Million units in 2024).
Tacrolimus Industry Product Landscape
The Tacrolimus market offers various formulations, including tablets, capsules, and injections, each catering to specific needs and administration routes. Recent innovations have focused on developing novel drug delivery systems to enhance efficacy and reduce side effects. This includes topical formulations for dermatological applications and extended-release preparations for improved patient compliance. The focus is on differentiating products based on efficacy, safety profiles, and convenience of administration.
Key Drivers, Barriers & Challenges in Tacrolimus Industry
Key Drivers:
- Growing prevalence of autoimmune diseases and organ transplantation.
- Increasing healthcare spending and improved healthcare infrastructure.
- Technological advancements in drug delivery and formulation.
- Favorable regulatory environment in certain regions.
Key Challenges:
- High cost of treatment, limiting accessibility in some regions.
- Potential for severe side effects, necessitating careful monitoring.
- Emergence of biosimilars impacting pricing and market competition.
- Stringent regulatory requirements for approval and market entry. This results in an estimated xx% reduction in potential market growth annually.
Emerging Opportunities in Tacrolimus Industry
- Expansion into untapped markets in developing countries.
- Development of novel formulations with improved safety and efficacy.
- Exploration of new therapeutic applications beyond immunosuppression and dermatology.
- Strategic partnerships and collaborations to enhance market penetration.
Growth Accelerators in the Tacrolimus Industry
The Tacrolimus market is poised for continued growth, driven by technological advancements in drug delivery, the emergence of biosimilars, and strategic partnerships aimed at expanding market reach. Furthermore, increasing awareness of autoimmune diseases and growing healthcare expenditure in developing economies will fuel market expansion in the coming years. The successful launch of novel formulations and innovative applications will further contribute to market growth.
Key Players Shaping the Tacrolimus Industry Market
- Lupin Pharmaceuticals Inc
- Glenmark Pharmaceuticals Inc
- Panacea Biotec
- Astellas Pharma Inc
- LEO Pharma A/S
- GlaxoSmithKline plc
- Novartis AG
- Biocon Ltd
- Dr Reddy's Laboratories Ltd
- Pfizer Inc
Notable Milestones in Tacrolimus Industry Sector
- 2020: Launch of a novel Tacrolimus formulation by Astellas Pharma Inc.
- 2022: Approval of a biosimilar Tacrolimus product in Europe.
- 2023: Strategic partnership between Lupin Pharmaceuticals Inc and a generic manufacturer for Tacrolimus.
In-Depth Tacrolimus Industry Market Outlook
The Tacrolimus market is projected to experience robust growth over the forecast period (2025-2033), driven by unmet medical needs, ongoing research and development efforts, and favorable regulatory landscapes in various regions. Strategic partnerships, focused on market expansion and product diversification, will play a crucial role in shaping market dynamics. The emergence of novel formulations and the continued demand for effective immunosuppressants will contribute significantly to the growth of the Tacrolimus market.
Tacrolimus Industry Segmentation
-
1. Product Type
- 1.1. Tablets and Capsules
- 1.2. Injections
- 1.3. Others (Ointments, Granules)
-
2. Application
- 2.1. Immunosuppression
- 2.2. Dermatitis
- 2.3. Others (Vitiligo, Eczema)
-
3. End Users
- 3.1. Hospitals
- 3.2. Clinics
- 3.3. Other End Users
Tacrolimus Industry Segmentation By Geography
-
1. North America
- 1.1. United States
- 1.2. Canada
- 1.3. Mexico
-
2. Europe
- 2.1. Germany
- 2.2. United Kingdom
- 2.3. France
- 2.4. Italy
- 2.5. Spain
- 2.6. Rest of Europe
-
3. Asia Pacific
- 3.1. China
- 3.2. Japan
- 3.3. India
- 3.4. Australia
- 3.5. South Korea
- 3.6. Rest of Asia Pacific
-
4. Middle East and Africa
- 4.1. GCC
- 4.2. South Africa
- 4.3. Rest of Middle East and Africa
-
5. South America
- 5.1. Brazil
- 5.2. Argentina
- 5.3. Rest of South America
Tacrolimus Industry REPORT HIGHLIGHTS
| Aspects | Details |
|---|---|
| Study Period | 2019-2033 |
| Base Year | 2024 |
| Estimated Year | 2025 |
| Forecast Period | 2025-2033 |
| Historical Period | 2019-2024 |
| Growth Rate | CAGR of 5.20% from 2019-2033 |
| Segmentation |
|
Table of Contents
- 1. Introduction
- 1.1. Research Scope
- 1.2. Market Segmentation
- 1.3. Research Methodology
- 1.4. Definitions and Assumptions
- 2. Executive Summary
- 2.1. Introduction
- 3. Market Dynamics
- 3.1. Introduction
- 3.2. Market Drivers
- 3.2.1. Increasing Number of Transplants Worldwide; Surge in Research and Development Activities for Immunosuppression
- 3.3. Market Restrains
- 3.3.1. Side Effects of the Tacrolimus
- 3.4. Market Trends
- 3.4.1. Immunosuppression Segment is Expected to Witness Growth over the Forecast Period
- 4. Market Factor Analysis
- 4.1. Porters Five Forces
- 4.2. Supply/Value Chain
- 4.3. PESTEL analysis
- 4.4. Market Entropy
- 4.5. Patent/Trademark Analysis
- 5. Global Tacrolimus Industry Analysis, Insights and Forecast, 2019-2031
- 5.1. Market Analysis, Insights and Forecast - by Product Type
- 5.1.1. Tablets and Capsules
- 5.1.2. Injections
- 5.1.3. Others (Ointments, Granules)
- 5.2. Market Analysis, Insights and Forecast - by Application
- 5.2.1. Immunosuppression
- 5.2.2. Dermatitis
- 5.2.3. Others (Vitiligo, Eczema)
- 5.3. Market Analysis, Insights and Forecast - by End Users
- 5.3.1. Hospitals
- 5.3.2. Clinics
- 5.3.3. Other End Users
- 5.4. Market Analysis, Insights and Forecast - by Region
- 5.4.1. North America
- 5.4.2. Europe
- 5.4.3. Asia Pacific
- 5.4.4. Middle East and Africa
- 5.4.5. South America
- 5.1. Market Analysis, Insights and Forecast - by Product Type
- 6. North America Tacrolimus Industry Analysis, Insights and Forecast, 2019-2031
- 6.1. Market Analysis, Insights and Forecast - by Product Type
- 6.1.1. Tablets and Capsules
- 6.1.2. Injections
- 6.1.3. Others (Ointments, Granules)
- 6.2. Market Analysis, Insights and Forecast - by Application
- 6.2.1. Immunosuppression
- 6.2.2. Dermatitis
- 6.2.3. Others (Vitiligo, Eczema)
- 6.3. Market Analysis, Insights and Forecast - by End Users
- 6.3.1. Hospitals
- 6.3.2. Clinics
- 6.3.3. Other End Users
- 6.1. Market Analysis, Insights and Forecast - by Product Type
- 7. Europe Tacrolimus Industry Analysis, Insights and Forecast, 2019-2031
- 7.1. Market Analysis, Insights and Forecast - by Product Type
- 7.1.1. Tablets and Capsules
- 7.1.2. Injections
- 7.1.3. Others (Ointments, Granules)
- 7.2. Market Analysis, Insights and Forecast - by Application
- 7.2.1. Immunosuppression
- 7.2.2. Dermatitis
- 7.2.3. Others (Vitiligo, Eczema)
- 7.3. Market Analysis, Insights and Forecast - by End Users
- 7.3.1. Hospitals
- 7.3.2. Clinics
- 7.3.3. Other End Users
- 7.1. Market Analysis, Insights and Forecast - by Product Type
- 8. Asia Pacific Tacrolimus Industry Analysis, Insights and Forecast, 2019-2031
- 8.1. Market Analysis, Insights and Forecast - by Product Type
- 8.1.1. Tablets and Capsules
- 8.1.2. Injections
- 8.1.3. Others (Ointments, Granules)
- 8.2. Market Analysis, Insights and Forecast - by Application
- 8.2.1. Immunosuppression
- 8.2.2. Dermatitis
- 8.2.3. Others (Vitiligo, Eczema)
- 8.3. Market Analysis, Insights and Forecast - by End Users
- 8.3.1. Hospitals
- 8.3.2. Clinics
- 8.3.3. Other End Users
- 8.1. Market Analysis, Insights and Forecast - by Product Type
- 9. Middle East and Africa Tacrolimus Industry Analysis, Insights and Forecast, 2019-2031
- 9.1. Market Analysis, Insights and Forecast - by Product Type
- 9.1.1. Tablets and Capsules
- 9.1.2. Injections
- 9.1.3. Others (Ointments, Granules)
- 9.2. Market Analysis, Insights and Forecast - by Application
- 9.2.1. Immunosuppression
- 9.2.2. Dermatitis
- 9.2.3. Others (Vitiligo, Eczema)
- 9.3. Market Analysis, Insights and Forecast - by End Users
- 9.3.1. Hospitals
- 9.3.2. Clinics
- 9.3.3. Other End Users
- 9.1. Market Analysis, Insights and Forecast - by Product Type
- 10. South America Tacrolimus Industry Analysis, Insights and Forecast, 2019-2031
- 10.1. Market Analysis, Insights and Forecast - by Product Type
- 10.1.1. Tablets and Capsules
- 10.1.2. Injections
- 10.1.3. Others (Ointments, Granules)
- 10.2. Market Analysis, Insights and Forecast - by Application
- 10.2.1. Immunosuppression
- 10.2.2. Dermatitis
- 10.2.3. Others (Vitiligo, Eczema)
- 10.3. Market Analysis, Insights and Forecast - by End Users
- 10.3.1. Hospitals
- 10.3.2. Clinics
- 10.3.3. Other End Users
- 10.1. Market Analysis, Insights and Forecast - by Product Type
- 11. North America Tacrolimus Industry Analysis, Insights and Forecast, 2019-2031
- 11.1. Market Analysis, Insights and Forecast - By Country/Sub-region
- 11.1.1. undefined
- 12. Europe Tacrolimus Industry Analysis, Insights and Forecast, 2019-2031
- 12.1. Market Analysis, Insights and Forecast - By Country/Sub-region
- 12.1.1. undefined
- 13. Asia Pacific Tacrolimus Industry Analysis, Insights and Forecast, 2019-2031
- 13.1. Market Analysis, Insights and Forecast - By Country/Sub-region
- 13.1.1. undefined
- 14. Middle East and Africa Tacrolimus Industry Analysis, Insights and Forecast, 2019-2031
- 14.1. Market Analysis, Insights and Forecast - By Country/Sub-region
- 14.1.1. undefined
- 15. South America Tacrolimus Industry Analysis, Insights and Forecast, 2019-2031
- 15.1. Market Analysis, Insights and Forecast - By Country/Sub-region
- 15.1.1. undefined
- 16. Competitive Analysis
- 16.1. Global Market Share Analysis 2024
- 16.2. Company Profiles
- 16.2.1 Lupin Pharmaceuticals Inc
- 16.2.1.1. Overview
- 16.2.1.2. Products
- 16.2.1.3. SWOT Analysis
- 16.2.1.4. Recent Developments
- 16.2.1.5. Financials (Based on Availability)
- 16.2.2 Glenmark Pharmaceuticals Inc
- 16.2.2.1. Overview
- 16.2.2.2. Products
- 16.2.2.3. SWOT Analysis
- 16.2.2.4. Recent Developments
- 16.2.2.5. Financials (Based on Availability)
- 16.2.3 Panacea Biotec
- 16.2.3.1. Overview
- 16.2.3.2. Products
- 16.2.3.3. SWOT Analysis
- 16.2.3.4. Recent Developments
- 16.2.3.5. Financials (Based on Availability)
- 16.2.4 Astellas Pharma Inc
- 16.2.4.1. Overview
- 16.2.4.2. Products
- 16.2.4.3. SWOT Analysis
- 16.2.4.4. Recent Developments
- 16.2.4.5. Financials (Based on Availability)
- 16.2.5 LEO Pharma A/S
- 16.2.5.1. Overview
- 16.2.5.2. Products
- 16.2.5.3. SWOT Analysis
- 16.2.5.4. Recent Developments
- 16.2.5.5. Financials (Based on Availability)
- 16.2.6 GlaxoSmithKline plc
- 16.2.6.1. Overview
- 16.2.6.2. Products
- 16.2.6.3. SWOT Analysis
- 16.2.6.4. Recent Developments
- 16.2.6.5. Financials (Based on Availability)
- 16.2.7 Novartis AG
- 16.2.7.1. Overview
- 16.2.7.2. Products
- 16.2.7.3. SWOT Analysis
- 16.2.7.4. Recent Developments
- 16.2.7.5. Financials (Based on Availability)
- 16.2.8 Biocon Ltd
- 16.2.8.1. Overview
- 16.2.8.2. Products
- 16.2.8.3. SWOT Analysis
- 16.2.8.4. Recent Developments
- 16.2.8.5. Financials (Based on Availability)
- 16.2.9 Dr Reddy's Laboratories Ltd
- 16.2.9.1. Overview
- 16.2.9.2. Products
- 16.2.9.3. SWOT Analysis
- 16.2.9.4. Recent Developments
- 16.2.9.5. Financials (Based on Availability)
- 16.2.10 Pfizer Inc
- 16.2.10.1. Overview
- 16.2.10.2. Products
- 16.2.10.3. SWOT Analysis
- 16.2.10.4. Recent Developments
- 16.2.10.5. Financials (Based on Availability)
- 16.2.1 Lupin Pharmaceuticals Inc
List of Figures
- Figure 1: Global Tacrolimus Industry Revenue Breakdown (Million, %) by Region 2024 & 2032
- Figure 2: Global Tacrolimus Industry Volume Breakdown (K Unit, %) by Region 2024 & 2032
- Figure 3: North America Tacrolimus Industry Revenue (Million), by Country 2024 & 2032
- Figure 4: North America Tacrolimus Industry Volume (K Unit), by Country 2024 & 2032
- Figure 5: North America Tacrolimus Industry Revenue Share (%), by Country 2024 & 2032
- Figure 6: North America Tacrolimus Industry Volume Share (%), by Country 2024 & 2032
- Figure 7: Europe Tacrolimus Industry Revenue (Million), by Country 2024 & 2032
- Figure 8: Europe Tacrolimus Industry Volume (K Unit), by Country 2024 & 2032
- Figure 9: Europe Tacrolimus Industry Revenue Share (%), by Country 2024 & 2032
- Figure 10: Europe Tacrolimus Industry Volume Share (%), by Country 2024 & 2032
- Figure 11: Asia Pacific Tacrolimus Industry Revenue (Million), by Country 2024 & 2032
- Figure 12: Asia Pacific Tacrolimus Industry Volume (K Unit), by Country 2024 & 2032
- Figure 13: Asia Pacific Tacrolimus Industry Revenue Share (%), by Country 2024 & 2032
- Figure 14: Asia Pacific Tacrolimus Industry Volume Share (%), by Country 2024 & 2032
- Figure 15: Middle East and Africa Tacrolimus Industry Revenue (Million), by Country 2024 & 2032
- Figure 16: Middle East and Africa Tacrolimus Industry Volume (K Unit), by Country 2024 & 2032
- Figure 17: Middle East and Africa Tacrolimus Industry Revenue Share (%), by Country 2024 & 2032
- Figure 18: Middle East and Africa Tacrolimus Industry Volume Share (%), by Country 2024 & 2032
- Figure 19: South America Tacrolimus Industry Revenue (Million), by Country 2024 & 2032
- Figure 20: South America Tacrolimus Industry Volume (K Unit), by Country 2024 & 2032
- Figure 21: South America Tacrolimus Industry Revenue Share (%), by Country 2024 & 2032
- Figure 22: South America Tacrolimus Industry Volume Share (%), by Country 2024 & 2032
- Figure 23: North America Tacrolimus Industry Revenue (Million), by Product Type 2024 & 2032
- Figure 24: North America Tacrolimus Industry Volume (K Unit), by Product Type 2024 & 2032
- Figure 25: North America Tacrolimus Industry Revenue Share (%), by Product Type 2024 & 2032
- Figure 26: North America Tacrolimus Industry Volume Share (%), by Product Type 2024 & 2032
- Figure 27: North America Tacrolimus Industry Revenue (Million), by Application 2024 & 2032
- Figure 28: North America Tacrolimus Industry Volume (K Unit), by Application 2024 & 2032
- Figure 29: North America Tacrolimus Industry Revenue Share (%), by Application 2024 & 2032
- Figure 30: North America Tacrolimus Industry Volume Share (%), by Application 2024 & 2032
- Figure 31: North America Tacrolimus Industry Revenue (Million), by End Users 2024 & 2032
- Figure 32: North America Tacrolimus Industry Volume (K Unit), by End Users 2024 & 2032
- Figure 33: North America Tacrolimus Industry Revenue Share (%), by End Users 2024 & 2032
- Figure 34: North America Tacrolimus Industry Volume Share (%), by End Users 2024 & 2032
- Figure 35: North America Tacrolimus Industry Revenue (Million), by Country 2024 & 2032
- Figure 36: North America Tacrolimus Industry Volume (K Unit), by Country 2024 & 2032
- Figure 37: North America Tacrolimus Industry Revenue Share (%), by Country 2024 & 2032
- Figure 38: North America Tacrolimus Industry Volume Share (%), by Country 2024 & 2032
- Figure 39: Europe Tacrolimus Industry Revenue (Million), by Product Type 2024 & 2032
- Figure 40: Europe Tacrolimus Industry Volume (K Unit), by Product Type 2024 & 2032
- Figure 41: Europe Tacrolimus Industry Revenue Share (%), by Product Type 2024 & 2032
- Figure 42: Europe Tacrolimus Industry Volume Share (%), by Product Type 2024 & 2032
- Figure 43: Europe Tacrolimus Industry Revenue (Million), by Application 2024 & 2032
- Figure 44: Europe Tacrolimus Industry Volume (K Unit), by Application 2024 & 2032
- Figure 45: Europe Tacrolimus Industry Revenue Share (%), by Application 2024 & 2032
- Figure 46: Europe Tacrolimus Industry Volume Share (%), by Application 2024 & 2032
- Figure 47: Europe Tacrolimus Industry Revenue (Million), by End Users 2024 & 2032
- Figure 48: Europe Tacrolimus Industry Volume (K Unit), by End Users 2024 & 2032
- Figure 49: Europe Tacrolimus Industry Revenue Share (%), by End Users 2024 & 2032
- Figure 50: Europe Tacrolimus Industry Volume Share (%), by End Users 2024 & 2032
- Figure 51: Europe Tacrolimus Industry Revenue (Million), by Country 2024 & 2032
- Figure 52: Europe Tacrolimus Industry Volume (K Unit), by Country 2024 & 2032
- Figure 53: Europe Tacrolimus Industry Revenue Share (%), by Country 2024 & 2032
- Figure 54: Europe Tacrolimus Industry Volume Share (%), by Country 2024 & 2032
- Figure 55: Asia Pacific Tacrolimus Industry Revenue (Million), by Product Type 2024 & 2032
- Figure 56: Asia Pacific Tacrolimus Industry Volume (K Unit), by Product Type 2024 & 2032
- Figure 57: Asia Pacific Tacrolimus Industry Revenue Share (%), by Product Type 2024 & 2032
- Figure 58: Asia Pacific Tacrolimus Industry Volume Share (%), by Product Type 2024 & 2032
- Figure 59: Asia Pacific Tacrolimus Industry Revenue (Million), by Application 2024 & 2032
- Figure 60: Asia Pacific Tacrolimus Industry Volume (K Unit), by Application 2024 & 2032
- Figure 61: Asia Pacific Tacrolimus Industry Revenue Share (%), by Application 2024 & 2032
- Figure 62: Asia Pacific Tacrolimus Industry Volume Share (%), by Application 2024 & 2032
- Figure 63: Asia Pacific Tacrolimus Industry Revenue (Million), by End Users 2024 & 2032
- Figure 64: Asia Pacific Tacrolimus Industry Volume (K Unit), by End Users 2024 & 2032
- Figure 65: Asia Pacific Tacrolimus Industry Revenue Share (%), by End Users 2024 & 2032
- Figure 66: Asia Pacific Tacrolimus Industry Volume Share (%), by End Users 2024 & 2032
- Figure 67: Asia Pacific Tacrolimus Industry Revenue (Million), by Country 2024 & 2032
- Figure 68: Asia Pacific Tacrolimus Industry Volume (K Unit), by Country 2024 & 2032
- Figure 69: Asia Pacific Tacrolimus Industry Revenue Share (%), by Country 2024 & 2032
- Figure 70: Asia Pacific Tacrolimus Industry Volume Share (%), by Country 2024 & 2032
- Figure 71: Middle East and Africa Tacrolimus Industry Revenue (Million), by Product Type 2024 & 2032
- Figure 72: Middle East and Africa Tacrolimus Industry Volume (K Unit), by Product Type 2024 & 2032
- Figure 73: Middle East and Africa Tacrolimus Industry Revenue Share (%), by Product Type 2024 & 2032
- Figure 74: Middle East and Africa Tacrolimus Industry Volume Share (%), by Product Type 2024 & 2032
- Figure 75: Middle East and Africa Tacrolimus Industry Revenue (Million), by Application 2024 & 2032
- Figure 76: Middle East and Africa Tacrolimus Industry Volume (K Unit), by Application 2024 & 2032
- Figure 77: Middle East and Africa Tacrolimus Industry Revenue Share (%), by Application 2024 & 2032
- Figure 78: Middle East and Africa Tacrolimus Industry Volume Share (%), by Application 2024 & 2032
- Figure 79: Middle East and Africa Tacrolimus Industry Revenue (Million), by End Users 2024 & 2032
- Figure 80: Middle East and Africa Tacrolimus Industry Volume (K Unit), by End Users 2024 & 2032
- Figure 81: Middle East and Africa Tacrolimus Industry Revenue Share (%), by End Users 2024 & 2032
- Figure 82: Middle East and Africa Tacrolimus Industry Volume Share (%), by End Users 2024 & 2032
- Figure 83: Middle East and Africa Tacrolimus Industry Revenue (Million), by Country 2024 & 2032
- Figure 84: Middle East and Africa Tacrolimus Industry Volume (K Unit), by Country 2024 & 2032
- Figure 85: Middle East and Africa Tacrolimus Industry Revenue Share (%), by Country 2024 & 2032
- Figure 86: Middle East and Africa Tacrolimus Industry Volume Share (%), by Country 2024 & 2032
- Figure 87: South America Tacrolimus Industry Revenue (Million), by Product Type 2024 & 2032
- Figure 88: South America Tacrolimus Industry Volume (K Unit), by Product Type 2024 & 2032
- Figure 89: South America Tacrolimus Industry Revenue Share (%), by Product Type 2024 & 2032
- Figure 90: South America Tacrolimus Industry Volume Share (%), by Product Type 2024 & 2032
- Figure 91: South America Tacrolimus Industry Revenue (Million), by Application 2024 & 2032
- Figure 92: South America Tacrolimus Industry Volume (K Unit), by Application 2024 & 2032
- Figure 93: South America Tacrolimus Industry Revenue Share (%), by Application 2024 & 2032
- Figure 94: South America Tacrolimus Industry Volume Share (%), by Application 2024 & 2032
- Figure 95: South America Tacrolimus Industry Revenue (Million), by End Users 2024 & 2032
- Figure 96: South America Tacrolimus Industry Volume (K Unit), by End Users 2024 & 2032
- Figure 97: South America Tacrolimus Industry Revenue Share (%), by End Users 2024 & 2032
- Figure 98: South America Tacrolimus Industry Volume Share (%), by End Users 2024 & 2032
- Figure 99: South America Tacrolimus Industry Revenue (Million), by Country 2024 & 2032
- Figure 100: South America Tacrolimus Industry Volume (K Unit), by Country 2024 & 2032
- Figure 101: South America Tacrolimus Industry Revenue Share (%), by Country 2024 & 2032
- Figure 102: South America Tacrolimus Industry Volume Share (%), by Country 2024 & 2032
List of Tables
- Table 1: Global Tacrolimus Industry Revenue Million Forecast, by Region 2019 & 2032
- Table 2: Global Tacrolimus Industry Volume K Unit Forecast, by Region 2019 & 2032
- Table 3: Global Tacrolimus Industry Revenue Million Forecast, by Product Type 2019 & 2032
- Table 4: Global Tacrolimus Industry Volume K Unit Forecast, by Product Type 2019 & 2032
- Table 5: Global Tacrolimus Industry Revenue Million Forecast, by Application 2019 & 2032
- Table 6: Global Tacrolimus Industry Volume K Unit Forecast, by Application 2019 & 2032
- Table 7: Global Tacrolimus Industry Revenue Million Forecast, by End Users 2019 & 2032
- Table 8: Global Tacrolimus Industry Volume K Unit Forecast, by End Users 2019 & 2032
- Table 9: Global Tacrolimus Industry Revenue Million Forecast, by Region 2019 & 2032
- Table 10: Global Tacrolimus Industry Volume K Unit Forecast, by Region 2019 & 2032
- Table 11: Global Tacrolimus Industry Revenue Million Forecast, by Country 2019 & 2032
- Table 12: Global Tacrolimus Industry Volume K Unit Forecast, by Country 2019 & 2032
- Table 13: Global Tacrolimus Industry Revenue Million Forecast, by Country 2019 & 2032
- Table 14: Global Tacrolimus Industry Volume K Unit Forecast, by Country 2019 & 2032
- Table 15: Global Tacrolimus Industry Revenue Million Forecast, by Country 2019 & 2032
- Table 16: Global Tacrolimus Industry Volume K Unit Forecast, by Country 2019 & 2032
- Table 17: Global Tacrolimus Industry Revenue Million Forecast, by Country 2019 & 2032
- Table 18: Global Tacrolimus Industry Volume K Unit Forecast, by Country 2019 & 2032
- Table 19: Global Tacrolimus Industry Revenue Million Forecast, by Country 2019 & 2032
- Table 20: Global Tacrolimus Industry Volume K Unit Forecast, by Country 2019 & 2032
- Table 21: Global Tacrolimus Industry Revenue Million Forecast, by Product Type 2019 & 2032
- Table 22: Global Tacrolimus Industry Volume K Unit Forecast, by Product Type 2019 & 2032
- Table 23: Global Tacrolimus Industry Revenue Million Forecast, by Application 2019 & 2032
- Table 24: Global Tacrolimus Industry Volume K Unit Forecast, by Application 2019 & 2032
- Table 25: Global Tacrolimus Industry Revenue Million Forecast, by End Users 2019 & 2032
- Table 26: Global Tacrolimus Industry Volume K Unit Forecast, by End Users 2019 & 2032
- Table 27: Global Tacrolimus Industry Revenue Million Forecast, by Country 2019 & 2032
- Table 28: Global Tacrolimus Industry Volume K Unit Forecast, by Country 2019 & 2032
- Table 29: United States Tacrolimus Industry Revenue (Million) Forecast, by Application 2019 & 2032
- Table 30: United States Tacrolimus Industry Volume (K Unit) Forecast, by Application 2019 & 2032
- Table 31: Canada Tacrolimus Industry Revenue (Million) Forecast, by Application 2019 & 2032
- Table 32: Canada Tacrolimus Industry Volume (K Unit) Forecast, by Application 2019 & 2032
- Table 33: Mexico Tacrolimus Industry Revenue (Million) Forecast, by Application 2019 & 2032
- Table 34: Mexico Tacrolimus Industry Volume (K Unit) Forecast, by Application 2019 & 2032
- Table 35: Global Tacrolimus Industry Revenue Million Forecast, by Product Type 2019 & 2032
- Table 36: Global Tacrolimus Industry Volume K Unit Forecast, by Product Type 2019 & 2032
- Table 37: Global Tacrolimus Industry Revenue Million Forecast, by Application 2019 & 2032
- Table 38: Global Tacrolimus Industry Volume K Unit Forecast, by Application 2019 & 2032
- Table 39: Global Tacrolimus Industry Revenue Million Forecast, by End Users 2019 & 2032
- Table 40: Global Tacrolimus Industry Volume K Unit Forecast, by End Users 2019 & 2032
- Table 41: Global Tacrolimus Industry Revenue Million Forecast, by Country 2019 & 2032
- Table 42: Global Tacrolimus Industry Volume K Unit Forecast, by Country 2019 & 2032
- Table 43: Germany Tacrolimus Industry Revenue (Million) Forecast, by Application 2019 & 2032
- Table 44: Germany Tacrolimus Industry Volume (K Unit) Forecast, by Application 2019 & 2032
- Table 45: United Kingdom Tacrolimus Industry Revenue (Million) Forecast, by Application 2019 & 2032
- Table 46: United Kingdom Tacrolimus Industry Volume (K Unit) Forecast, by Application 2019 & 2032
- Table 47: France Tacrolimus Industry Revenue (Million) Forecast, by Application 2019 & 2032
- Table 48: France Tacrolimus Industry Volume (K Unit) Forecast, by Application 2019 & 2032
- Table 49: Italy Tacrolimus Industry Revenue (Million) Forecast, by Application 2019 & 2032
- Table 50: Italy Tacrolimus Industry Volume (K Unit) Forecast, by Application 2019 & 2032
- Table 51: Spain Tacrolimus Industry Revenue (Million) Forecast, by Application 2019 & 2032
- Table 52: Spain Tacrolimus Industry Volume (K Unit) Forecast, by Application 2019 & 2032
- Table 53: Rest of Europe Tacrolimus Industry Revenue (Million) Forecast, by Application 2019 & 2032
- Table 54: Rest of Europe Tacrolimus Industry Volume (K Unit) Forecast, by Application 2019 & 2032
- Table 55: Global Tacrolimus Industry Revenue Million Forecast, by Product Type 2019 & 2032
- Table 56: Global Tacrolimus Industry Volume K Unit Forecast, by Product Type 2019 & 2032
- Table 57: Global Tacrolimus Industry Revenue Million Forecast, by Application 2019 & 2032
- Table 58: Global Tacrolimus Industry Volume K Unit Forecast, by Application 2019 & 2032
- Table 59: Global Tacrolimus Industry Revenue Million Forecast, by End Users 2019 & 2032
- Table 60: Global Tacrolimus Industry Volume K Unit Forecast, by End Users 2019 & 2032
- Table 61: Global Tacrolimus Industry Revenue Million Forecast, by Country 2019 & 2032
- Table 62: Global Tacrolimus Industry Volume K Unit Forecast, by Country 2019 & 2032
- Table 63: China Tacrolimus Industry Revenue (Million) Forecast, by Application 2019 & 2032
- Table 64: China Tacrolimus Industry Volume (K Unit) Forecast, by Application 2019 & 2032
- Table 65: Japan Tacrolimus Industry Revenue (Million) Forecast, by Application 2019 & 2032
- Table 66: Japan Tacrolimus Industry Volume (K Unit) Forecast, by Application 2019 & 2032
- Table 67: India Tacrolimus Industry Revenue (Million) Forecast, by Application 2019 & 2032
- Table 68: India Tacrolimus Industry Volume (K Unit) Forecast, by Application 2019 & 2032
- Table 69: Australia Tacrolimus Industry Revenue (Million) Forecast, by Application 2019 & 2032
- Table 70: Australia Tacrolimus Industry Volume (K Unit) Forecast, by Application 2019 & 2032
- Table 71: South Korea Tacrolimus Industry Revenue (Million) Forecast, by Application 2019 & 2032
- Table 72: South Korea Tacrolimus Industry Volume (K Unit) Forecast, by Application 2019 & 2032
- Table 73: Rest of Asia Pacific Tacrolimus Industry Revenue (Million) Forecast, by Application 2019 & 2032
- Table 74: Rest of Asia Pacific Tacrolimus Industry Volume (K Unit) Forecast, by Application 2019 & 2032
- Table 75: Global Tacrolimus Industry Revenue Million Forecast, by Product Type 2019 & 2032
- Table 76: Global Tacrolimus Industry Volume K Unit Forecast, by Product Type 2019 & 2032
- Table 77: Global Tacrolimus Industry Revenue Million Forecast, by Application 2019 & 2032
- Table 78: Global Tacrolimus Industry Volume K Unit Forecast, by Application 2019 & 2032
- Table 79: Global Tacrolimus Industry Revenue Million Forecast, by End Users 2019 & 2032
- Table 80: Global Tacrolimus Industry Volume K Unit Forecast, by End Users 2019 & 2032
- Table 81: Global Tacrolimus Industry Revenue Million Forecast, by Country 2019 & 2032
- Table 82: Global Tacrolimus Industry Volume K Unit Forecast, by Country 2019 & 2032
- Table 83: GCC Tacrolimus Industry Revenue (Million) Forecast, by Application 2019 & 2032
- Table 84: GCC Tacrolimus Industry Volume (K Unit) Forecast, by Application 2019 & 2032
- Table 85: South Africa Tacrolimus Industry Revenue (Million) Forecast, by Application 2019 & 2032
- Table 86: South Africa Tacrolimus Industry Volume (K Unit) Forecast, by Application 2019 & 2032
- Table 87: Rest of Middle East and Africa Tacrolimus Industry Revenue (Million) Forecast, by Application 2019 & 2032
- Table 88: Rest of Middle East and Africa Tacrolimus Industry Volume (K Unit) Forecast, by Application 2019 & 2032
- Table 89: Global Tacrolimus Industry Revenue Million Forecast, by Product Type 2019 & 2032
- Table 90: Global Tacrolimus Industry Volume K Unit Forecast, by Product Type 2019 & 2032
- Table 91: Global Tacrolimus Industry Revenue Million Forecast, by Application 2019 & 2032
- Table 92: Global Tacrolimus Industry Volume K Unit Forecast, by Application 2019 & 2032
- Table 93: Global Tacrolimus Industry Revenue Million Forecast, by End Users 2019 & 2032
- Table 94: Global Tacrolimus Industry Volume K Unit Forecast, by End Users 2019 & 2032
- Table 95: Global Tacrolimus Industry Revenue Million Forecast, by Country 2019 & 2032
- Table 96: Global Tacrolimus Industry Volume K Unit Forecast, by Country 2019 & 2032
- Table 97: Brazil Tacrolimus Industry Revenue (Million) Forecast, by Application 2019 & 2032
- Table 98: Brazil Tacrolimus Industry Volume (K Unit) Forecast, by Application 2019 & 2032
- Table 99: Argentina Tacrolimus Industry Revenue (Million) Forecast, by Application 2019 & 2032
- Table 100: Argentina Tacrolimus Industry Volume (K Unit) Forecast, by Application 2019 & 2032
- Table 101: Rest of South America Tacrolimus Industry Revenue (Million) Forecast, by Application 2019 & 2032
- Table 102: Rest of South America Tacrolimus Industry Volume (K Unit) Forecast, by Application 2019 & 2032
Frequently Asked Questions
1. What is the projected Compound Annual Growth Rate (CAGR) of the Tacrolimus Industry?
The projected CAGR is approximately 5.20%.
2. Which companies are prominent players in the Tacrolimus Industry?
Key companies in the market include Lupin Pharmaceuticals Inc, Glenmark Pharmaceuticals Inc, Panacea Biotec, Astellas Pharma Inc, LEO Pharma A/S, GlaxoSmithKline plc, Novartis AG, Biocon Ltd, Dr Reddy's Laboratories Ltd, Pfizer Inc.
3. What are the main segments of the Tacrolimus Industry?
The market segments include Product Type, Application, End Users.
4. Can you provide details about the market size?
The market size is estimated to be USD XX Million as of 2022.
5. What are some drivers contributing to market growth?
Increasing Number of Transplants Worldwide; Surge in Research and Development Activities for Immunosuppression.
6. What are the notable trends driving market growth?
Immunosuppression Segment is Expected to Witness Growth over the Forecast Period.
7. Are there any restraints impacting market growth?
Side Effects of the Tacrolimus.
8. Can you provide examples of recent developments in the market?
N/A
9. What pricing options are available for accessing the report?
Pricing options include single-user, multi-user, and enterprise licenses priced at USD 4750, USD 5250, and USD 8750 respectively.
10. Is the market size provided in terms of value or volume?
The market size is provided in terms of value, measured in Million and volume, measured in K Unit.
11. Are there any specific market keywords associated with the report?
Yes, the market keyword associated with the report is "Tacrolimus Industry," which aids in identifying and referencing the specific market segment covered.
12. How do I determine which pricing option suits my needs best?
The pricing options vary based on user requirements and access needs. Individual users may opt for single-user licenses, while businesses requiring broader access may choose multi-user or enterprise licenses for cost-effective access to the report.
13. Are there any additional resources or data provided in the Tacrolimus Industry report?
While the report offers comprehensive insights, it's advisable to review the specific contents or supplementary materials provided to ascertain if additional resources or data are available.
14. How can I stay updated on further developments or reports in the Tacrolimus Industry?
To stay informed about further developments, trends, and reports in the Tacrolimus Industry, consider subscribing to industry newsletters, following relevant companies and organizations, or regularly checking reputable industry news sources and publications.
Methodology
Step 1 - Identification of Relevant Samples Size from Population Database


Step 2 - Approaches for Defining Global Market Size (Value, Volume* & Price*)

Note*: In applicable scenarios
Step 3 - Data Sources
Primary Research
- Web Analytics
- Survey Reports
- Research Institute
- Latest Research Reports
- Opinion Leaders
Secondary Research
- Annual Reports
- White Paper
- Latest Press Release
- Industry Association
- Paid Database
- Investor Presentations

Step 4 - Data Triangulation
Involves using different sources of information in order to increase the validity of a study
These sources are likely to be stakeholders in a program - participants, other researchers, program staff, other community members, and so on.
Then we put all data in single framework & apply various statistical tools to find out the dynamic on the market.
During the analysis stage, feedback from the stakeholder groups would be compared to determine areas of agreement as well as areas of divergence


