
Key Insights
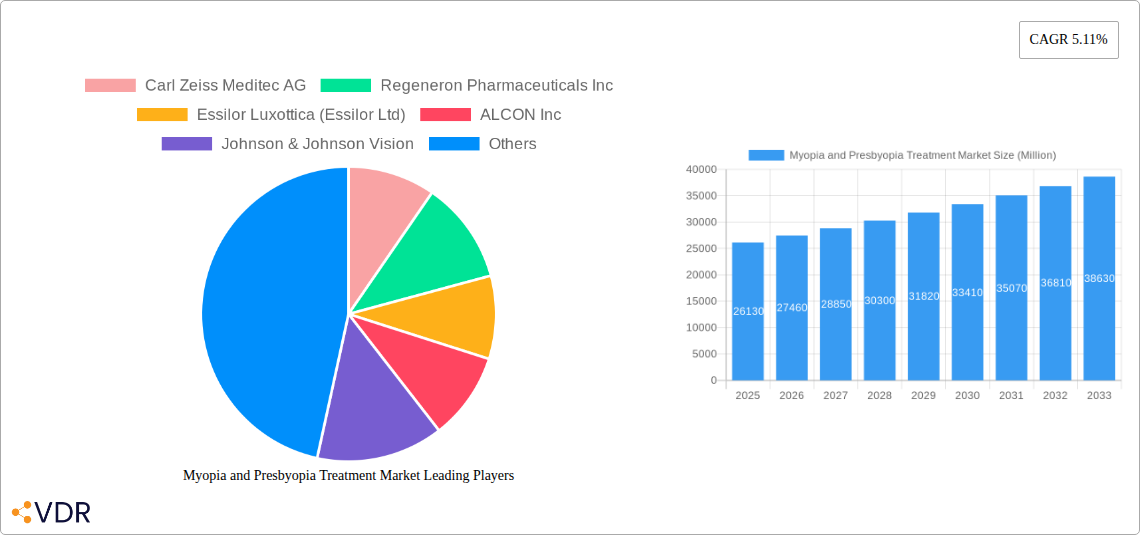
The global myopia and presbyopia treatment market, valued at $26.13 billion in 2025, is projected to experience robust growth, driven by several key factors. The rising prevalence of myopia and presbyopia, particularly in aging populations across developed and rapidly developing nations, is a major catalyst. Technological advancements in refractive surgery (LASIK, SMILE), intraocular lenses (IOLs), and contact lens technology are continuously improving treatment options, increasing market penetration. Furthermore, a growing awareness of vision correction solutions among consumers, fueled by effective marketing and improved accessibility, contributes significantly to market expansion. The increasing adoption of minimally invasive surgical procedures and the development of innovative drug therapies for myopia management further bolster this growth trajectory. Competition among established players like EssilorLuxottica, Johnson & Johnson Vision, and Alcon, alongside emerging companies developing novel treatments, ensures innovation and fosters market dynamism. While rising healthcare costs and potential side effects associated with certain treatments represent challenges, the overall market outlook remains optimistic due to the projected increase in the number of individuals requiring vision correction.
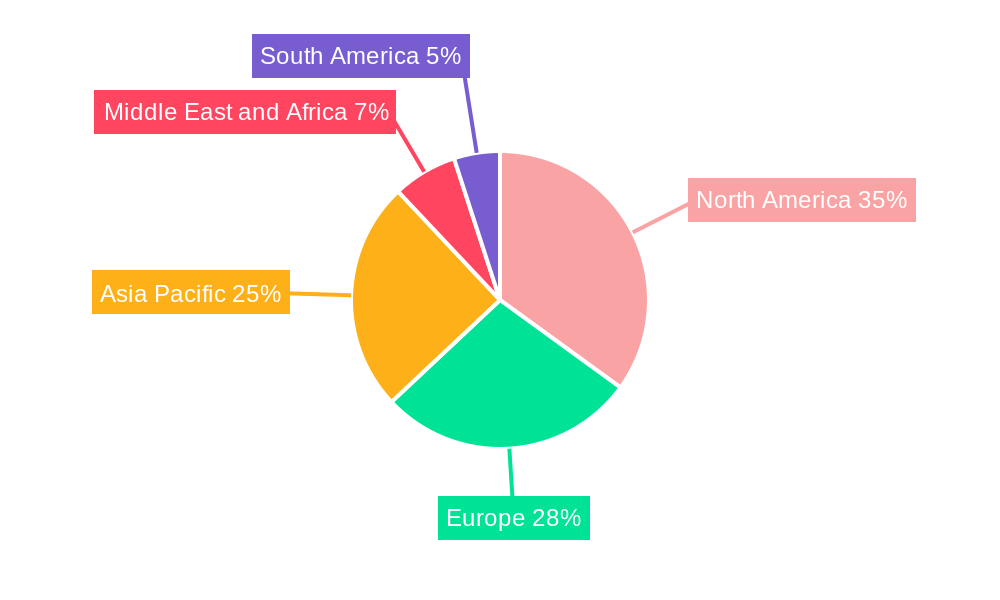
The market is segmented by disease type (myopia and presbyopia) and treatment type (prescription lenses, contact lenses, surgery, and medication). Prescription lenses currently dominate the market, reflecting the widespread adoption of spectacles. However, contact lenses and refractive surgeries are experiencing significant growth owing to their convenience and efficacy. The medication segment is poised for expansion with the development of myopia control medications and drops. Geographical analysis reveals strong market presence in North America and Europe, driven by high healthcare expenditure and established healthcare infrastructure. However, the Asia-Pacific region is expected to demonstrate the fastest growth rate in the forecast period (2025-2033), fueled by a large and rapidly aging population base with increasing disposable income and access to better healthcare services. This suggests a substantial untapped market potential in these regions, presenting attractive opportunities for market expansion and investment.
Myopia and Presbyopia Treatment Market: A Comprehensive Report (2019-2033)
This in-depth report provides a comprehensive analysis of the Myopia and Presbyopia Treatment Market, encompassing market dynamics, growth trends, regional performance, product landscape, and key players. With a detailed forecast from 2025 to 2033 (base year 2025), this report is an invaluable resource for industry professionals, investors, and researchers seeking to understand and capitalize on opportunities within this rapidly evolving market. The total market size in 2025 is estimated at xx Million units.
Myopia and Presbyopia Treatment Market Market Dynamics & Structure
This section analyzes the competitive landscape, technological advancements, and regulatory influences shaping the Myopia and Presbyopia Treatment Market. The market is moderately concentrated, with key players like Carl Zeiss Meditec AG, Regeneron Pharmaceuticals Inc, Essilor Luxottica (Essilor Ltd), ALCON Inc, and Johnson & Johnson Vision holding significant market share. The parent market encompasses vision correction, while this report focuses on the child market of myopia and presbyopia treatments.
Market Structure Highlights:
- Market Concentration: Moderately concentrated, with top 5 players holding approximately xx% market share in 2025.
- Technological Innovation: Driven by advancements in laser refractive surgery, contact lens technology (including multifocal and scleral lenses), and pharmaceutical treatments.
- Regulatory Frameworks: Vary across geographies, impacting product approvals and market access. Stringent regulations in developed markets drive innovation and safety standards.
- Competitive Product Substitutes: Include alternative vision correction methods (e.g., LASIK, PRK), posing a competitive threat to certain treatment types.
- End-User Demographics: Aging populations drive growth in the presbyopia treatment segment, while increasing myopia prevalence among children fuels demand for myopia management solutions.
- M&A Trends: A moderate level of mergers and acquisitions activity is observed, with xx deals recorded between 2019 and 2024, indicating consolidation and expansion strategies among key players.
Myopia and Presbyopia Treatment Market Growth Trends & Insights
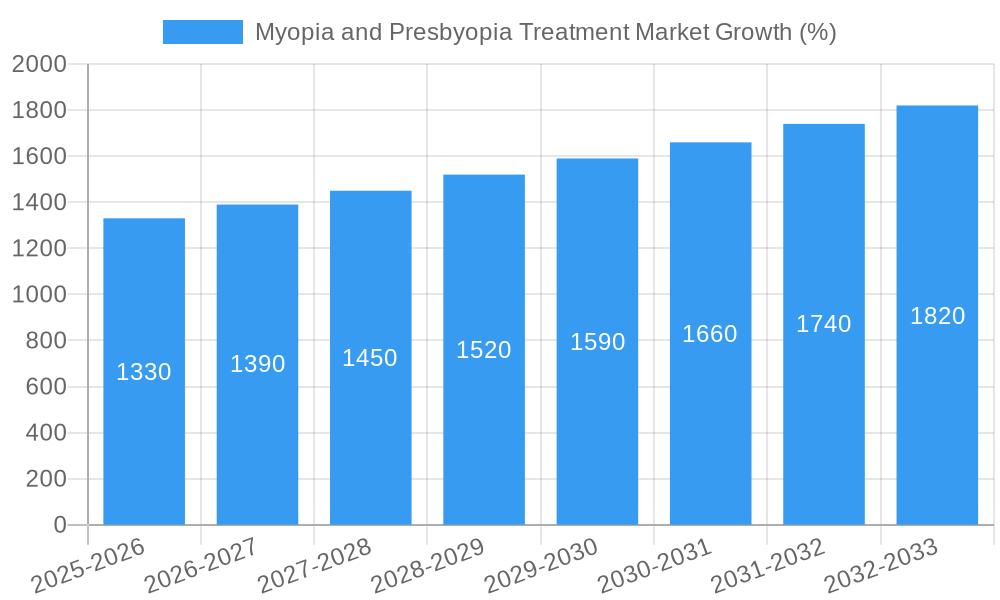
The Myopia and Presbyopia Treatment Market is experiencing robust growth, driven by several factors. The market size is projected to reach xx Million units by 2033, exhibiting a CAGR of xx% during the forecast period (2025-2033). This growth is fueled by rising prevalence of myopia and presbyopia, increasing disposable incomes, rising awareness about vision correction, and technological advancements in treatment options. The adoption rate of advanced technologies like implantable collamer lenses and pharmacological treatments is gradually increasing. Consumer behavior shifts towards more convenient and less invasive treatments are also playing a key role.
Dominant Regions, Countries, or Segments in Myopia and Presbyopia Treatment Market
North America and Europe currently dominate the Myopia and Presbyopia Treatment Market, primarily due to high healthcare expenditure, advanced healthcare infrastructure, and high prevalence of age-related vision conditions. Within disease types, presbyopia shows higher market share due to the aging population. However, the myopia segment demonstrates higher growth potential, driven by rising myopia rates, especially in Asia.
Key Drivers by Segment:
- Presbyopia: Aging populations in North America and Europe are the primary driver, coupled with increased awareness and adoption of multifocal contact lenses and refractive surgeries.
- Myopia: Rapidly increasing myopia prevalence in Asia, particularly among children, drives this segment's growth. Increased awareness of myopia management techniques also contributes.
- Prescription Lenses: Remains a significant segment due to its affordability and accessibility.
- Contact Lenses: Growing preference for convenience and cosmetic appeal drives this segment's growth. Technological advancements in multifocal and daily disposable lenses fuel its expansion.
- Surgery: Technological advancements in LASIK and other refractive surgeries enhance efficacy and safety, driving market growth.
- Medication: The recent FDA approval of Vuity for presbyopia treatment marks a significant development, opening up opportunities in this segment.
Myopia and Presbyopia Treatment Market Product Landscape
The market offers a diverse range of products, including prescription lenses (single vision, progressive, bifocal), contact lenses (soft, rigid, multifocal), surgical procedures (LASIK, PRK, implantable collamer lenses), and medications (e.g., Vuity). Product innovation focuses on improved comfort, efficacy, and convenience. Technological advancements include the development of customized lenses, biocompatible materials, and minimally invasive surgical techniques. Unique selling propositions include improved visual acuity, extended wear durations, reduced side effects, and personalized treatment options.
Key Drivers, Barriers & Challenges in Myopia and Presbyopia Treatment Market
Key Drivers:
- Rising prevalence of myopia and presbyopia globally.
- Technological advancements in treatment options.
- Increasing healthcare expenditure and access to quality healthcare.
- Growing awareness among consumers about vision correction.
Key Challenges and Restraints:
- High cost of advanced treatment options, limiting accessibility in certain regions.
- Stringent regulatory approvals for new products and technologies.
- Competition from established players and emerging companies.
- Potential side effects associated with certain treatments.
- Supply chain disruptions impacting the availability of certain products and materials.
Emerging Opportunities in Myopia and Presbyopia Treatment Market
- Untapped markets in developing countries with rising middle classes.
- Development of personalized treatment approaches using AI and big data analytics.
- Growing demand for myopia management solutions among children.
- Increased focus on minimally invasive and less-invasive treatments.
- Potential for novel drug therapies and gene editing technologies for myopia and presbyopia.
Growth Accelerators in the Myopia and Presbyopia Treatment Market Industry
Long-term growth will be fueled by continuous innovation in treatment options, strategic partnerships between pharmaceutical and medical device companies, expansion into underserved markets, and increasing public health initiatives focused on myopia prevention and management. The integration of digital technologies and telemedicine will also contribute to market growth.
Key Players Shaping the Myopia and Presbyopia Treatment Market Market
- Carl Zeiss Meditec AG
- Regeneron Pharmaceuticals Inc
- Essilor Luxottica (Essilor Ltd)
- ALCON Inc
- Johnson & Johnson Vision
- Zeimer Ophthalmic Systems AG
- Orasis Pharmaceuticals
- AbbVie
- The Cooper Companies Inc
- Topcon Corporation
- NIDEK CO LTD
- Bausch Health Companies Inc
- Sydnexis
Notable Milestones in Myopia and Presbyopia Treatment Market Sector
- October 2021: Allergan (AbbVie) receives FDA approval for Vuity (pilocarpine) for presbyopia treatment. This significantly expanded treatment options for presbyopia.
- May 2021: Johnson & Johnson Vision receives FDA approval for ACUVUE Abiliti Overnight Therapeutic Lenses for myopia management. This marks a significant advancement in myopia control.
In-Depth Myopia and Presbyopia Treatment Market Market Outlook
The Myopia and Presbyopia Treatment Market is poised for sustained growth, driven by technological innovation, expanding market access, and a growing awareness of vision health. Strategic partnerships and collaborations will play a crucial role in accelerating innovation and market penetration. The focus on personalized medicine, minimally invasive procedures, and proactive myopia management will shape the future of the market. Significant growth is projected in emerging markets, where the prevalence of vision conditions is increasing rapidly.
Myopia and Presbyopia Treatment Market Segmentation
-
1. Disease Type
- 1.1. Myopia
- 1.2. Presbyopia
-
2. Treatment Type
- 2.1. Prescription Lenses
- 2.2. Contact Lenses
- 2.3. Surgery
- 2.4. Medication
Myopia and Presbyopia Treatment Market Segmentation By Geography
-
1. North America
- 1.1. United States
- 1.2. Canada
- 1.3. Mexico
-
2. Europe
- 2.1. Germany
- 2.2. United Kingdom
- 2.3. France
- 2.4. Italy
- 2.5. Spain
- 2.6. Rest of Europe
-
3. Asia Pacific
- 3.1. China
- 3.2. Japan
- 3.3. India
- 3.4. Australia
- 3.5. South Korea
- 3.6. Rest of Asia Pacific
-
4. Middle East and Africa
- 4.1. GCC
- 4.2. South Africa
- 4.3. Rest of Middle East and Africa
-
5. South America
- 5.1. Brazil
- 5.2. Argentina
- 5.3. Rest of South America
Myopia and Presbyopia Treatment Market REPORT HIGHLIGHTS
| Aspects | Details |
|---|---|
| Study Period | 2019-2033 |
| Base Year | 2024 |
| Estimated Year | 2025 |
| Forecast Period | 2025-2033 |
| Historical Period | 2019-2024 |
| Growth Rate | CAGR of 5.11% from 2019-2033 |
| Segmentation |
|
Table of Contents
- 1. Introduction
- 1.1. Research Scope
- 1.2. Market Segmentation
- 1.3. Research Methodology
- 1.4. Definitions and Assumptions
- 2. Executive Summary
- 2.1. Introduction
- 3. Market Dynamics
- 3.1. Introduction
- 3.2. Market Drivers
- 3.2.1. Increasing Cases of Vision Impairment; Rising Geriatric Population
- 3.3. Market Restrains
- 3.3.1. Lack of Early Diagnosis; High Cost of Treatment
- 3.4. Market Trends
- 3.4.1. Myopia is Expected to Hold Significant Market Share in the Disease Type Segment
- 4. Market Factor Analysis
- 4.1. Porters Five Forces
- 4.2. Supply/Value Chain
- 4.3. PESTEL analysis
- 4.4. Market Entropy
- 4.5. Patent/Trademark Analysis
- 5. Global Myopia and Presbyopia Treatment Market Analysis, Insights and Forecast, 2019-2031
- 5.1. Market Analysis, Insights and Forecast - by Disease Type
- 5.1.1. Myopia
- 5.1.2. Presbyopia
- 5.2. Market Analysis, Insights and Forecast - by Treatment Type
- 5.2.1. Prescription Lenses
- 5.2.2. Contact Lenses
- 5.2.3. Surgery
- 5.2.4. Medication
- 5.3. Market Analysis, Insights and Forecast - by Region
- 5.3.1. North America
- 5.3.2. Europe
- 5.3.3. Asia Pacific
- 5.3.4. Middle East and Africa
- 5.3.5. South America
- 5.1. Market Analysis, Insights and Forecast - by Disease Type
- 6. North America Myopia and Presbyopia Treatment Market Analysis, Insights and Forecast, 2019-2031
- 6.1. Market Analysis, Insights and Forecast - by Disease Type
- 6.1.1. Myopia
- 6.1.2. Presbyopia
- 6.2. Market Analysis, Insights and Forecast - by Treatment Type
- 6.2.1. Prescription Lenses
- 6.2.2. Contact Lenses
- 6.2.3. Surgery
- 6.2.4. Medication
- 6.1. Market Analysis, Insights and Forecast - by Disease Type
- 7. Europe Myopia and Presbyopia Treatment Market Analysis, Insights and Forecast, 2019-2031
- 7.1. Market Analysis, Insights and Forecast - by Disease Type
- 7.1.1. Myopia
- 7.1.2. Presbyopia
- 7.2. Market Analysis, Insights and Forecast - by Treatment Type
- 7.2.1. Prescription Lenses
- 7.2.2. Contact Lenses
- 7.2.3. Surgery
- 7.2.4. Medication
- 7.1. Market Analysis, Insights and Forecast - by Disease Type
- 8. Asia Pacific Myopia and Presbyopia Treatment Market Analysis, Insights and Forecast, 2019-2031
- 8.1. Market Analysis, Insights and Forecast - by Disease Type
- 8.1.1. Myopia
- 8.1.2. Presbyopia
- 8.2. Market Analysis, Insights and Forecast - by Treatment Type
- 8.2.1. Prescription Lenses
- 8.2.2. Contact Lenses
- 8.2.3. Surgery
- 8.2.4. Medication
- 8.1. Market Analysis, Insights and Forecast - by Disease Type
- 9. Middle East and Africa Myopia and Presbyopia Treatment Market Analysis, Insights and Forecast, 2019-2031
- 9.1. Market Analysis, Insights and Forecast - by Disease Type
- 9.1.1. Myopia
- 9.1.2. Presbyopia
- 9.2. Market Analysis, Insights and Forecast - by Treatment Type
- 9.2.1. Prescription Lenses
- 9.2.2. Contact Lenses
- 9.2.3. Surgery
- 9.2.4. Medication
- 9.1. Market Analysis, Insights and Forecast - by Disease Type
- 10. South America Myopia and Presbyopia Treatment Market Analysis, Insights and Forecast, 2019-2031
- 10.1. Market Analysis, Insights and Forecast - by Disease Type
- 10.1.1. Myopia
- 10.1.2. Presbyopia
- 10.2. Market Analysis, Insights and Forecast - by Treatment Type
- 10.2.1. Prescription Lenses
- 10.2.2. Contact Lenses
- 10.2.3. Surgery
- 10.2.4. Medication
- 10.1. Market Analysis, Insights and Forecast - by Disease Type
- 11. North America Myopia and Presbyopia Treatment Market Analysis, Insights and Forecast, 2019-2031
- 11.1. Market Analysis, Insights and Forecast - By Country/Sub-region
- 11.1.1 United States
- 11.1.2 Canada
- 11.1.3 Mexico
- 12. Europe Myopia and Presbyopia Treatment Market Analysis, Insights and Forecast, 2019-2031
- 12.1. Market Analysis, Insights and Forecast - By Country/Sub-region
- 12.1.1 Germany
- 12.1.2 United Kingdom
- 12.1.3 France
- 12.1.4 Italy
- 12.1.5 Spain
- 12.1.6 Rest of Europe
- 13. Asia Pacific Myopia and Presbyopia Treatment Market Analysis, Insights and Forecast, 2019-2031
- 13.1. Market Analysis, Insights and Forecast - By Country/Sub-region
- 13.1.1 China
- 13.1.2 Japan
- 13.1.3 India
- 13.1.4 Australia
- 13.1.5 South Korea
- 13.1.6 Rest of Asia Pacific
- 14. Middle East and Africa Myopia and Presbyopia Treatment Market Analysis, Insights and Forecast, 2019-2031
- 14.1. Market Analysis, Insights and Forecast - By Country/Sub-region
- 14.1.1 GCC
- 14.1.2 South Africa
- 14.1.3 Rest of Middle East and Africa
- 15. South America Myopia and Presbyopia Treatment Market Analysis, Insights and Forecast, 2019-2031
- 15.1. Market Analysis, Insights and Forecast - By Country/Sub-region
- 15.1.1 Brazil
- 15.1.2 Argentina
- 15.1.3 Rest of South America
- 16. Competitive Analysis
- 16.1. Global Market Share Analysis 2024
- 16.2. Company Profiles
- 16.2.1 Carl Zeiss Meditec AG
- 16.2.1.1. Overview
- 16.2.1.2. Products
- 16.2.1.3. SWOT Analysis
- 16.2.1.4. Recent Developments
- 16.2.1.5. Financials (Based on Availability)
- 16.2.2 Regeneron Pharmaceuticals Inc
- 16.2.2.1. Overview
- 16.2.2.2. Products
- 16.2.2.3. SWOT Analysis
- 16.2.2.4. Recent Developments
- 16.2.2.5. Financials (Based on Availability)
- 16.2.3 Essilor Luxottica (Essilor Ltd)
- 16.2.3.1. Overview
- 16.2.3.2. Products
- 16.2.3.3. SWOT Analysis
- 16.2.3.4. Recent Developments
- 16.2.3.5. Financials (Based on Availability)
- 16.2.4 ALCON Inc
- 16.2.4.1. Overview
- 16.2.4.2. Products
- 16.2.4.3. SWOT Analysis
- 16.2.4.4. Recent Developments
- 16.2.4.5. Financials (Based on Availability)
- 16.2.5 Johnson & Johnson Vision
- 16.2.5.1. Overview
- 16.2.5.2. Products
- 16.2.5.3. SWOT Analysis
- 16.2.5.4. Recent Developments
- 16.2.5.5. Financials (Based on Availability)
- 16.2.6 Zeimer Ophthalmic Systems AG
- 16.2.6.1. Overview
- 16.2.6.2. Products
- 16.2.6.3. SWOT Analysis
- 16.2.6.4. Recent Developments
- 16.2.6.5. Financials (Based on Availability)
- 16.2.7 Orasis Pharmaceuticals
- 16.2.7.1. Overview
- 16.2.7.2. Products
- 16.2.7.3. SWOT Analysis
- 16.2.7.4. Recent Developments
- 16.2.7.5. Financials (Based on Availability)
- 16.2.8 AbbVie
- 16.2.8.1. Overview
- 16.2.8.2. Products
- 16.2.8.3. SWOT Analysis
- 16.2.8.4. Recent Developments
- 16.2.8.5. Financials (Based on Availability)
- 16.2.9 The Cooper Companies Inc
- 16.2.9.1. Overview
- 16.2.9.2. Products
- 16.2.9.3. SWOT Analysis
- 16.2.9.4. Recent Developments
- 16.2.9.5. Financials (Based on Availability)
- 16.2.10 Topcon Corporation
- 16.2.10.1. Overview
- 16.2.10.2. Products
- 16.2.10.3. SWOT Analysis
- 16.2.10.4. Recent Developments
- 16.2.10.5. Financials (Based on Availability)
- 16.2.11 NIDEK CO LTD
- 16.2.11.1. Overview
- 16.2.11.2. Products
- 16.2.11.3. SWOT Analysis
- 16.2.11.4. Recent Developments
- 16.2.11.5. Financials (Based on Availability)
- 16.2.12 Bausch Health Companies Inc
- 16.2.12.1. Overview
- 16.2.12.2. Products
- 16.2.12.3. SWOT Analysis
- 16.2.12.4. Recent Developments
- 16.2.12.5. Financials (Based on Availability)
- 16.2.13 Sydnexis
- 16.2.13.1. Overview
- 16.2.13.2. Products
- 16.2.13.3. SWOT Analysis
- 16.2.13.4. Recent Developments
- 16.2.13.5. Financials (Based on Availability)
- 16.2.1 Carl Zeiss Meditec AG
List of Figures
- Figure 1: Global Myopia and Presbyopia Treatment Market Revenue Breakdown (Million, %) by Region 2024 & 2032
- Figure 2: Global Myopia and Presbyopia Treatment Market Volume Breakdown (K Unit, %) by Region 2024 & 2032
- Figure 3: North America Myopia and Presbyopia Treatment Market Revenue (Million), by Country 2024 & 2032
- Figure 4: North America Myopia and Presbyopia Treatment Market Volume (K Unit), by Country 2024 & 2032
- Figure 5: North America Myopia and Presbyopia Treatment Market Revenue Share (%), by Country 2024 & 2032
- Figure 6: North America Myopia and Presbyopia Treatment Market Volume Share (%), by Country 2024 & 2032
- Figure 7: Europe Myopia and Presbyopia Treatment Market Revenue (Million), by Country 2024 & 2032
- Figure 8: Europe Myopia and Presbyopia Treatment Market Volume (K Unit), by Country 2024 & 2032
- Figure 9: Europe Myopia and Presbyopia Treatment Market Revenue Share (%), by Country 2024 & 2032
- Figure 10: Europe Myopia and Presbyopia Treatment Market Volume Share (%), by Country 2024 & 2032
- Figure 11: Asia Pacific Myopia and Presbyopia Treatment Market Revenue (Million), by Country 2024 & 2032
- Figure 12: Asia Pacific Myopia and Presbyopia Treatment Market Volume (K Unit), by Country 2024 & 2032
- Figure 13: Asia Pacific Myopia and Presbyopia Treatment Market Revenue Share (%), by Country 2024 & 2032
- Figure 14: Asia Pacific Myopia and Presbyopia Treatment Market Volume Share (%), by Country 2024 & 2032
- Figure 15: Middle East and Africa Myopia and Presbyopia Treatment Market Revenue (Million), by Country 2024 & 2032
- Figure 16: Middle East and Africa Myopia and Presbyopia Treatment Market Volume (K Unit), by Country 2024 & 2032
- Figure 17: Middle East and Africa Myopia and Presbyopia Treatment Market Revenue Share (%), by Country 2024 & 2032
- Figure 18: Middle East and Africa Myopia and Presbyopia Treatment Market Volume Share (%), by Country 2024 & 2032
- Figure 19: South America Myopia and Presbyopia Treatment Market Revenue (Million), by Country 2024 & 2032
- Figure 20: South America Myopia and Presbyopia Treatment Market Volume (K Unit), by Country 2024 & 2032
- Figure 21: South America Myopia and Presbyopia Treatment Market Revenue Share (%), by Country 2024 & 2032
- Figure 22: South America Myopia and Presbyopia Treatment Market Volume Share (%), by Country 2024 & 2032
- Figure 23: North America Myopia and Presbyopia Treatment Market Revenue (Million), by Disease Type 2024 & 2032
- Figure 24: North America Myopia and Presbyopia Treatment Market Volume (K Unit), by Disease Type 2024 & 2032
- Figure 25: North America Myopia and Presbyopia Treatment Market Revenue Share (%), by Disease Type 2024 & 2032
- Figure 26: North America Myopia and Presbyopia Treatment Market Volume Share (%), by Disease Type 2024 & 2032
- Figure 27: North America Myopia and Presbyopia Treatment Market Revenue (Million), by Treatment Type 2024 & 2032
- Figure 28: North America Myopia and Presbyopia Treatment Market Volume (K Unit), by Treatment Type 2024 & 2032
- Figure 29: North America Myopia and Presbyopia Treatment Market Revenue Share (%), by Treatment Type 2024 & 2032
- Figure 30: North America Myopia and Presbyopia Treatment Market Volume Share (%), by Treatment Type 2024 & 2032
- Figure 31: North America Myopia and Presbyopia Treatment Market Revenue (Million), by Country 2024 & 2032
- Figure 32: North America Myopia and Presbyopia Treatment Market Volume (K Unit), by Country 2024 & 2032
- Figure 33: North America Myopia and Presbyopia Treatment Market Revenue Share (%), by Country 2024 & 2032
- Figure 34: North America Myopia and Presbyopia Treatment Market Volume Share (%), by Country 2024 & 2032
- Figure 35: Europe Myopia and Presbyopia Treatment Market Revenue (Million), by Disease Type 2024 & 2032
- Figure 36: Europe Myopia and Presbyopia Treatment Market Volume (K Unit), by Disease Type 2024 & 2032
- Figure 37: Europe Myopia and Presbyopia Treatment Market Revenue Share (%), by Disease Type 2024 & 2032
- Figure 38: Europe Myopia and Presbyopia Treatment Market Volume Share (%), by Disease Type 2024 & 2032
- Figure 39: Europe Myopia and Presbyopia Treatment Market Revenue (Million), by Treatment Type 2024 & 2032
- Figure 40: Europe Myopia and Presbyopia Treatment Market Volume (K Unit), by Treatment Type 2024 & 2032
- Figure 41: Europe Myopia and Presbyopia Treatment Market Revenue Share (%), by Treatment Type 2024 & 2032
- Figure 42: Europe Myopia and Presbyopia Treatment Market Volume Share (%), by Treatment Type 2024 & 2032
- Figure 43: Europe Myopia and Presbyopia Treatment Market Revenue (Million), by Country 2024 & 2032
- Figure 44: Europe Myopia and Presbyopia Treatment Market Volume (K Unit), by Country 2024 & 2032
- Figure 45: Europe Myopia and Presbyopia Treatment Market Revenue Share (%), by Country 2024 & 2032
- Figure 46: Europe Myopia and Presbyopia Treatment Market Volume Share (%), by Country 2024 & 2032
- Figure 47: Asia Pacific Myopia and Presbyopia Treatment Market Revenue (Million), by Disease Type 2024 & 2032
- Figure 48: Asia Pacific Myopia and Presbyopia Treatment Market Volume (K Unit), by Disease Type 2024 & 2032
- Figure 49: Asia Pacific Myopia and Presbyopia Treatment Market Revenue Share (%), by Disease Type 2024 & 2032
- Figure 50: Asia Pacific Myopia and Presbyopia Treatment Market Volume Share (%), by Disease Type 2024 & 2032
- Figure 51: Asia Pacific Myopia and Presbyopia Treatment Market Revenue (Million), by Treatment Type 2024 & 2032
- Figure 52: Asia Pacific Myopia and Presbyopia Treatment Market Volume (K Unit), by Treatment Type 2024 & 2032
- Figure 53: Asia Pacific Myopia and Presbyopia Treatment Market Revenue Share (%), by Treatment Type 2024 & 2032
- Figure 54: Asia Pacific Myopia and Presbyopia Treatment Market Volume Share (%), by Treatment Type 2024 & 2032
- Figure 55: Asia Pacific Myopia and Presbyopia Treatment Market Revenue (Million), by Country 2024 & 2032
- Figure 56: Asia Pacific Myopia and Presbyopia Treatment Market Volume (K Unit), by Country 2024 & 2032
- Figure 57: Asia Pacific Myopia and Presbyopia Treatment Market Revenue Share (%), by Country 2024 & 2032
- Figure 58: Asia Pacific Myopia and Presbyopia Treatment Market Volume Share (%), by Country 2024 & 2032
- Figure 59: Middle East and Africa Myopia and Presbyopia Treatment Market Revenue (Million), by Disease Type 2024 & 2032
- Figure 60: Middle East and Africa Myopia and Presbyopia Treatment Market Volume (K Unit), by Disease Type 2024 & 2032
- Figure 61: Middle East and Africa Myopia and Presbyopia Treatment Market Revenue Share (%), by Disease Type 2024 & 2032
- Figure 62: Middle East and Africa Myopia and Presbyopia Treatment Market Volume Share (%), by Disease Type 2024 & 2032
- Figure 63: Middle East and Africa Myopia and Presbyopia Treatment Market Revenue (Million), by Treatment Type 2024 & 2032
- Figure 64: Middle East and Africa Myopia and Presbyopia Treatment Market Volume (K Unit), by Treatment Type 2024 & 2032
- Figure 65: Middle East and Africa Myopia and Presbyopia Treatment Market Revenue Share (%), by Treatment Type 2024 & 2032
- Figure 66: Middle East and Africa Myopia and Presbyopia Treatment Market Volume Share (%), by Treatment Type 2024 & 2032
- Figure 67: Middle East and Africa Myopia and Presbyopia Treatment Market Revenue (Million), by Country 2024 & 2032
- Figure 68: Middle East and Africa Myopia and Presbyopia Treatment Market Volume (K Unit), by Country 2024 & 2032
- Figure 69: Middle East and Africa Myopia and Presbyopia Treatment Market Revenue Share (%), by Country 2024 & 2032
- Figure 70: Middle East and Africa Myopia and Presbyopia Treatment Market Volume Share (%), by Country 2024 & 2032
- Figure 71: South America Myopia and Presbyopia Treatment Market Revenue (Million), by Disease Type 2024 & 2032
- Figure 72: South America Myopia and Presbyopia Treatment Market Volume (K Unit), by Disease Type 2024 & 2032
- Figure 73: South America Myopia and Presbyopia Treatment Market Revenue Share (%), by Disease Type 2024 & 2032
- Figure 74: South America Myopia and Presbyopia Treatment Market Volume Share (%), by Disease Type 2024 & 2032
- Figure 75: South America Myopia and Presbyopia Treatment Market Revenue (Million), by Treatment Type 2024 & 2032
- Figure 76: South America Myopia and Presbyopia Treatment Market Volume (K Unit), by Treatment Type 2024 & 2032
- Figure 77: South America Myopia and Presbyopia Treatment Market Revenue Share (%), by Treatment Type 2024 & 2032
- Figure 78: South America Myopia and Presbyopia Treatment Market Volume Share (%), by Treatment Type 2024 & 2032
- Figure 79: South America Myopia and Presbyopia Treatment Market Revenue (Million), by Country 2024 & 2032
- Figure 80: South America Myopia and Presbyopia Treatment Market Volume (K Unit), by Country 2024 & 2032
- Figure 81: South America Myopia and Presbyopia Treatment Market Revenue Share (%), by Country 2024 & 2032
- Figure 82: South America Myopia and Presbyopia Treatment Market Volume Share (%), by Country 2024 & 2032
List of Tables
- Table 1: Global Myopia and Presbyopia Treatment Market Revenue Million Forecast, by Region 2019 & 2032
- Table 2: Global Myopia and Presbyopia Treatment Market Volume K Unit Forecast, by Region 2019 & 2032
- Table 3: Global Myopia and Presbyopia Treatment Market Revenue Million Forecast, by Disease Type 2019 & 2032
- Table 4: Global Myopia and Presbyopia Treatment Market Volume K Unit Forecast, by Disease Type 2019 & 2032
- Table 5: Global Myopia and Presbyopia Treatment Market Revenue Million Forecast, by Treatment Type 2019 & 2032
- Table 6: Global Myopia and Presbyopia Treatment Market Volume K Unit Forecast, by Treatment Type 2019 & 2032
- Table 7: Global Myopia and Presbyopia Treatment Market Revenue Million Forecast, by Region 2019 & 2032
- Table 8: Global Myopia and Presbyopia Treatment Market Volume K Unit Forecast, by Region 2019 & 2032
- Table 9: Global Myopia and Presbyopia Treatment Market Revenue Million Forecast, by Country 2019 & 2032
- Table 10: Global Myopia and Presbyopia Treatment Market Volume K Unit Forecast, by Country 2019 & 2032
- Table 11: United States Myopia and Presbyopia Treatment Market Revenue (Million) Forecast, by Application 2019 & 2032
- Table 12: United States Myopia and Presbyopia Treatment Market Volume (K Unit) Forecast, by Application 2019 & 2032
- Table 13: Canada Myopia and Presbyopia Treatment Market Revenue (Million) Forecast, by Application 2019 & 2032
- Table 14: Canada Myopia and Presbyopia Treatment Market Volume (K Unit) Forecast, by Application 2019 & 2032
- Table 15: Mexico Myopia and Presbyopia Treatment Market Revenue (Million) Forecast, by Application 2019 & 2032
- Table 16: Mexico Myopia and Presbyopia Treatment Market Volume (K Unit) Forecast, by Application 2019 & 2032
- Table 17: Global Myopia and Presbyopia Treatment Market Revenue Million Forecast, by Country 2019 & 2032
- Table 18: Global Myopia and Presbyopia Treatment Market Volume K Unit Forecast, by Country 2019 & 2032
- Table 19: Germany Myopia and Presbyopia Treatment Market Revenue (Million) Forecast, by Application 2019 & 2032
- Table 20: Germany Myopia and Presbyopia Treatment Market Volume (K Unit) Forecast, by Application 2019 & 2032
- Table 21: United Kingdom Myopia and Presbyopia Treatment Market Revenue (Million) Forecast, by Application 2019 & 2032
- Table 22: United Kingdom Myopia and Presbyopia Treatment Market Volume (K Unit) Forecast, by Application 2019 & 2032
- Table 23: France Myopia and Presbyopia Treatment Market Revenue (Million) Forecast, by Application 2019 & 2032
- Table 24: France Myopia and Presbyopia Treatment Market Volume (K Unit) Forecast, by Application 2019 & 2032
- Table 25: Italy Myopia and Presbyopia Treatment Market Revenue (Million) Forecast, by Application 2019 & 2032
- Table 26: Italy Myopia and Presbyopia Treatment Market Volume (K Unit) Forecast, by Application 2019 & 2032
- Table 27: Spain Myopia and Presbyopia Treatment Market Revenue (Million) Forecast, by Application 2019 & 2032
- Table 28: Spain Myopia and Presbyopia Treatment Market Volume (K Unit) Forecast, by Application 2019 & 2032
- Table 29: Rest of Europe Myopia and Presbyopia Treatment Market Revenue (Million) Forecast, by Application 2019 & 2032
- Table 30: Rest of Europe Myopia and Presbyopia Treatment Market Volume (K Unit) Forecast, by Application 2019 & 2032
- Table 31: Global Myopia and Presbyopia Treatment Market Revenue Million Forecast, by Country 2019 & 2032
- Table 32: Global Myopia and Presbyopia Treatment Market Volume K Unit Forecast, by Country 2019 & 2032
- Table 33: China Myopia and Presbyopia Treatment Market Revenue (Million) Forecast, by Application 2019 & 2032
- Table 34: China Myopia and Presbyopia Treatment Market Volume (K Unit) Forecast, by Application 2019 & 2032
- Table 35: Japan Myopia and Presbyopia Treatment Market Revenue (Million) Forecast, by Application 2019 & 2032
- Table 36: Japan Myopia and Presbyopia Treatment Market Volume (K Unit) Forecast, by Application 2019 & 2032
- Table 37: India Myopia and Presbyopia Treatment Market Revenue (Million) Forecast, by Application 2019 & 2032
- Table 38: India Myopia and Presbyopia Treatment Market Volume (K Unit) Forecast, by Application 2019 & 2032
- Table 39: Australia Myopia and Presbyopia Treatment Market Revenue (Million) Forecast, by Application 2019 & 2032
- Table 40: Australia Myopia and Presbyopia Treatment Market Volume (K Unit) Forecast, by Application 2019 & 2032
- Table 41: South Korea Myopia and Presbyopia Treatment Market Revenue (Million) Forecast, by Application 2019 & 2032
- Table 42: South Korea Myopia and Presbyopia Treatment Market Volume (K Unit) Forecast, by Application 2019 & 2032
- Table 43: Rest of Asia Pacific Myopia and Presbyopia Treatment Market Revenue (Million) Forecast, by Application 2019 & 2032
- Table 44: Rest of Asia Pacific Myopia and Presbyopia Treatment Market Volume (K Unit) Forecast, by Application 2019 & 2032
- Table 45: Global Myopia and Presbyopia Treatment Market Revenue Million Forecast, by Country 2019 & 2032
- Table 46: Global Myopia and Presbyopia Treatment Market Volume K Unit Forecast, by Country 2019 & 2032
- Table 47: GCC Myopia and Presbyopia Treatment Market Revenue (Million) Forecast, by Application 2019 & 2032
- Table 48: GCC Myopia and Presbyopia Treatment Market Volume (K Unit) Forecast, by Application 2019 & 2032
- Table 49: South Africa Myopia and Presbyopia Treatment Market Revenue (Million) Forecast, by Application 2019 & 2032
- Table 50: South Africa Myopia and Presbyopia Treatment Market Volume (K Unit) Forecast, by Application 2019 & 2032
- Table 51: Rest of Middle East and Africa Myopia and Presbyopia Treatment Market Revenue (Million) Forecast, by Application 2019 & 2032
- Table 52: Rest of Middle East and Africa Myopia and Presbyopia Treatment Market Volume (K Unit) Forecast, by Application 2019 & 2032
- Table 53: Global Myopia and Presbyopia Treatment Market Revenue Million Forecast, by Country 2019 & 2032
- Table 54: Global Myopia and Presbyopia Treatment Market Volume K Unit Forecast, by Country 2019 & 2032
- Table 55: Brazil Myopia and Presbyopia Treatment Market Revenue (Million) Forecast, by Application 2019 & 2032
- Table 56: Brazil Myopia and Presbyopia Treatment Market Volume (K Unit) Forecast, by Application 2019 & 2032
- Table 57: Argentina Myopia and Presbyopia Treatment Market Revenue (Million) Forecast, by Application 2019 & 2032
- Table 58: Argentina Myopia and Presbyopia Treatment Market Volume (K Unit) Forecast, by Application 2019 & 2032
- Table 59: Rest of South America Myopia and Presbyopia Treatment Market Revenue (Million) Forecast, by Application 2019 & 2032
- Table 60: Rest of South America Myopia and Presbyopia Treatment Market Volume (K Unit) Forecast, by Application 2019 & 2032
- Table 61: Global Myopia and Presbyopia Treatment Market Revenue Million Forecast, by Disease Type 2019 & 2032
- Table 62: Global Myopia and Presbyopia Treatment Market Volume K Unit Forecast, by Disease Type 2019 & 2032
- Table 63: Global Myopia and Presbyopia Treatment Market Revenue Million Forecast, by Treatment Type 2019 & 2032
- Table 64: Global Myopia and Presbyopia Treatment Market Volume K Unit Forecast, by Treatment Type 2019 & 2032
- Table 65: Global Myopia and Presbyopia Treatment Market Revenue Million Forecast, by Country 2019 & 2032
- Table 66: Global Myopia and Presbyopia Treatment Market Volume K Unit Forecast, by Country 2019 & 2032
- Table 67: United States Myopia and Presbyopia Treatment Market Revenue (Million) Forecast, by Application 2019 & 2032
- Table 68: United States Myopia and Presbyopia Treatment Market Volume (K Unit) Forecast, by Application 2019 & 2032
- Table 69: Canada Myopia and Presbyopia Treatment Market Revenue (Million) Forecast, by Application 2019 & 2032
- Table 70: Canada Myopia and Presbyopia Treatment Market Volume (K Unit) Forecast, by Application 2019 & 2032
- Table 71: Mexico Myopia and Presbyopia Treatment Market Revenue (Million) Forecast, by Application 2019 & 2032
- Table 72: Mexico Myopia and Presbyopia Treatment Market Volume (K Unit) Forecast, by Application 2019 & 2032
- Table 73: Global Myopia and Presbyopia Treatment Market Revenue Million Forecast, by Disease Type 2019 & 2032
- Table 74: Global Myopia and Presbyopia Treatment Market Volume K Unit Forecast, by Disease Type 2019 & 2032
- Table 75: Global Myopia and Presbyopia Treatment Market Revenue Million Forecast, by Treatment Type 2019 & 2032
- Table 76: Global Myopia and Presbyopia Treatment Market Volume K Unit Forecast, by Treatment Type 2019 & 2032
- Table 77: Global Myopia and Presbyopia Treatment Market Revenue Million Forecast, by Country 2019 & 2032
- Table 78: Global Myopia and Presbyopia Treatment Market Volume K Unit Forecast, by Country 2019 & 2032
- Table 79: Germany Myopia and Presbyopia Treatment Market Revenue (Million) Forecast, by Application 2019 & 2032
- Table 80: Germany Myopia and Presbyopia Treatment Market Volume (K Unit) Forecast, by Application 2019 & 2032
- Table 81: United Kingdom Myopia and Presbyopia Treatment Market Revenue (Million) Forecast, by Application 2019 & 2032
- Table 82: United Kingdom Myopia and Presbyopia Treatment Market Volume (K Unit) Forecast, by Application 2019 & 2032
- Table 83: France Myopia and Presbyopia Treatment Market Revenue (Million) Forecast, by Application 2019 & 2032
- Table 84: France Myopia and Presbyopia Treatment Market Volume (K Unit) Forecast, by Application 2019 & 2032
- Table 85: Italy Myopia and Presbyopia Treatment Market Revenue (Million) Forecast, by Application 2019 & 2032
- Table 86: Italy Myopia and Presbyopia Treatment Market Volume (K Unit) Forecast, by Application 2019 & 2032
- Table 87: Spain Myopia and Presbyopia Treatment Market Revenue (Million) Forecast, by Application 2019 & 2032
- Table 88: Spain Myopia and Presbyopia Treatment Market Volume (K Unit) Forecast, by Application 2019 & 2032
- Table 89: Rest of Europe Myopia and Presbyopia Treatment Market Revenue (Million) Forecast, by Application 2019 & 2032
- Table 90: Rest of Europe Myopia and Presbyopia Treatment Market Volume (K Unit) Forecast, by Application 2019 & 2032
- Table 91: Global Myopia and Presbyopia Treatment Market Revenue Million Forecast, by Disease Type 2019 & 2032
- Table 92: Global Myopia and Presbyopia Treatment Market Volume K Unit Forecast, by Disease Type 2019 & 2032
- Table 93: Global Myopia and Presbyopia Treatment Market Revenue Million Forecast, by Treatment Type 2019 & 2032
- Table 94: Global Myopia and Presbyopia Treatment Market Volume K Unit Forecast, by Treatment Type 2019 & 2032
- Table 95: Global Myopia and Presbyopia Treatment Market Revenue Million Forecast, by Country 2019 & 2032
- Table 96: Global Myopia and Presbyopia Treatment Market Volume K Unit Forecast, by Country 2019 & 2032
- Table 97: China Myopia and Presbyopia Treatment Market Revenue (Million) Forecast, by Application 2019 & 2032
- Table 98: China Myopia and Presbyopia Treatment Market Volume (K Unit) Forecast, by Application 2019 & 2032
- Table 99: Japan Myopia and Presbyopia Treatment Market Revenue (Million) Forecast, by Application 2019 & 2032
- Table 100: Japan Myopia and Presbyopia Treatment Market Volume (K Unit) Forecast, by Application 2019 & 2032
- Table 101: India Myopia and Presbyopia Treatment Market Revenue (Million) Forecast, by Application 2019 & 2032
- Table 102: India Myopia and Presbyopia Treatment Market Volume (K Unit) Forecast, by Application 2019 & 2032
- Table 103: Australia Myopia and Presbyopia Treatment Market Revenue (Million) Forecast, by Application 2019 & 2032
- Table 104: Australia Myopia and Presbyopia Treatment Market Volume (K Unit) Forecast, by Application 2019 & 2032
- Table 105: South Korea Myopia and Presbyopia Treatment Market Revenue (Million) Forecast, by Application 2019 & 2032
- Table 106: South Korea Myopia and Presbyopia Treatment Market Volume (K Unit) Forecast, by Application 2019 & 2032
- Table 107: Rest of Asia Pacific Myopia and Presbyopia Treatment Market Revenue (Million) Forecast, by Application 2019 & 2032
- Table 108: Rest of Asia Pacific Myopia and Presbyopia Treatment Market Volume (K Unit) Forecast, by Application 2019 & 2032
- Table 109: Global Myopia and Presbyopia Treatment Market Revenue Million Forecast, by Disease Type 2019 & 2032
- Table 110: Global Myopia and Presbyopia Treatment Market Volume K Unit Forecast, by Disease Type 2019 & 2032
- Table 111: Global Myopia and Presbyopia Treatment Market Revenue Million Forecast, by Treatment Type 2019 & 2032
- Table 112: Global Myopia and Presbyopia Treatment Market Volume K Unit Forecast, by Treatment Type 2019 & 2032
- Table 113: Global Myopia and Presbyopia Treatment Market Revenue Million Forecast, by Country 2019 & 2032
- Table 114: Global Myopia and Presbyopia Treatment Market Volume K Unit Forecast, by Country 2019 & 2032
- Table 115: GCC Myopia and Presbyopia Treatment Market Revenue (Million) Forecast, by Application 2019 & 2032
- Table 116: GCC Myopia and Presbyopia Treatment Market Volume (K Unit) Forecast, by Application 2019 & 2032
- Table 117: South Africa Myopia and Presbyopia Treatment Market Revenue (Million) Forecast, by Application 2019 & 2032
- Table 118: South Africa Myopia and Presbyopia Treatment Market Volume (K Unit) Forecast, by Application 2019 & 2032
- Table 119: Rest of Middle East and Africa Myopia and Presbyopia Treatment Market Revenue (Million) Forecast, by Application 2019 & 2032
- Table 120: Rest of Middle East and Africa Myopia and Presbyopia Treatment Market Volume (K Unit) Forecast, by Application 2019 & 2032
- Table 121: Global Myopia and Presbyopia Treatment Market Revenue Million Forecast, by Disease Type 2019 & 2032
- Table 122: Global Myopia and Presbyopia Treatment Market Volume K Unit Forecast, by Disease Type 2019 & 2032
- Table 123: Global Myopia and Presbyopia Treatment Market Revenue Million Forecast, by Treatment Type 2019 & 2032
- Table 124: Global Myopia and Presbyopia Treatment Market Volume K Unit Forecast, by Treatment Type 2019 & 2032
- Table 125: Global Myopia and Presbyopia Treatment Market Revenue Million Forecast, by Country 2019 & 2032
- Table 126: Global Myopia and Presbyopia Treatment Market Volume K Unit Forecast, by Country 2019 & 2032
- Table 127: Brazil Myopia and Presbyopia Treatment Market Revenue (Million) Forecast, by Application 2019 & 2032
- Table 128: Brazil Myopia and Presbyopia Treatment Market Volume (K Unit) Forecast, by Application 2019 & 2032
- Table 129: Argentina Myopia and Presbyopia Treatment Market Revenue (Million) Forecast, by Application 2019 & 2032
- Table 130: Argentina Myopia and Presbyopia Treatment Market Volume (K Unit) Forecast, by Application 2019 & 2032
- Table 131: Rest of South America Myopia and Presbyopia Treatment Market Revenue (Million) Forecast, by Application 2019 & 2032
- Table 132: Rest of South America Myopia and Presbyopia Treatment Market Volume (K Unit) Forecast, by Application 2019 & 2032
Frequently Asked Questions
1. What is the projected Compound Annual Growth Rate (CAGR) of the Myopia and Presbyopia Treatment Market?
The projected CAGR is approximately 5.11%.
2. Which companies are prominent players in the Myopia and Presbyopia Treatment Market?
Key companies in the market include Carl Zeiss Meditec AG, Regeneron Pharmaceuticals Inc, Essilor Luxottica (Essilor Ltd), ALCON Inc, Johnson & Johnson Vision, Zeimer Ophthalmic Systems AG, Orasis Pharmaceuticals, AbbVie, The Cooper Companies Inc , Topcon Corporation, NIDEK CO LTD, Bausch Health Companies Inc, Sydnexis.
3. What are the main segments of the Myopia and Presbyopia Treatment Market?
The market segments include Disease Type, Treatment Type.
4. Can you provide details about the market size?
The market size is estimated to be USD 26.13 Million as of 2022.
5. What are some drivers contributing to market growth?
Increasing Cases of Vision Impairment; Rising Geriatric Population.
6. What are the notable trends driving market growth?
Myopia is Expected to Hold Significant Market Share in the Disease Type Segment.
7. Are there any restraints impacting market growth?
Lack of Early Diagnosis; High Cost of Treatment.
8. Can you provide examples of recent developments in the market?
In October 2021, Allergan, a subsidiary of AbbVie, received approval from the Food and Drug Administration for Vuity (pilocarpine hydrochloric acid ophthalmic solution) 1.25% for the treatment of presbyopia, also known as age-related blurry near vision, in adults.
9. What pricing options are available for accessing the report?
Pricing options include single-user, multi-user, and enterprise licenses priced at USD 4750, USD 5250, and USD 8750 respectively.
10. Is the market size provided in terms of value or volume?
The market size is provided in terms of value, measured in Million and volume, measured in K Unit.
11. Are there any specific market keywords associated with the report?
Yes, the market keyword associated with the report is "Myopia and Presbyopia Treatment Market," which aids in identifying and referencing the specific market segment covered.
12. How do I determine which pricing option suits my needs best?
The pricing options vary based on user requirements and access needs. Individual users may opt for single-user licenses, while businesses requiring broader access may choose multi-user or enterprise licenses for cost-effective access to the report.
13. Are there any additional resources or data provided in the Myopia and Presbyopia Treatment Market report?
While the report offers comprehensive insights, it's advisable to review the specific contents or supplementary materials provided to ascertain if additional resources or data are available.
14. How can I stay updated on further developments or reports in the Myopia and Presbyopia Treatment Market?
To stay informed about further developments, trends, and reports in the Myopia and Presbyopia Treatment Market, consider subscribing to industry newsletters, following relevant companies and organizations, or regularly checking reputable industry news sources and publications.
Methodology
Step 1 - Identification of Relevant Samples Size from Population Database


Step 2 - Approaches for Defining Global Market Size (Value, Volume* & Price*)

Note*: In applicable scenarios
Step 3 - Data Sources
Primary Research
- Web Analytics
- Survey Reports
- Research Institute
- Latest Research Reports
- Opinion Leaders
Secondary Research
- Annual Reports
- White Paper
- Latest Press Release
- Industry Association
- Paid Database
- Investor Presentations

Step 4 - Data Triangulation
Involves using different sources of information in order to increase the validity of a study
These sources are likely to be stakeholders in a program - participants, other researchers, program staff, other community members, and so on.
Then we put all data in single framework & apply various statistical tools to find out the dynamic on the market.
During the analysis stage, feedback from the stakeholder groups would be compared to determine areas of agreement as well as areas of divergence


