
Key Insights
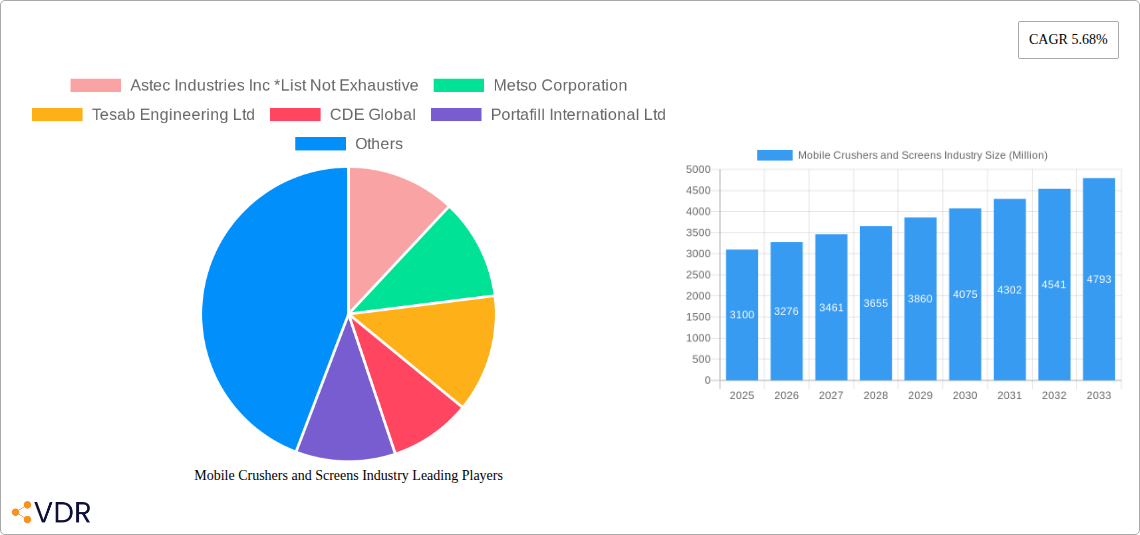
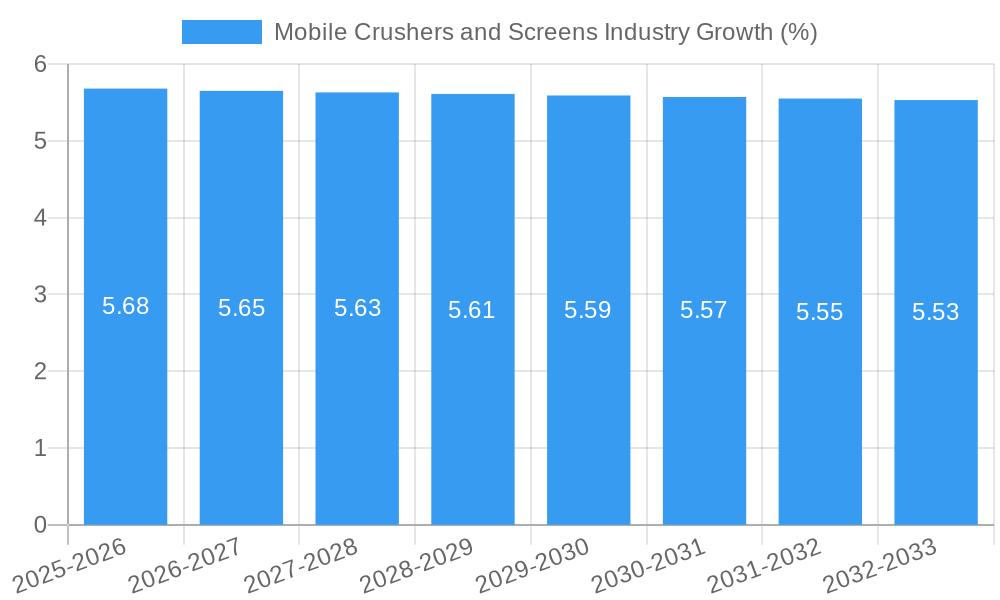
The global Mobile Crushers and Screens market is poised for significant expansion, projected to reach an estimated value of $3.10 billion in 2025, with a robust Compound Annual Growth Rate (CAGR) of 5.68%. This growth is propelled by a confluence of factors, primarily the escalating demand for aggregates in infrastructure development, mining operations, and construction projects worldwide. The increasing emphasis on recycling construction and demolition waste also contributes significantly, as mobile crushing and screening equipment offers an efficient and cost-effective solution for on-site processing. Furthermore, technological advancements, including the integration of IoT for remote monitoring and predictive maintenance, alongside the development of more fuel-efficient and environmentally friendly machinery, are acting as key drivers. The market is segmented by type, with new equipment expected to dominate, and by machinery type, where jaw, cone, and impact crushers, along with vibratory screeners, represent core product categories. End-user industries such as mining and metallurgy, and aggregate processing, are the primary consumers of these versatile machines.
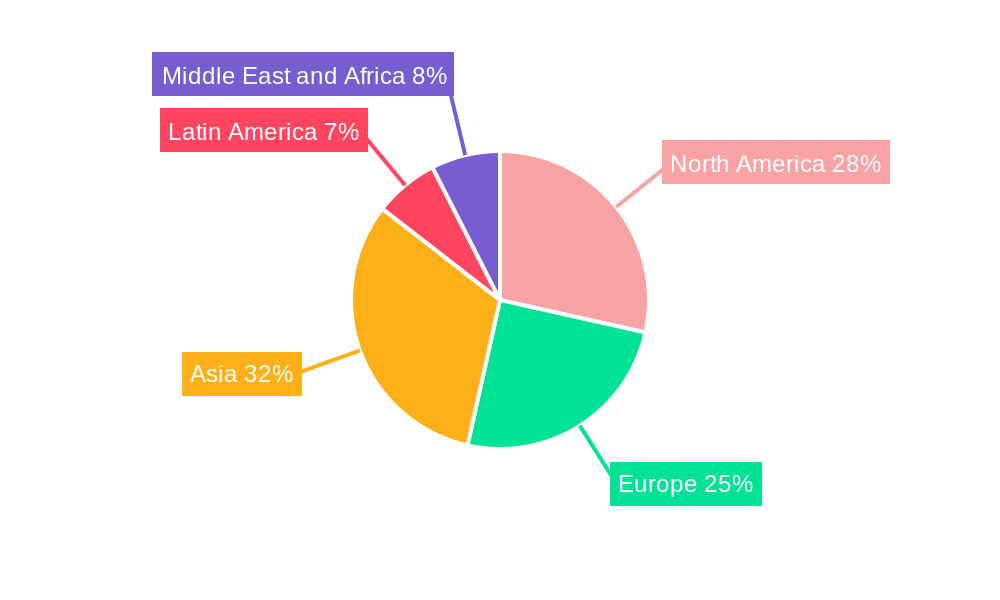
Despite the positive outlook, the market faces certain restraints, including the high initial investment cost of advanced mobile crushing and screening equipment and fluctuating raw material prices, which can impact manufacturing costs and equipment affordability. Geographically, North America and Europe are established markets, while the Asia-Pacific region, particularly China and India, is emerging as a high-growth area due to rapid urbanization and extensive infrastructure projects. Latin America, the Middle East, and Africa present further untapped potential. Leading companies in this competitive landscape include Astec Industries Inc., Metso Corporation, and Sandvik AB, among others, all actively investing in product innovation and strategic partnerships to capture market share. The forecast period of 2025-2033 indicates a sustained upward trajectory, underscoring the critical role of mobile crushing and screening solutions in modern industrial and construction ecosystems.
This in-depth report provides a definitive analysis of the global Mobile Crushers and Screens industry, offering critical insights for stakeholders. Covering the period from 2019 to 2033, with a base and estimated year of 2025, this study delves into market dynamics, growth trajectories, regional dominance, product innovations, and the competitive ecosystem. Uncover key drivers, emerging opportunities, and challenges shaping the future of mobile crushing and screening machinery. This report is essential for understanding market size evolution, adoption rates, technological disruptions, and strategic planning within this vital sector.
Mobile Crushers and Screens Industry Market Dynamics & Structure
The Mobile Crushers and Screens market exhibits a moderately concentrated structure, with a few key players holding significant market share, alongside a growing number of regional and specialized manufacturers. Technological innovation is a primary driver, fueled by the demand for more efficient, fuel-economic, and environmentally compliant crushing and screening solutions. Regulatory frameworks, particularly those concerning emissions and noise pollution, are increasingly influencing product design and adoption rates. Competitive product substitutes, such as stationary crushing and screening plants, pose a challenge, though the portability and flexibility of mobile units offer distinct advantages. End-user demographics are shifting towards contractors and smaller aggregate producers who value the adaptability and reduced logistical costs associated with mobile equipment. Mergers and acquisitions (M&A) trends are notable, with larger players acquiring smaller, innovative companies to expand their product portfolios and geographical reach. For instance, recent M&A activity in the last two years has seen approximately 5-7 significant deals valued between $50 million and $250 million, aimed at consolidating market position and technological capabilities. Innovation barriers include the high capital investment required for R&D and the complex supply chains for specialized components.
- Market Concentration: Moderate, with leading companies holding an estimated 30-40% of the global market share.
- Technological Innovation Drivers: Increased efficiency, fuel savings, remote operation capabilities, advanced automation, and compliance with stricter environmental regulations.
- Regulatory Frameworks: Stringent emissions standards (e.g., Tier 4, Stage V), noise reduction mandates, and site-specific operating permits influencing machinery selection.
- Competitive Product Substitutes: Stationary crushing and screening plants, although mobile solutions offer superior flexibility and deployment speed.
- End-User Demographics: Growing demand from the construction, road building, and mining sectors, with an increasing preference for versatile and easily deployable machinery.
- M&A Trends: Consolidation for market expansion, technology acquisition, and portfolio diversification. An estimated 7-10 M&A deals are anticipated annually within the forecast period.
Mobile Crushers and Screens Industry Growth Trends & Insights
The Mobile Crushers and Screens industry is projected for robust growth, driven by significant investments in infrastructure development worldwide and a persistent demand for aggregates. The global market size, estimated at $4,500 million in 2025, is expected to expand at a Compound Annual Growth Rate (CAGR) of approximately 6.5% during the forecast period of 2025-2033. Adoption rates for mobile crushing and screening solutions are on the rise, particularly in emerging economies where infrastructure projects are rapidly expanding. Technological disruptions are playing a crucial role, with advancements in automation, remote monitoring, and the integration of IoT (Internet of Things) for predictive maintenance enhancing operational efficiency and reducing downtime. Consumer behavior is shifting towards solutions that offer greater flexibility, lower operating costs, and improved environmental performance. The market penetration of advanced features like hybrid-electric drives and intelligent control systems is increasing, reflecting a growing preference for sustainable and technologically superior equipment. The historical period (2019-2024) witnessed a steady growth of around 5.8% annually, setting a strong foundation for future expansion. The increasing emphasis on recycling construction and demolition waste further fuels the demand for mobile crushing and screening equipment, contributing to market size evolution. Market penetration of new technologies is projected to reach 25-30% by 2030.
Dominant Regions, Countries, or Segments in Mobile Crushers and Screens Industry
North America, particularly the United States, is currently a dominant region in the Mobile Crushers and Screens industry, driven by extensive infrastructure projects, a mature mining sector, and a strong emphasis on construction and demolition waste recycling. The United States alone accounts for an estimated 25-30% of the global market share within this segment. Key drivers for this dominance include robust government spending on infrastructure renewal, a thriving private construction market, and favorable economic policies supporting industrial equipment acquisition. Furthermore, the region benefits from a well-established dealer network and a high adoption rate of advanced technologies.
Within the machinery type segment, Mobile Crushers, specifically Jaw Crushers and Impact Crushers, are leading the market due to their versatility in primary crushing applications across various materials. These are estimated to hold around 60% of the total mobile crushing equipment market. The Aggregate Processing end-user industry represents the largest market segment, consuming approximately 50-55% of all mobile crushers and screens. This is directly linked to the continuous demand for aggregates in road construction, building foundations, and general infrastructure development.
The New machinery type segment is expected to maintain its leadership, driven by demand for the latest technological advancements, greater efficiency, and longer warranty periods, representing an estimated 75-80% of the market. However, the Refurbished segment is showing significant growth, particularly in cost-conscious markets, due to its lower entry price point and the availability of reliable, pre-owned machinery.
- Dominant Region: North America (USA)
- Key Drivers: Extensive infrastructure investment, robust construction activity, significant mining operations, strong recycling initiatives, and a mature dealer network.
- Market Share Contribution: Approximately 25-30% of the global market.
- Dominant Machinery Type: Mobile Crushers (Jaw and Impact Crushers)
- Key Drivers: Versatility in primary crushing, suitability for diverse materials, and widespread application in aggregate production.
- Market Share within Mobile Crushers: Estimated 60% for Jaw and Impact Crushers combined.
- Dominant End-user Industry: Aggregate Processing
- Key Drivers: Continuous demand for construction materials, road building projects, and infrastructure development globally.
- Market Share: Approximately 50-55% of the total end-user market.
- Dominant Type: New Machinery
- Key Drivers: Demand for advanced technology, higher efficiency, longer lifespan, and warranty benefits.
- Market Share: Estimated 75-80% of the market.
Mobile Crushers and Screens Industry Product Landscape
The product landscape is characterized by continuous innovation focused on enhancing efficiency, reducing environmental impact, and increasing operational intelligence. Key product innovations include the development of hybrid and electric-powered mobile crushers and screens, significantly lowering fuel consumption and emissions. Advanced automation and telematics systems are being integrated, allowing for remote monitoring, diagnostics, and even remote operation, thereby optimizing performance and minimizing downtime. Furthermore, manufacturers are focusing on modular designs that allow for greater flexibility in setup and transportation. The applications for these machines span from primary crushing of hard rock in mining operations to precise screening for recycled materials in construction. Performance metrics such as throughput capacity, energy efficiency (kWh/ton), and wear part lifespan are continuously being improved, with cutting-edge models now achieving up to 500 tons per hour throughput and 30% higher energy efficiency compared to previous generations.
Key Drivers, Barriers & Challenges in Mobile Crushers and Screens Industry
Key Drivers: The mobile crushers and screens industry is propelled by significant global investment in infrastructure development, driving the demand for construction materials. The growing emphasis on sustainable practices and the circular economy, particularly the recycling of construction and demolition waste, is a major catalyst. Technological advancements leading to increased efficiency, reduced fuel consumption, and enhanced automation further fuel adoption. Economic growth in emerging markets and the need for flexible, site-adaptable machinery in remote or modular construction projects also contribute to market expansion.
Barriers & Challenges: High initial capital investment for advanced machinery can be a significant barrier, especially for smaller enterprises. Stringent environmental regulations regarding noise and emissions, while driving innovation, also necessitate costly upgrades and compliance measures. Supply chain disruptions and the fluctuating costs of raw materials and components can impact production and profitability. Intense competition from established players and the emergence of new entrants, particularly from lower-cost manufacturing regions, pose competitive pressures. Furthermore, the availability of skilled labor for operating and maintaining complex machinery can be a challenge in certain regions. The estimated impact of regulatory hurdles can increase operational costs by 5-10%.
Emerging Opportunities in Mobile Crushers and Screens Industry
Emerging opportunities lie in the development and adoption of ultra-low emission and noise mobile crushing and screening solutions, aligning with increasing environmental consciousness and urban development regulations. The growing trend of modular construction projects, especially in developing economies, presents a significant opportunity for mobile equipment that can be easily transported and deployed. Furthermore, the expansion of the recycling sector, particularly for plastics and other non-traditional materials requiring specialized crushing and screening, offers untapped market potential. The integration of AI-powered analytics for predictive maintenance and optimization of crushing circuits presents an avenue for value-added services and enhanced customer engagement.
Growth Accelerators in the Mobile Crushers and Screens Industry Industry
Long-term growth in the mobile crushers and screens industry will be significantly accelerated by continuous technological breakthroughs, such as advancements in battery technology for fully electric mobile crushing and screening equipment, and the widespread adoption of Industry 4.0 principles for enhanced connectivity and data analytics. Strategic partnerships between manufacturers and technology providers will foster innovation in areas like remote diagnostics and autonomous operation. Market expansion strategies targeting untapped regions with nascent infrastructure development and robust resource extraction will unlock new revenue streams. Furthermore, increasing government incentives for green construction and waste recycling initiatives will provide a sustained boost to the demand for advanced and sustainable mobile crushing and screening solutions.
Key Players Shaping the Mobile Crushers and Screens Industry Market
- Astec Industries Inc
- Metso Corporation
- Tesab Engineering Ltd
- CDE Global
- Portafill International Ltd
- Kleemann GmbH (Wirtgen Group)
- SBM Mineral Processing GmbH
- Sandvik AB
- Rubble Master HMH GmbH
- McCloskey International Ltd
- IROCK Crushers
- Hartl Holding GmbH
- Komatsu Mining Corporation
- Terex Corporation
Notable Milestones in Mobile Crushers and Screens Industry Sector
- June 2023: Rubble Master Group (RM Group) expanded its presence in the Southeast Asian market by opening a new subsidiary in Singapore. This will further strengthen the network of companies in Southeast Asia and across Asia to build closer relations with their dealers and customers.
- June 2023: Tesab announced that Maverick Environmental Equipment joined the global network of dealers as an exclusive partner in the states of Michigan and Ohio. In support of Tesab's ongoing commitment to the American market, Maverick will offer a full range of products from Tesab and be an ideal partner.
In-Depth Mobile Crushers and Screens Industry Market Outlook
The future outlook for the Mobile Crushers and Screens industry is exceptionally promising, driven by the confluence of global infrastructure investment, the imperative for sustainable resource management, and relentless technological innovation. Growth accelerators such as the development of fully electric and autonomous mobile crushing and screening equipment, coupled with the increasing integration of AI for operational optimization, will redefine market efficiency. Strategic alliances and market penetration into emerging economies with significant untapped potential will fuel expansion. The growing emphasis on recycling and the circular economy will continue to bolster demand for versatile and environmentally friendly mobile solutions, ensuring a sustained upward trajectory for the industry and presenting significant strategic opportunities for market leaders and new entrants alike.
Mobile Crushers and Screens Industry Segmentation
-
1. Type
- 1.1. New
- 1.2. Refurbished
-
2. Machinery Type
- 2.1. Mobile Crusher (Jaw, Cone, Impact, etc.)
- 2.2. Mobile Screener (Vibratory, Gyratory, etc.)
-
3. End-user Industry
- 3.1. Mining and Metallurgy
- 3.2. Aggregate Processing
- 3.3. Other End-user Industries
Mobile Crushers and Screens Industry Segmentation By Geography
-
1. North America
- 1.1. United States
- 1.2. Canada
-
2. Europe
- 2.1. Germany
- 2.2. United Kingdom
- 2.3. France
-
3. Asia
- 3.1. China
- 3.2. India
- 3.3. Japan
- 3.4. Australia and New Zealand
- 4. Latin America
- 5. Middle East and Africa
Mobile Crushers and Screens Industry REPORT HIGHLIGHTS
| Aspects | Details |
|---|---|
| Study Period | 2019-2033 |
| Base Year | 2024 |
| Estimated Year | 2025 |
| Forecast Period | 2025-2033 |
| Historical Period | 2019-2024 |
| Growth Rate | CAGR of 5.68% from 2019-2033 |
| Segmentation |
|
Table of Contents
- 1. Introduction
- 1.1. Research Scope
- 1.2. Market Segmentation
- 1.3. Research Methodology
- 1.4. Definitions and Assumptions
- 2. Executive Summary
- 2.1. Introduction
- 3. Market Dynamics
- 3.1. Introduction
- 3.2. Market Drivers
- 3.2.1. Demand for Reduced Transportation Costs and Greater Flexibility in Machinery of the Mining Industry; Rise of the Construction Industry Due to Rapid Urbanization
- 3.3. Market Restrains
- 3.3.1. Effects of Carbon Emission from Machinery
- 3.4. Market Trends
- 3.4.1. Aggregate Processing to be the Largest End-user Industry
- 4. Market Factor Analysis
- 4.1. Porters Five Forces
- 4.2. Supply/Value Chain
- 4.3. PESTEL analysis
- 4.4. Market Entropy
- 4.5. Patent/Trademark Analysis
- 5. Global Mobile Crushers and Screens Industry Analysis, Insights and Forecast, 2019-2031
- 5.1. Market Analysis, Insights and Forecast - by Type
- 5.1.1. New
- 5.1.2. Refurbished
- 5.2. Market Analysis, Insights and Forecast - by Machinery Type
- 5.2.1. Mobile Crusher (Jaw, Cone, Impact, etc.)
- 5.2.2. Mobile Screener (Vibratory, Gyratory, etc.)
- 5.3. Market Analysis, Insights and Forecast - by End-user Industry
- 5.3.1. Mining and Metallurgy
- 5.3.2. Aggregate Processing
- 5.3.3. Other End-user Industries
- 5.4. Market Analysis, Insights and Forecast - by Region
- 5.4.1. North America
- 5.4.2. Europe
- 5.4.3. Asia
- 5.4.4. Latin America
- 5.4.5. Middle East and Africa
- 5.1. Market Analysis, Insights and Forecast - by Type
- 6. North America Mobile Crushers and Screens Industry Analysis, Insights and Forecast, 2019-2031
- 6.1. Market Analysis, Insights and Forecast - by Type
- 6.1.1. New
- 6.1.2. Refurbished
- 6.2. Market Analysis, Insights and Forecast - by Machinery Type
- 6.2.1. Mobile Crusher (Jaw, Cone, Impact, etc.)
- 6.2.2. Mobile Screener (Vibratory, Gyratory, etc.)
- 6.3. Market Analysis, Insights and Forecast - by End-user Industry
- 6.3.1. Mining and Metallurgy
- 6.3.2. Aggregate Processing
- 6.3.3. Other End-user Industries
- 6.1. Market Analysis, Insights and Forecast - by Type
- 7. Europe Mobile Crushers and Screens Industry Analysis, Insights and Forecast, 2019-2031
- 7.1. Market Analysis, Insights and Forecast - by Type
- 7.1.1. New
- 7.1.2. Refurbished
- 7.2. Market Analysis, Insights and Forecast - by Machinery Type
- 7.2.1. Mobile Crusher (Jaw, Cone, Impact, etc.)
- 7.2.2. Mobile Screener (Vibratory, Gyratory, etc.)
- 7.3. Market Analysis, Insights and Forecast - by End-user Industry
- 7.3.1. Mining and Metallurgy
- 7.3.2. Aggregate Processing
- 7.3.3. Other End-user Industries
- 7.1. Market Analysis, Insights and Forecast - by Type
- 8. Asia Mobile Crushers and Screens Industry Analysis, Insights and Forecast, 2019-2031
- 8.1. Market Analysis, Insights and Forecast - by Type
- 8.1.1. New
- 8.1.2. Refurbished
- 8.2. Market Analysis, Insights and Forecast - by Machinery Type
- 8.2.1. Mobile Crusher (Jaw, Cone, Impact, etc.)
- 8.2.2. Mobile Screener (Vibratory, Gyratory, etc.)
- 8.3. Market Analysis, Insights and Forecast - by End-user Industry
- 8.3.1. Mining and Metallurgy
- 8.3.2. Aggregate Processing
- 8.3.3. Other End-user Industries
- 8.1. Market Analysis, Insights and Forecast - by Type
- 9. Latin America Mobile Crushers and Screens Industry Analysis, Insights and Forecast, 2019-2031
- 9.1. Market Analysis, Insights and Forecast - by Type
- 9.1.1. New
- 9.1.2. Refurbished
- 9.2. Market Analysis, Insights and Forecast - by Machinery Type
- 9.2.1. Mobile Crusher (Jaw, Cone, Impact, etc.)
- 9.2.2. Mobile Screener (Vibratory, Gyratory, etc.)
- 9.3. Market Analysis, Insights and Forecast - by End-user Industry
- 9.3.1. Mining and Metallurgy
- 9.3.2. Aggregate Processing
- 9.3.3. Other End-user Industries
- 9.1. Market Analysis, Insights and Forecast - by Type
- 10. Middle East and Africa Mobile Crushers and Screens Industry Analysis, Insights and Forecast, 2019-2031
- 10.1. Market Analysis, Insights and Forecast - by Type
- 10.1.1. New
- 10.1.2. Refurbished
- 10.2. Market Analysis, Insights and Forecast - by Machinery Type
- 10.2.1. Mobile Crusher (Jaw, Cone, Impact, etc.)
- 10.2.2. Mobile Screener (Vibratory, Gyratory, etc.)
- 10.3. Market Analysis, Insights and Forecast - by End-user Industry
- 10.3.1. Mining and Metallurgy
- 10.3.2. Aggregate Processing
- 10.3.3. Other End-user Industries
- 10.1. Market Analysis, Insights and Forecast - by Type
- 11. North America Mobile Crushers and Screens Industry Analysis, Insights and Forecast, 2019-2031
- 11.1. Market Analysis, Insights and Forecast - By Country/Sub-region
- 11.1.1 United States
- 11.1.2 Canada
- 12. Europe Mobile Crushers and Screens Industry Analysis, Insights and Forecast, 2019-2031
- 12.1. Market Analysis, Insights and Forecast - By Country/Sub-region
- 12.1.1 Germany
- 12.1.2 United Kingdom
- 12.1.3 France
- 13. Asia Mobile Crushers and Screens Industry Analysis, Insights and Forecast, 2019-2031
- 13.1. Market Analysis, Insights and Forecast - By Country/Sub-region
- 13.1.1 China
- 13.1.2 India
- 13.1.3 Japan
- 13.1.4 Australia and New Zealand
- 14. Latin America Mobile Crushers and Screens Industry Analysis, Insights and Forecast, 2019-2031
- 14.1. Market Analysis, Insights and Forecast - By Country/Sub-region
- 14.1.1.
- 15. Middle East and Africa Mobile Crushers and Screens Industry Analysis, Insights and Forecast, 2019-2031
- 15.1. Market Analysis, Insights and Forecast - By Country/Sub-region
- 15.1.1.
- 16. Competitive Analysis
- 16.1. Global Market Share Analysis 2024
- 16.2. Company Profiles
- 16.2.1 Astec Industries Inc *List Not Exhaustive
- 16.2.1.1. Overview
- 16.2.1.2. Products
- 16.2.1.3. SWOT Analysis
- 16.2.1.4. Recent Developments
- 16.2.1.5. Financials (Based on Availability)
- 16.2.2 Metso Corporation
- 16.2.2.1. Overview
- 16.2.2.2. Products
- 16.2.2.3. SWOT Analysis
- 16.2.2.4. Recent Developments
- 16.2.2.5. Financials (Based on Availability)
- 16.2.3 Tesab Engineering Ltd
- 16.2.3.1. Overview
- 16.2.3.2. Products
- 16.2.3.3. SWOT Analysis
- 16.2.3.4. Recent Developments
- 16.2.3.5. Financials (Based on Availability)
- 16.2.4 CDE Global
- 16.2.4.1. Overview
- 16.2.4.2. Products
- 16.2.4.3. SWOT Analysis
- 16.2.4.4. Recent Developments
- 16.2.4.5. Financials (Based on Availability)
- 16.2.5 Portafill International Ltd
- 16.2.5.1. Overview
- 16.2.5.2. Products
- 16.2.5.3. SWOT Analysis
- 16.2.5.4. Recent Developments
- 16.2.5.5. Financials (Based on Availability)
- 16.2.6 Kleemann GmbH (Wirtgen Group)
- 16.2.6.1. Overview
- 16.2.6.2. Products
- 16.2.6.3. SWOT Analysis
- 16.2.6.4. Recent Developments
- 16.2.6.5. Financials (Based on Availability)
- 16.2.7 SBM Mineral Processing GmbH
- 16.2.7.1. Overview
- 16.2.7.2. Products
- 16.2.7.3. SWOT Analysis
- 16.2.7.4. Recent Developments
- 16.2.7.5. Financials (Based on Availability)
- 16.2.8 Sandvik AB
- 16.2.8.1. Overview
- 16.2.8.2. Products
- 16.2.8.3. SWOT Analysis
- 16.2.8.4. Recent Developments
- 16.2.8.5. Financials (Based on Availability)
- 16.2.9 Rubble Master HMH GmbH
- 16.2.9.1. Overview
- 16.2.9.2. Products
- 16.2.9.3. SWOT Analysis
- 16.2.9.4. Recent Developments
- 16.2.9.5. Financials (Based on Availability)
- 16.2.10 McCloskey International Ltd
- 16.2.10.1. Overview
- 16.2.10.2. Products
- 16.2.10.3. SWOT Analysis
- 16.2.10.4. Recent Developments
- 16.2.10.5. Financials (Based on Availability)
- 16.2.11 IROCK Crushers
- 16.2.11.1. Overview
- 16.2.11.2. Products
- 16.2.11.3. SWOT Analysis
- 16.2.11.4. Recent Developments
- 16.2.11.5. Financials (Based on Availability)
- 16.2.12 Hartl Holding GmbH
- 16.2.12.1. Overview
- 16.2.12.2. Products
- 16.2.12.3. SWOT Analysis
- 16.2.12.4. Recent Developments
- 16.2.12.5. Financials (Based on Availability)
- 16.2.13 Komatsu Mining Corporation
- 16.2.13.1. Overview
- 16.2.13.2. Products
- 16.2.13.3. SWOT Analysis
- 16.2.13.4. Recent Developments
- 16.2.13.5. Financials (Based on Availability)
- 16.2.14 Terex Corporation
- 16.2.14.1. Overview
- 16.2.14.2. Products
- 16.2.14.3. SWOT Analysis
- 16.2.14.4. Recent Developments
- 16.2.14.5. Financials (Based on Availability)
- 16.2.1 Astec Industries Inc *List Not Exhaustive
List of Figures
- Figure 1: Global Mobile Crushers and Screens Industry Revenue Breakdown (Million, %) by Region 2024 & 2032
- Figure 2: North America Mobile Crushers and Screens Industry Revenue (Million), by Country 2024 & 2032
- Figure 3: North America Mobile Crushers and Screens Industry Revenue Share (%), by Country 2024 & 2032
- Figure 4: Europe Mobile Crushers and Screens Industry Revenue (Million), by Country 2024 & 2032
- Figure 5: Europe Mobile Crushers and Screens Industry Revenue Share (%), by Country 2024 & 2032
- Figure 6: Asia Mobile Crushers and Screens Industry Revenue (Million), by Country 2024 & 2032
- Figure 7: Asia Mobile Crushers and Screens Industry Revenue Share (%), by Country 2024 & 2032
- Figure 8: Latin America Mobile Crushers and Screens Industry Revenue (Million), by Country 2024 & 2032
- Figure 9: Latin America Mobile Crushers and Screens Industry Revenue Share (%), by Country 2024 & 2032
- Figure 10: Middle East and Africa Mobile Crushers and Screens Industry Revenue (Million), by Country 2024 & 2032
- Figure 11: Middle East and Africa Mobile Crushers and Screens Industry Revenue Share (%), by Country 2024 & 2032
- Figure 12: North America Mobile Crushers and Screens Industry Revenue (Million), by Type 2024 & 2032
- Figure 13: North America Mobile Crushers and Screens Industry Revenue Share (%), by Type 2024 & 2032
- Figure 14: North America Mobile Crushers and Screens Industry Revenue (Million), by Machinery Type 2024 & 2032
- Figure 15: North America Mobile Crushers and Screens Industry Revenue Share (%), by Machinery Type 2024 & 2032
- Figure 16: North America Mobile Crushers and Screens Industry Revenue (Million), by End-user Industry 2024 & 2032
- Figure 17: North America Mobile Crushers and Screens Industry Revenue Share (%), by End-user Industry 2024 & 2032
- Figure 18: North America Mobile Crushers and Screens Industry Revenue (Million), by Country 2024 & 2032
- Figure 19: North America Mobile Crushers and Screens Industry Revenue Share (%), by Country 2024 & 2032
- Figure 20: Europe Mobile Crushers and Screens Industry Revenue (Million), by Type 2024 & 2032
- Figure 21: Europe Mobile Crushers and Screens Industry Revenue Share (%), by Type 2024 & 2032
- Figure 22: Europe Mobile Crushers and Screens Industry Revenue (Million), by Machinery Type 2024 & 2032
- Figure 23: Europe Mobile Crushers and Screens Industry Revenue Share (%), by Machinery Type 2024 & 2032
- Figure 24: Europe Mobile Crushers and Screens Industry Revenue (Million), by End-user Industry 2024 & 2032
- Figure 25: Europe Mobile Crushers and Screens Industry Revenue Share (%), by End-user Industry 2024 & 2032
- Figure 26: Europe Mobile Crushers and Screens Industry Revenue (Million), by Country 2024 & 2032
- Figure 27: Europe Mobile Crushers and Screens Industry Revenue Share (%), by Country 2024 & 2032
- Figure 28: Asia Mobile Crushers and Screens Industry Revenue (Million), by Type 2024 & 2032
- Figure 29: Asia Mobile Crushers and Screens Industry Revenue Share (%), by Type 2024 & 2032
- Figure 30: Asia Mobile Crushers and Screens Industry Revenue (Million), by Machinery Type 2024 & 2032
- Figure 31: Asia Mobile Crushers and Screens Industry Revenue Share (%), by Machinery Type 2024 & 2032
- Figure 32: Asia Mobile Crushers and Screens Industry Revenue (Million), by End-user Industry 2024 & 2032
- Figure 33: Asia Mobile Crushers and Screens Industry Revenue Share (%), by End-user Industry 2024 & 2032
- Figure 34: Asia Mobile Crushers and Screens Industry Revenue (Million), by Country 2024 & 2032
- Figure 35: Asia Mobile Crushers and Screens Industry Revenue Share (%), by Country 2024 & 2032
- Figure 36: Latin America Mobile Crushers and Screens Industry Revenue (Million), by Type 2024 & 2032
- Figure 37: Latin America Mobile Crushers and Screens Industry Revenue Share (%), by Type 2024 & 2032
- Figure 38: Latin America Mobile Crushers and Screens Industry Revenue (Million), by Machinery Type 2024 & 2032
- Figure 39: Latin America Mobile Crushers and Screens Industry Revenue Share (%), by Machinery Type 2024 & 2032
- Figure 40: Latin America Mobile Crushers and Screens Industry Revenue (Million), by End-user Industry 2024 & 2032
- Figure 41: Latin America Mobile Crushers and Screens Industry Revenue Share (%), by End-user Industry 2024 & 2032
- Figure 42: Latin America Mobile Crushers and Screens Industry Revenue (Million), by Country 2024 & 2032
- Figure 43: Latin America Mobile Crushers and Screens Industry Revenue Share (%), by Country 2024 & 2032
- Figure 44: Middle East and Africa Mobile Crushers and Screens Industry Revenue (Million), by Type 2024 & 2032
- Figure 45: Middle East and Africa Mobile Crushers and Screens Industry Revenue Share (%), by Type 2024 & 2032
- Figure 46: Middle East and Africa Mobile Crushers and Screens Industry Revenue (Million), by Machinery Type 2024 & 2032
- Figure 47: Middle East and Africa Mobile Crushers and Screens Industry Revenue Share (%), by Machinery Type 2024 & 2032
- Figure 48: Middle East and Africa Mobile Crushers and Screens Industry Revenue (Million), by End-user Industry 2024 & 2032
- Figure 49: Middle East and Africa Mobile Crushers and Screens Industry Revenue Share (%), by End-user Industry 2024 & 2032
- Figure 50: Middle East and Africa Mobile Crushers and Screens Industry Revenue (Million), by Country 2024 & 2032
- Figure 51: Middle East and Africa Mobile Crushers and Screens Industry Revenue Share (%), by Country 2024 & 2032
List of Tables
- Table 1: Global Mobile Crushers and Screens Industry Revenue Million Forecast, by Region 2019 & 2032
- Table 2: Global Mobile Crushers and Screens Industry Revenue Million Forecast, by Type 2019 & 2032
- Table 3: Global Mobile Crushers and Screens Industry Revenue Million Forecast, by Machinery Type 2019 & 2032
- Table 4: Global Mobile Crushers and Screens Industry Revenue Million Forecast, by End-user Industry 2019 & 2032
- Table 5: Global Mobile Crushers and Screens Industry Revenue Million Forecast, by Region 2019 & 2032
- Table 6: Global Mobile Crushers and Screens Industry Revenue Million Forecast, by Country 2019 & 2032
- Table 7: United States Mobile Crushers and Screens Industry Revenue (Million) Forecast, by Application 2019 & 2032
- Table 8: Canada Mobile Crushers and Screens Industry Revenue (Million) Forecast, by Application 2019 & 2032
- Table 9: Global Mobile Crushers and Screens Industry Revenue Million Forecast, by Country 2019 & 2032
- Table 10: Germany Mobile Crushers and Screens Industry Revenue (Million) Forecast, by Application 2019 & 2032
- Table 11: United Kingdom Mobile Crushers and Screens Industry Revenue (Million) Forecast, by Application 2019 & 2032
- Table 12: France Mobile Crushers and Screens Industry Revenue (Million) Forecast, by Application 2019 & 2032
- Table 13: Global Mobile Crushers and Screens Industry Revenue Million Forecast, by Country 2019 & 2032
- Table 14: China Mobile Crushers and Screens Industry Revenue (Million) Forecast, by Application 2019 & 2032
- Table 15: India Mobile Crushers and Screens Industry Revenue (Million) Forecast, by Application 2019 & 2032
- Table 16: Japan Mobile Crushers and Screens Industry Revenue (Million) Forecast, by Application 2019 & 2032
- Table 17: Australia and New Zealand Mobile Crushers and Screens Industry Revenue (Million) Forecast, by Application 2019 & 2032
- Table 18: Global Mobile Crushers and Screens Industry Revenue Million Forecast, by Country 2019 & 2032
- Table 19: Mobile Crushers and Screens Industry Revenue (Million) Forecast, by Application 2019 & 2032
- Table 20: Global Mobile Crushers and Screens Industry Revenue Million Forecast, by Country 2019 & 2032
- Table 21: Mobile Crushers and Screens Industry Revenue (Million) Forecast, by Application 2019 & 2032
- Table 22: Global Mobile Crushers and Screens Industry Revenue Million Forecast, by Type 2019 & 2032
- Table 23: Global Mobile Crushers and Screens Industry Revenue Million Forecast, by Machinery Type 2019 & 2032
- Table 24: Global Mobile Crushers and Screens Industry Revenue Million Forecast, by End-user Industry 2019 & 2032
- Table 25: Global Mobile Crushers and Screens Industry Revenue Million Forecast, by Country 2019 & 2032
- Table 26: United States Mobile Crushers and Screens Industry Revenue (Million) Forecast, by Application 2019 & 2032
- Table 27: Canada Mobile Crushers and Screens Industry Revenue (Million) Forecast, by Application 2019 & 2032
- Table 28: Global Mobile Crushers and Screens Industry Revenue Million Forecast, by Type 2019 & 2032
- Table 29: Global Mobile Crushers and Screens Industry Revenue Million Forecast, by Machinery Type 2019 & 2032
- Table 30: Global Mobile Crushers and Screens Industry Revenue Million Forecast, by End-user Industry 2019 & 2032
- Table 31: Global Mobile Crushers and Screens Industry Revenue Million Forecast, by Country 2019 & 2032
- Table 32: Germany Mobile Crushers and Screens Industry Revenue (Million) Forecast, by Application 2019 & 2032
- Table 33: United Kingdom Mobile Crushers and Screens Industry Revenue (Million) Forecast, by Application 2019 & 2032
- Table 34: France Mobile Crushers and Screens Industry Revenue (Million) Forecast, by Application 2019 & 2032
- Table 35: Global Mobile Crushers and Screens Industry Revenue Million Forecast, by Type 2019 & 2032
- Table 36: Global Mobile Crushers and Screens Industry Revenue Million Forecast, by Machinery Type 2019 & 2032
- Table 37: Global Mobile Crushers and Screens Industry Revenue Million Forecast, by End-user Industry 2019 & 2032
- Table 38: Global Mobile Crushers and Screens Industry Revenue Million Forecast, by Country 2019 & 2032
- Table 39: China Mobile Crushers and Screens Industry Revenue (Million) Forecast, by Application 2019 & 2032
- Table 40: India Mobile Crushers and Screens Industry Revenue (Million) Forecast, by Application 2019 & 2032
- Table 41: Japan Mobile Crushers and Screens Industry Revenue (Million) Forecast, by Application 2019 & 2032
- Table 42: Australia and New Zealand Mobile Crushers and Screens Industry Revenue (Million) Forecast, by Application 2019 & 2032
- Table 43: Global Mobile Crushers and Screens Industry Revenue Million Forecast, by Type 2019 & 2032
- Table 44: Global Mobile Crushers and Screens Industry Revenue Million Forecast, by Machinery Type 2019 & 2032
- Table 45: Global Mobile Crushers and Screens Industry Revenue Million Forecast, by End-user Industry 2019 & 2032
- Table 46: Global Mobile Crushers and Screens Industry Revenue Million Forecast, by Country 2019 & 2032
- Table 47: Global Mobile Crushers and Screens Industry Revenue Million Forecast, by Type 2019 & 2032
- Table 48: Global Mobile Crushers and Screens Industry Revenue Million Forecast, by Machinery Type 2019 & 2032
- Table 49: Global Mobile Crushers and Screens Industry Revenue Million Forecast, by End-user Industry 2019 & 2032
- Table 50: Global Mobile Crushers and Screens Industry Revenue Million Forecast, by Country 2019 & 2032
Frequently Asked Questions
1. What is the projected Compound Annual Growth Rate (CAGR) of the Mobile Crushers and Screens Industry?
The projected CAGR is approximately 5.68%.
2. Which companies are prominent players in the Mobile Crushers and Screens Industry?
Key companies in the market include Astec Industries Inc *List Not Exhaustive, Metso Corporation, Tesab Engineering Ltd, CDE Global, Portafill International Ltd, Kleemann GmbH (Wirtgen Group), SBM Mineral Processing GmbH, Sandvik AB, Rubble Master HMH GmbH, McCloskey International Ltd, IROCK Crushers, Hartl Holding GmbH, Komatsu Mining Corporation, Terex Corporation.
3. What are the main segments of the Mobile Crushers and Screens Industry?
The market segments include Type, Machinery Type, End-user Industry.
4. Can you provide details about the market size?
The market size is estimated to be USD 3.10 Million as of 2022.
5. What are some drivers contributing to market growth?
Demand for Reduced Transportation Costs and Greater Flexibility in Machinery of the Mining Industry; Rise of the Construction Industry Due to Rapid Urbanization.
6. What are the notable trends driving market growth?
Aggregate Processing to be the Largest End-user Industry.
7. Are there any restraints impacting market growth?
Effects of Carbon Emission from Machinery.
8. Can you provide examples of recent developments in the market?
June 2023: Rubble Master Group (RM Group) expanded its presence in the Southeast Asian market by opening a new subsidiary in Singapore. This will further strengthen the network of companies in Southeast Asia and across Asia to build closer relations with their dealers and customers.
9. What pricing options are available for accessing the report?
Pricing options include single-user, multi-user, and enterprise licenses priced at USD 4750, USD 5250, and USD 8750 respectively.
10. Is the market size provided in terms of value or volume?
The market size is provided in terms of value, measured in Million.
11. Are there any specific market keywords associated with the report?
Yes, the market keyword associated with the report is "Mobile Crushers and Screens Industry," which aids in identifying and referencing the specific market segment covered.
12. How do I determine which pricing option suits my needs best?
The pricing options vary based on user requirements and access needs. Individual users may opt for single-user licenses, while businesses requiring broader access may choose multi-user or enterprise licenses for cost-effective access to the report.
13. Are there any additional resources or data provided in the Mobile Crushers and Screens Industry report?
While the report offers comprehensive insights, it's advisable to review the specific contents or supplementary materials provided to ascertain if additional resources or data are available.
14. How can I stay updated on further developments or reports in the Mobile Crushers and Screens Industry?
To stay informed about further developments, trends, and reports in the Mobile Crushers and Screens Industry, consider subscribing to industry newsletters, following relevant companies and organizations, or regularly checking reputable industry news sources and publications.
Methodology
Step 1 - Identification of Relevant Samples Size from Population Database


Step 2 - Approaches for Defining Global Market Size (Value, Volume* & Price*)

Note*: In applicable scenarios
Step 3 - Data Sources
Primary Research
- Web Analytics
- Survey Reports
- Research Institute
- Latest Research Reports
- Opinion Leaders
Secondary Research
- Annual Reports
- White Paper
- Latest Press Release
- Industry Association
- Paid Database
- Investor Presentations

Step 4 - Data Triangulation
Involves using different sources of information in order to increase the validity of a study
These sources are likely to be stakeholders in a program - participants, other researchers, program staff, other community members, and so on.
Then we put all data in single framework & apply various statistical tools to find out the dynamic on the market.
During the analysis stage, feedback from the stakeholder groups would be compared to determine areas of agreement as well as areas of divergence


