
Key Insights
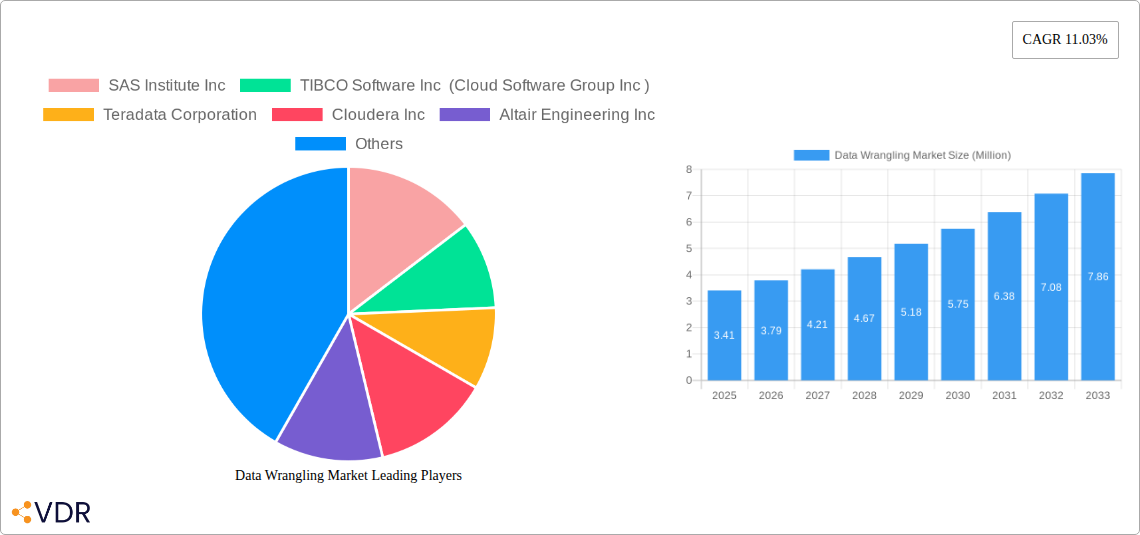
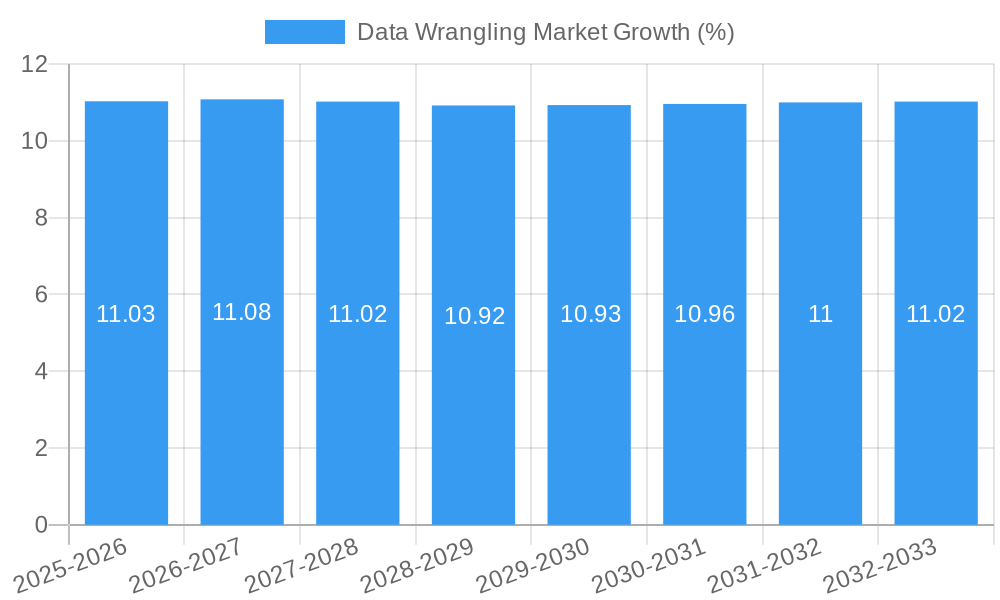
The global Data Wrangling market is poised for substantial expansion, projected to reach $3.41 billion in 2025 with an impressive Compound Annual Growth Rate (CAGR) of 11.03% through 2033. This robust growth is fueled by an increasing volume and complexity of data generated across industries, necessitating efficient data preparation for analytics, machine learning, and AI applications. Key drivers include the escalating demand for data-driven decision-making, the proliferation of big data technologies, and the growing need for data quality and governance. Organizations across sectors like IT and Telecommunication, Retail, Government, BFSI, and Healthcare are heavily investing in data wrangling solutions to extract meaningful insights and gain a competitive edge. The market is witnessing a significant shift towards cloud-based deployment models, offering scalability, flexibility, and cost-efficiency for businesses of all sizes.
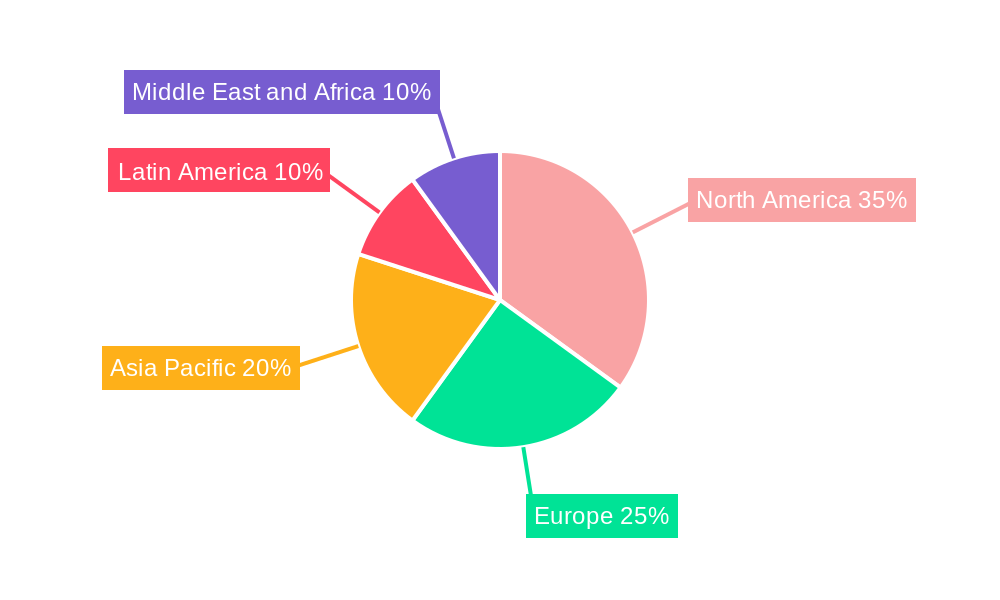
The data wrangling landscape is characterized by dynamic trends such as the rise of automated data preparation tools, the integration of AI and machine learning for intelligent data cleaning and transformation, and the increasing adoption of self-service data preparation platforms. These advancements empower a wider range of users, not just data scientists, to access and prepare data effectively. However, the market also faces certain restraints, including the complexity of integrating diverse data sources, the shortage of skilled data wrangling professionals, and concerns around data privacy and security. Despite these challenges, the strategic importance of clean, reliable data for business success ensures continued innovation and market growth. The market is segmented by components like Tools and Services, deployment options such as Cloud-Based and On-premises, catering to Small and Medium-Sized Enterprises (SMEs) and Large enterprises, and serving a broad spectrum of end-user industries. North America is expected to lead the market in terms of revenue, with Asia Pacific emerging as a significant growth region.
Data Wrangling Market: Unlocking Insights from Complex Data (2019-2033)
This comprehensive report provides an in-depth analysis of the global Data Wrangling Market, offering a detailed forecast and strategic insights for the period 2019–2033. With a base year of 2025 and a forecast period from 2025–2033, this study meticulously examines historical trends from 2019–2024, equipping industry professionals with the intelligence to navigate this rapidly evolving landscape.
The Data Wrangling Market is experiencing unprecedented growth driven by the explosion of big data and the critical need for clean, structured, and analysis-ready information across all sectors. This report delves into the intricate dynamics, growth trajectories, regional dominance, product innovations, key drivers, barriers, and emerging opportunities within this vital market segment.
Key segments analyzed include:
- Component: Tools, Service
- Deployment: Cloud-Based, On-premises
- Enterprise Type: Small and Medium Sized, Large
- End-user Industry: IT and Telecommunication, Retail, Government, BFSI, Healthcare, Other End-user Industries
With an estimated market value in millions of dollars for the base year 2025 and projections through 2033, this report is an indispensable resource for stakeholders seeking to capitalize on the transformative power of data.
Data Wrangling Market Market Dynamics & Structure
The Data Wrangling Market is characterized by a dynamic interplay of factors shaping its structure and future trajectory. Market concentration is moderately fragmented, with several key players vying for dominance, yet significant room exists for specialized solutions and emerging innovators. Technological innovation remains a primary driver, with advancements in AI, machine learning, and automated data cleaning techniques continuously enhancing efficiency and accuracy. Regulatory frameworks, particularly concerning data privacy and governance (e.g., GDPR, CCPA), are increasingly influencing data wrangling processes, demanding robust compliance features. Competitive product substitutes, such as advanced ETL (Extract, Transform, Load) tools and broader data integration platforms, offer alternative pathways for data preparation, necessitating continuous innovation in data wrangling solutions. End-user demographics are diverse, spanning from large enterprises with complex data needs to smaller organizations seeking cost-effective and user-friendly solutions. Mergers and acquisitions (M&A) trends are active, with companies seeking to expand their capabilities, market reach, and integrate complementary technologies, further shaping the competitive landscape.
- Market Concentration: Moderate fragmentation with room for specialized players.
- Technological Innovation: Driven by AI, ML, and automation in data cleaning.
- Regulatory Frameworks: Increasing impact of data privacy and governance standards.
- Competitive Substitutes: Advanced ETL, data integration platforms.
- End-user Demographics: Diverse, from large enterprises to SMEs.
- M&A Trends: Active, focused on capability expansion and integration.
Data Wrangling Market Growth Trends & Insights
The Data Wrangling Market is poised for substantial growth, fueled by the escalating volume, velocity, and variety of data generated globally. This market is evolving from a niche segment to a fundamental pillar of data-driven decision-making across all industries. The adoption rates of data wrangling tools and services are accelerating as organizations recognize the critical necessity of clean and structured data for accurate analytics, AI model training, and regulatory compliance. Technological disruptions, including the rise of no-code/low-code wrangling platforms and real-time data cleansing capabilities, are democratizing access to sophisticated data preparation functionalities, making them accessible to a broader range of users. Consumer behavior is shifting towards a greater demand for self-service data preparation, pushing vendors to develop intuitive and user-friendly interfaces.
The market size is projected to witness a significant expansion, driven by the increasing reliance on data for competitive advantage. CAGR for the forecast period is expected to be robust, reflecting the continuous demand for these essential data management solutions. Market penetration is increasing rapidly, particularly in sectors like BFSI, healthcare, and IT, where data accuracy is paramount for operational efficiency and strategic planning. The ongoing digital transformation initiatives across businesses worldwide necessitate efficient data handling, making data wrangling an indispensable component of modern data architectures. The ability of data wrangling solutions to reduce the time and effort spent on manual data preparation allows organizations to derive insights faster and make more agile, informed decisions. This enhanced agility translates into improved operational performance, better customer experiences, and the identification of new revenue streams. Furthermore, the growing adoption of cloud-based data wrangling services offers scalability, flexibility, and cost-effectiveness, further propelling market growth. The emphasis on data quality for AI and machine learning applications, in particular, acts as a significant catalyst, as the performance of these advanced technologies is directly contingent on the quality of the input data.
Dominant Regions, Countries, or Segments in Data Wrangling Market
North America currently stands as a dominant region in the Data Wrangling Market, driven by its robust technological infrastructure, high adoption rates of advanced analytics, and the presence of major technology companies. The United States, in particular, spearheads this dominance due to significant investments in data science, a mature market for cloud-based solutions, and a strong regulatory environment that emphasizes data integrity. Government initiatives supporting digital transformation and a large concentration of large enterprises across sectors like IT and Telecommunication, BFSI, and Healthcare contribute to the region's leading position.
Among the segments, Component: Tools is a significant growth driver. The development of sophisticated, AI-powered data wrangling tools that automate complex cleaning and transformation tasks is highly sought after. In terms of Deployment, Cloud-Based solutions are witnessing rapid adoption due to their scalability, cost-efficiency, and accessibility, particularly benefiting Small and Medium Sized enterprises. However, On-premises deployments remain crucial for organizations with stringent data security and sovereignty requirements.
Within End-user Industries, IT and Telecommunication is a leading segment, constantly dealing with massive datasets requiring meticulous wrangling for network optimization, customer analytics, and service improvement. The BFSI sector follows closely, requiring high data accuracy for risk assessment, fraud detection, and regulatory reporting. The Healthcare industry is also a major contributor, leveraging data wrangling for clinical research, patient care, and operational efficiency, albeit with stringent privacy considerations. The increasing volume of data generated by connected devices and digital services across all sectors further amplifies the demand for effective data wrangling solutions. The economic policies favoring innovation and digital adoption in these leading regions and countries, coupled with strong investments in R&D, solidify their dominance in the Data Wrangling Market.
Data Wrangling Market Product Landscape
The Data Wrangling Market product landscape is defined by continuous innovation aimed at simplifying and automating complex data preparation tasks. Leading products offer advanced functionalities such as intelligent data profiling, anomaly detection, data standardization, and schema mapping. AI and machine learning are increasingly integrated into these tools, enabling predictive wrangling suggestions and autonomous data cleaning. Many solutions now provide intuitive, visual interfaces and no-code/low-code capabilities, empowering business users with less technical expertise to prepare their own data. Performance metrics such as processing speed for large datasets, accuracy of transformations, and ease of integration with existing data ecosystems are key differentiators. The emphasis is on reducing manual effort, enhancing data quality, and accelerating the time-to-insight, with unique selling propositions often revolving around specialized wrangling for specific data types (e.g., unstructured text, geospatial data) or industry-specific compliance needs.
Key Drivers, Barriers & Challenges in Data Wrangling Market
Key Drivers:
- Explosion of Big Data: The ever-increasing volume, velocity, and variety of data generated necessitates efficient data preparation.
- Demand for Data-Driven Decision Making: Businesses across all sectors rely on accurate data for strategic insights and competitive advantage.
- Advancements in AI & Machine Learning: The need for clean, structured data to train accurate AI and ML models is a significant catalyst.
- Growing Adoption of Cloud Computing: Cloud-based data wrangling solutions offer scalability, flexibility, and cost-effectiveness.
- Regulatory Compliance: Stringent data privacy and governance regulations require robust data cleansing and preparation.
Barriers & Challenges:
- Data Silos and Heterogeneity: Integrating and wrangling data from disparate and incompatible sources remains a significant challenge.
- Talent Shortage: A lack of skilled data professionals capable of managing and utilizing advanced data wrangling tools.
- Cost of Implementation: Initial investment in software, hardware, and training can be a barrier for smaller organizations.
- Data Security and Privacy Concerns: Ensuring the security and privacy of sensitive data during the wrangling process.
- Resistance to Change: Overcoming organizational inertia and encouraging the adoption of new data management practices.
- Complexity of Data: Highly unstructured or complex data types can still pose significant wrangling challenges.
Emerging Opportunities in Data Wrangling Market
Emerging opportunities in the Data Wrangling Market lie in the development of highly specialized, industry-specific wrangling solutions that address unique data challenges within sectors like genomics, IoT, and financial risk management. The increasing demand for real-time data wrangling capabilities, enabling instant data preparation for immediate analytics and decision-making, presents a significant growth avenue. Furthermore, the integration of data wrangling with broader data governance and master data management platforms offers a holistic approach to data quality and compliance. The rise of edge computing and the need to wrangle data generated at the edge also opens up new possibilities for localized data preparation solutions. Finally, the continued focus on democratizing data science through user-friendly, AI-driven wrangling tools will unlock new markets and customer segments.
Growth Accelerators in the Data Wrangling Market Industry
Several catalysts are accelerating long-term growth in the Data Wrangling Market. Technological breakthroughs in areas like explainable AI for data transformations and automated data quality assessment are enhancing the reliability and trustworthiness of wrangling processes. Strategic partnerships between data wrangling vendors and cloud service providers, as well as data analytics platforms, are expanding market reach and offering integrated solutions. Market expansion strategies, including targeting underserved geographies and industries, are crucial. Furthermore, the growing awareness of data as a strategic asset and the increasing pressure to derive actionable insights are compelling organizations to invest heavily in robust data wrangling capabilities. The development of federated data wrangling approaches, which allow data to be processed and prepared in situ without moving it, is also a significant growth accelerator, addressing privacy and efficiency concerns.
Key Players Shaping the Data Wrangling Market Market
- SAS Institute Inc
- TIBCO Software Inc (Cloud Software Group Inc)
- Teradata Corporation
- Cloudera Inc
- Altair Engineering Inc
- Cambridge Semantics Inc
- Alteryx Inc
- Oracle Corporation
- DataRobot Inc
- Datameer Inc
Notable Milestones in Data Wrangling Market Sector
- May 2023: Adroit DI launched SDF Pro, a cloud-based application offering a cost-effective solution for storing, sorting, and Wrangling 10 million molecules within seconds. SDF Pro features a user-configurable interface accessible from login, enabling users to organize, structure, and store large data sets.
- May 2023: Qlik acquired Talend, enhancing its capabilities for modern enterprises to transform, access, trust, analyze, and act on data. This integration promises expanded product offerings, improved support, and enhanced R&D investments.
In-Depth Data Wrangling Market Market Outlook
The Data Wrangling Market is set for robust expansion, driven by the fundamental need for clean, analysis-ready data in an increasingly data-intensive world. Growth accelerators include ongoing advancements in AI and automation, which are making data wrangling more efficient and accessible. Strategic partnerships and market expansion into new industries and regions will further fuel this growth. The increasing recognition of data quality as a critical determinant of AI/ML success and regulatory compliance will continue to drive demand for sophisticated wrangling solutions. Future market potential is immense, with opportunities to develop specialized wrangling for emerging data types and to integrate wrangling seamlessly into end-to-end data management ecosystems. Organizations that prioritize investment in agile and intelligent data wrangling capabilities will be best positioned to unlock the full value of their data assets and gain a significant competitive edge.
Data Wrangling Market Segmentation
-
1. Component
- 1.1. Tools
- 1.2. Service
-
2. Deployment
- 2.1. Cloud-Based
- 2.2. On-premises
-
3. Enterprise Type
- 3.1. Small and Medium Sized
- 3.2. Large
-
4. End-user Industry
- 4.1. IT and Telecommunication
- 4.2. Retail
- 4.3. Government
- 4.4. BFSI
- 4.5. Healthcare
- 4.6. Other End-user Industries
Data Wrangling Market Segmentation By Geography
-
1. North America
- 1.1. United States
- 1.2. Canada
-
2. Europe
- 2.1. United Kingdom
- 2.2. Germany
- 2.3. France
- 2.4. Rest of Europe
-
3. Asia Pacific
- 3.1. China
- 3.2. Japan
- 3.3. Singapore
- 3.4. Rest of Asia Pacific
-
4. Latin America
- 4.1. Mexico
- 4.2. Brazil
- 4.3. Rest of Latin America
-
5. Middle East and Africa
- 5.1. United Arab Emirates
- 5.2. Saudi Arabia
- 5.3. Rest of Middle East
Data Wrangling Market REPORT HIGHLIGHTS
| Aspects | Details |
|---|---|
| Study Period | 2019-2033 |
| Base Year | 2024 |
| Estimated Year | 2025 |
| Forecast Period | 2025-2033 |
| Historical Period | 2019-2024 |
| Growth Rate | CAGR of 11.03% from 2019-2033 |
| Segmentation |
|
Table of Contents
- 1. Introduction
- 1.1. Research Scope
- 1.2. Market Segmentation
- 1.3. Research Methodology
- 1.4. Definitions and Assumptions
- 2. Executive Summary
- 2.1. Introduction
- 3. Market Dynamics
- 3.1. Introduction
- 3.2. Market Drivers
- 3.2.1. Growing Volumes of Data; Advancement in AI And Big Data Technologies; Growing Concern about Data Veracity
- 3.3. Market Restrains
- 3.3.1. Lack Of Awareness Of Data Wrangling Tools Among Enterprises; Explicit Data Access Permission
- 3.4. Market Trends
- 3.4.1. Large Enterprises are Analyzed to Hold Significant Market Share
- 4. Market Factor Analysis
- 4.1. Porters Five Forces
- 4.2. Supply/Value Chain
- 4.3. PESTEL analysis
- 4.4. Market Entropy
- 4.5. Patent/Trademark Analysis
- 5. Global Data Wrangling Market Analysis, Insights and Forecast, 2019-2031
- 5.1. Market Analysis, Insights and Forecast - by Component
- 5.1.1. Tools
- 5.1.2. Service
- 5.2. Market Analysis, Insights and Forecast - by Deployment
- 5.2.1. Cloud-Based
- 5.2.2. On-premises
- 5.3. Market Analysis, Insights and Forecast - by Enterprise Type
- 5.3.1. Small and Medium Sized
- 5.3.2. Large
- 5.4. Market Analysis, Insights and Forecast - by End-user Industry
- 5.4.1. IT and Telecommunication
- 5.4.2. Retail
- 5.4.3. Government
- 5.4.4. BFSI
- 5.4.5. Healthcare
- 5.4.6. Other End-user Industries
- 5.5. Market Analysis, Insights and Forecast - by Region
- 5.5.1. North America
- 5.5.2. Europe
- 5.5.3. Asia Pacific
- 5.5.4. Latin America
- 5.5.5. Middle East and Africa
- 5.1. Market Analysis, Insights and Forecast - by Component
- 6. North America Data Wrangling Market Analysis, Insights and Forecast, 2019-2031
- 6.1. Market Analysis, Insights and Forecast - by Component
- 6.1.1. Tools
- 6.1.2. Service
- 6.2. Market Analysis, Insights and Forecast - by Deployment
- 6.2.1. Cloud-Based
- 6.2.2. On-premises
- 6.3. Market Analysis, Insights and Forecast - by Enterprise Type
- 6.3.1. Small and Medium Sized
- 6.3.2. Large
- 6.4. Market Analysis, Insights and Forecast - by End-user Industry
- 6.4.1. IT and Telecommunication
- 6.4.2. Retail
- 6.4.3. Government
- 6.4.4. BFSI
- 6.4.5. Healthcare
- 6.4.6. Other End-user Industries
- 6.1. Market Analysis, Insights and Forecast - by Component
- 7. Europe Data Wrangling Market Analysis, Insights and Forecast, 2019-2031
- 7.1. Market Analysis, Insights and Forecast - by Component
- 7.1.1. Tools
- 7.1.2. Service
- 7.2. Market Analysis, Insights and Forecast - by Deployment
- 7.2.1. Cloud-Based
- 7.2.2. On-premises
- 7.3. Market Analysis, Insights and Forecast - by Enterprise Type
- 7.3.1. Small and Medium Sized
- 7.3.2. Large
- 7.4. Market Analysis, Insights and Forecast - by End-user Industry
- 7.4.1. IT and Telecommunication
- 7.4.2. Retail
- 7.4.3. Government
- 7.4.4. BFSI
- 7.4.5. Healthcare
- 7.4.6. Other End-user Industries
- 7.1. Market Analysis, Insights and Forecast - by Component
- 8. Asia Pacific Data Wrangling Market Analysis, Insights and Forecast, 2019-2031
- 8.1. Market Analysis, Insights and Forecast - by Component
- 8.1.1. Tools
- 8.1.2. Service
- 8.2. Market Analysis, Insights and Forecast - by Deployment
- 8.2.1. Cloud-Based
- 8.2.2. On-premises
- 8.3. Market Analysis, Insights and Forecast - by Enterprise Type
- 8.3.1. Small and Medium Sized
- 8.3.2. Large
- 8.4. Market Analysis, Insights and Forecast - by End-user Industry
- 8.4.1. IT and Telecommunication
- 8.4.2. Retail
- 8.4.3. Government
- 8.4.4. BFSI
- 8.4.5. Healthcare
- 8.4.6. Other End-user Industries
- 8.1. Market Analysis, Insights and Forecast - by Component
- 9. Latin America Data Wrangling Market Analysis, Insights and Forecast, 2019-2031
- 9.1. Market Analysis, Insights and Forecast - by Component
- 9.1.1. Tools
- 9.1.2. Service
- 9.2. Market Analysis, Insights and Forecast - by Deployment
- 9.2.1. Cloud-Based
- 9.2.2. On-premises
- 9.3. Market Analysis, Insights and Forecast - by Enterprise Type
- 9.3.1. Small and Medium Sized
- 9.3.2. Large
- 9.4. Market Analysis, Insights and Forecast - by End-user Industry
- 9.4.1. IT and Telecommunication
- 9.4.2. Retail
- 9.4.3. Government
- 9.4.4. BFSI
- 9.4.5. Healthcare
- 9.4.6. Other End-user Industries
- 9.1. Market Analysis, Insights and Forecast - by Component
- 10. Middle East and Africa Data Wrangling Market Analysis, Insights and Forecast, 2019-2031
- 10.1. Market Analysis, Insights and Forecast - by Component
- 10.1.1. Tools
- 10.1.2. Service
- 10.2. Market Analysis, Insights and Forecast - by Deployment
- 10.2.1. Cloud-Based
- 10.2.2. On-premises
- 10.3. Market Analysis, Insights and Forecast - by Enterprise Type
- 10.3.1. Small and Medium Sized
- 10.3.2. Large
- 10.4. Market Analysis, Insights and Forecast - by End-user Industry
- 10.4.1. IT and Telecommunication
- 10.4.2. Retail
- 10.4.3. Government
- 10.4.4. BFSI
- 10.4.5. Healthcare
- 10.4.6. Other End-user Industries
- 10.1. Market Analysis, Insights and Forecast - by Component
- 11. North America Data Wrangling Market Analysis, Insights and Forecast, 2019-2031
- 11.1. Market Analysis, Insights and Forecast - By Country/Sub-region
- 11.1.1 United States
- 11.1.2 Canada
- 11.1.3 Mexico
- 12. Europe Data Wrangling Market Analysis, Insights and Forecast, 2019-2031
- 12.1. Market Analysis, Insights and Forecast - By Country/Sub-region
- 12.1.1 Germany
- 12.1.2 United Kingdom
- 12.1.3 France
- 12.1.4 Spain
- 12.1.5 Italy
- 12.1.6 Spain
- 12.1.7 Belgium
- 12.1.8 Netherland
- 12.1.9 Nordics
- 12.1.10 Rest of Europe
- 13. Asia Pacific Data Wrangling Market Analysis, Insights and Forecast, 2019-2031
- 13.1. Market Analysis, Insights and Forecast - By Country/Sub-region
- 13.1.1 China
- 13.1.2 Japan
- 13.1.3 India
- 13.1.4 South Korea
- 13.1.5 Southeast Asia
- 13.1.6 Australia
- 13.1.7 Indonesia
- 13.1.8 Phillipes
- 13.1.9 Singapore
- 13.1.10 Thailandc
- 13.1.11 Rest of Asia Pacific
- 14. South America Data Wrangling Market Analysis, Insights and Forecast, 2019-2031
- 14.1. Market Analysis, Insights and Forecast - By Country/Sub-region
- 14.1.1 Brazil
- 14.1.2 Argentina
- 14.1.3 Peru
- 14.1.4 Chile
- 14.1.5 Colombia
- 14.1.6 Ecuador
- 14.1.7 Venezuela
- 14.1.8 Rest of South America
- 15. North America Data Wrangling Market Analysis, Insights and Forecast, 2019-2031
- 15.1. Market Analysis, Insights and Forecast - By Country/Sub-region
- 15.1.1 United States
- 15.1.2 Canada
- 15.1.3 Mexico
- 16. MEA Data Wrangling Market Analysis, Insights and Forecast, 2019-2031
- 16.1. Market Analysis, Insights and Forecast - By Country/Sub-region
- 16.1.1 United Arab Emirates
- 16.1.2 Saudi Arabia
- 16.1.3 South Africa
- 16.1.4 Rest of Middle East and Africa
- 17. Competitive Analysis
- 17.1. Global Market Share Analysis 2024
- 17.2. Company Profiles
- 17.2.1 SAS Institute Inc
- 17.2.1.1. Overview
- 17.2.1.2. Products
- 17.2.1.3. SWOT Analysis
- 17.2.1.4. Recent Developments
- 17.2.1.5. Financials (Based on Availability)
- 17.2.2 TIBCO Software Inc (Cloud Software Group Inc )
- 17.2.2.1. Overview
- 17.2.2.2. Products
- 17.2.2.3. SWOT Analysis
- 17.2.2.4. Recent Developments
- 17.2.2.5. Financials (Based on Availability)
- 17.2.3 Teradata Corporation
- 17.2.3.1. Overview
- 17.2.3.2. Products
- 17.2.3.3. SWOT Analysis
- 17.2.3.4. Recent Developments
- 17.2.3.5. Financials (Based on Availability)
- 17.2.4 Cloudera Inc
- 17.2.4.1. Overview
- 17.2.4.2. Products
- 17.2.4.3. SWOT Analysis
- 17.2.4.4. Recent Developments
- 17.2.4.5. Financials (Based on Availability)
- 17.2.5 Altair Engineering Inc
- 17.2.5.1. Overview
- 17.2.5.2. Products
- 17.2.5.3. SWOT Analysis
- 17.2.5.4. Recent Developments
- 17.2.5.5. Financials (Based on Availability)
- 17.2.6 Cambridge Semantics Inc
- 17.2.6.1. Overview
- 17.2.6.2. Products
- 17.2.6.3. SWOT Analysis
- 17.2.6.4. Recent Developments
- 17.2.6.5. Financials (Based on Availability)
- 17.2.7 Alteryx Inc
- 17.2.7.1. Overview
- 17.2.7.2. Products
- 17.2.7.3. SWOT Analysis
- 17.2.7.4. Recent Developments
- 17.2.7.5. Financials (Based on Availability)
- 17.2.8 Oracle Corporation
- 17.2.8.1. Overview
- 17.2.8.2. Products
- 17.2.8.3. SWOT Analysis
- 17.2.8.4. Recent Developments
- 17.2.8.5. Financials (Based on Availability)
- 17.2.9 DataRobot Inc
- 17.2.9.1. Overview
- 17.2.9.2. Products
- 17.2.9.3. SWOT Analysis
- 17.2.9.4. Recent Developments
- 17.2.9.5. Financials (Based on Availability)
- 17.2.10 Datameer Inc
- 17.2.10.1. Overview
- 17.2.10.2. Products
- 17.2.10.3. SWOT Analysis
- 17.2.10.4. Recent Developments
- 17.2.10.5. Financials (Based on Availability)
- 17.2.1 SAS Institute Inc
List of Figures
- Figure 1: Global Data Wrangling Market Revenue Breakdown (Million, %) by Region 2024 & 2032
- Figure 2: Global Data Wrangling Market Volume Breakdown (K Unit, %) by Region 2024 & 2032
- Figure 3: North America Data Wrangling Market Revenue (Million), by Country 2024 & 2032
- Figure 4: North America Data Wrangling Market Volume (K Unit), by Country 2024 & 2032
- Figure 5: North America Data Wrangling Market Revenue Share (%), by Country 2024 & 2032
- Figure 6: North America Data Wrangling Market Volume Share (%), by Country 2024 & 2032
- Figure 7: Europe Data Wrangling Market Revenue (Million), by Country 2024 & 2032
- Figure 8: Europe Data Wrangling Market Volume (K Unit), by Country 2024 & 2032
- Figure 9: Europe Data Wrangling Market Revenue Share (%), by Country 2024 & 2032
- Figure 10: Europe Data Wrangling Market Volume Share (%), by Country 2024 & 2032
- Figure 11: Asia Pacific Data Wrangling Market Revenue (Million), by Country 2024 & 2032
- Figure 12: Asia Pacific Data Wrangling Market Volume (K Unit), by Country 2024 & 2032
- Figure 13: Asia Pacific Data Wrangling Market Revenue Share (%), by Country 2024 & 2032
- Figure 14: Asia Pacific Data Wrangling Market Volume Share (%), by Country 2024 & 2032
- Figure 15: South America Data Wrangling Market Revenue (Million), by Country 2024 & 2032
- Figure 16: South America Data Wrangling Market Volume (K Unit), by Country 2024 & 2032
- Figure 17: South America Data Wrangling Market Revenue Share (%), by Country 2024 & 2032
- Figure 18: South America Data Wrangling Market Volume Share (%), by Country 2024 & 2032
- Figure 19: North America Data Wrangling Market Revenue (Million), by Country 2024 & 2032
- Figure 20: North America Data Wrangling Market Volume (K Unit), by Country 2024 & 2032
- Figure 21: North America Data Wrangling Market Revenue Share (%), by Country 2024 & 2032
- Figure 22: North America Data Wrangling Market Volume Share (%), by Country 2024 & 2032
- Figure 23: MEA Data Wrangling Market Revenue (Million), by Country 2024 & 2032
- Figure 24: MEA Data Wrangling Market Volume (K Unit), by Country 2024 & 2032
- Figure 25: MEA Data Wrangling Market Revenue Share (%), by Country 2024 & 2032
- Figure 26: MEA Data Wrangling Market Volume Share (%), by Country 2024 & 2032
- Figure 27: North America Data Wrangling Market Revenue (Million), by Component 2024 & 2032
- Figure 28: North America Data Wrangling Market Volume (K Unit), by Component 2024 & 2032
- Figure 29: North America Data Wrangling Market Revenue Share (%), by Component 2024 & 2032
- Figure 30: North America Data Wrangling Market Volume Share (%), by Component 2024 & 2032
- Figure 31: North America Data Wrangling Market Revenue (Million), by Deployment 2024 & 2032
- Figure 32: North America Data Wrangling Market Volume (K Unit), by Deployment 2024 & 2032
- Figure 33: North America Data Wrangling Market Revenue Share (%), by Deployment 2024 & 2032
- Figure 34: North America Data Wrangling Market Volume Share (%), by Deployment 2024 & 2032
- Figure 35: North America Data Wrangling Market Revenue (Million), by Enterprise Type 2024 & 2032
- Figure 36: North America Data Wrangling Market Volume (K Unit), by Enterprise Type 2024 & 2032
- Figure 37: North America Data Wrangling Market Revenue Share (%), by Enterprise Type 2024 & 2032
- Figure 38: North America Data Wrangling Market Volume Share (%), by Enterprise Type 2024 & 2032
- Figure 39: North America Data Wrangling Market Revenue (Million), by End-user Industry 2024 & 2032
- Figure 40: North America Data Wrangling Market Volume (K Unit), by End-user Industry 2024 & 2032
- Figure 41: North America Data Wrangling Market Revenue Share (%), by End-user Industry 2024 & 2032
- Figure 42: North America Data Wrangling Market Volume Share (%), by End-user Industry 2024 & 2032
- Figure 43: North America Data Wrangling Market Revenue (Million), by Country 2024 & 2032
- Figure 44: North America Data Wrangling Market Volume (K Unit), by Country 2024 & 2032
- Figure 45: North America Data Wrangling Market Revenue Share (%), by Country 2024 & 2032
- Figure 46: North America Data Wrangling Market Volume Share (%), by Country 2024 & 2032
- Figure 47: Europe Data Wrangling Market Revenue (Million), by Component 2024 & 2032
- Figure 48: Europe Data Wrangling Market Volume (K Unit), by Component 2024 & 2032
- Figure 49: Europe Data Wrangling Market Revenue Share (%), by Component 2024 & 2032
- Figure 50: Europe Data Wrangling Market Volume Share (%), by Component 2024 & 2032
- Figure 51: Europe Data Wrangling Market Revenue (Million), by Deployment 2024 & 2032
- Figure 52: Europe Data Wrangling Market Volume (K Unit), by Deployment 2024 & 2032
- Figure 53: Europe Data Wrangling Market Revenue Share (%), by Deployment 2024 & 2032
- Figure 54: Europe Data Wrangling Market Volume Share (%), by Deployment 2024 & 2032
- Figure 55: Europe Data Wrangling Market Revenue (Million), by Enterprise Type 2024 & 2032
- Figure 56: Europe Data Wrangling Market Volume (K Unit), by Enterprise Type 2024 & 2032
- Figure 57: Europe Data Wrangling Market Revenue Share (%), by Enterprise Type 2024 & 2032
- Figure 58: Europe Data Wrangling Market Volume Share (%), by Enterprise Type 2024 & 2032
- Figure 59: Europe Data Wrangling Market Revenue (Million), by End-user Industry 2024 & 2032
- Figure 60: Europe Data Wrangling Market Volume (K Unit), by End-user Industry 2024 & 2032
- Figure 61: Europe Data Wrangling Market Revenue Share (%), by End-user Industry 2024 & 2032
- Figure 62: Europe Data Wrangling Market Volume Share (%), by End-user Industry 2024 & 2032
- Figure 63: Europe Data Wrangling Market Revenue (Million), by Country 2024 & 2032
- Figure 64: Europe Data Wrangling Market Volume (K Unit), by Country 2024 & 2032
- Figure 65: Europe Data Wrangling Market Revenue Share (%), by Country 2024 & 2032
- Figure 66: Europe Data Wrangling Market Volume Share (%), by Country 2024 & 2032
- Figure 67: Asia Pacific Data Wrangling Market Revenue (Million), by Component 2024 & 2032
- Figure 68: Asia Pacific Data Wrangling Market Volume (K Unit), by Component 2024 & 2032
- Figure 69: Asia Pacific Data Wrangling Market Revenue Share (%), by Component 2024 & 2032
- Figure 70: Asia Pacific Data Wrangling Market Volume Share (%), by Component 2024 & 2032
- Figure 71: Asia Pacific Data Wrangling Market Revenue (Million), by Deployment 2024 & 2032
- Figure 72: Asia Pacific Data Wrangling Market Volume (K Unit), by Deployment 2024 & 2032
- Figure 73: Asia Pacific Data Wrangling Market Revenue Share (%), by Deployment 2024 & 2032
- Figure 74: Asia Pacific Data Wrangling Market Volume Share (%), by Deployment 2024 & 2032
- Figure 75: Asia Pacific Data Wrangling Market Revenue (Million), by Enterprise Type 2024 & 2032
- Figure 76: Asia Pacific Data Wrangling Market Volume (K Unit), by Enterprise Type 2024 & 2032
- Figure 77: Asia Pacific Data Wrangling Market Revenue Share (%), by Enterprise Type 2024 & 2032
- Figure 78: Asia Pacific Data Wrangling Market Volume Share (%), by Enterprise Type 2024 & 2032
- Figure 79: Asia Pacific Data Wrangling Market Revenue (Million), by End-user Industry 2024 & 2032
- Figure 80: Asia Pacific Data Wrangling Market Volume (K Unit), by End-user Industry 2024 & 2032
- Figure 81: Asia Pacific Data Wrangling Market Revenue Share (%), by End-user Industry 2024 & 2032
- Figure 82: Asia Pacific Data Wrangling Market Volume Share (%), by End-user Industry 2024 & 2032
- Figure 83: Asia Pacific Data Wrangling Market Revenue (Million), by Country 2024 & 2032
- Figure 84: Asia Pacific Data Wrangling Market Volume (K Unit), by Country 2024 & 2032
- Figure 85: Asia Pacific Data Wrangling Market Revenue Share (%), by Country 2024 & 2032
- Figure 86: Asia Pacific Data Wrangling Market Volume Share (%), by Country 2024 & 2032
- Figure 87: Latin America Data Wrangling Market Revenue (Million), by Component 2024 & 2032
- Figure 88: Latin America Data Wrangling Market Volume (K Unit), by Component 2024 & 2032
- Figure 89: Latin America Data Wrangling Market Revenue Share (%), by Component 2024 & 2032
- Figure 90: Latin America Data Wrangling Market Volume Share (%), by Component 2024 & 2032
- Figure 91: Latin America Data Wrangling Market Revenue (Million), by Deployment 2024 & 2032
- Figure 92: Latin America Data Wrangling Market Volume (K Unit), by Deployment 2024 & 2032
- Figure 93: Latin America Data Wrangling Market Revenue Share (%), by Deployment 2024 & 2032
- Figure 94: Latin America Data Wrangling Market Volume Share (%), by Deployment 2024 & 2032
- Figure 95: Latin America Data Wrangling Market Revenue (Million), by Enterprise Type 2024 & 2032
- Figure 96: Latin America Data Wrangling Market Volume (K Unit), by Enterprise Type 2024 & 2032
- Figure 97: Latin America Data Wrangling Market Revenue Share (%), by Enterprise Type 2024 & 2032
- Figure 98: Latin America Data Wrangling Market Volume Share (%), by Enterprise Type 2024 & 2032
- Figure 99: Latin America Data Wrangling Market Revenue (Million), by End-user Industry 2024 & 2032
- Figure 100: Latin America Data Wrangling Market Volume (K Unit), by End-user Industry 2024 & 2032
- Figure 101: Latin America Data Wrangling Market Revenue Share (%), by End-user Industry 2024 & 2032
- Figure 102: Latin America Data Wrangling Market Volume Share (%), by End-user Industry 2024 & 2032
- Figure 103: Latin America Data Wrangling Market Revenue (Million), by Country 2024 & 2032
- Figure 104: Latin America Data Wrangling Market Volume (K Unit), by Country 2024 & 2032
- Figure 105: Latin America Data Wrangling Market Revenue Share (%), by Country 2024 & 2032
- Figure 106: Latin America Data Wrangling Market Volume Share (%), by Country 2024 & 2032
- Figure 107: Middle East and Africa Data Wrangling Market Revenue (Million), by Component 2024 & 2032
- Figure 108: Middle East and Africa Data Wrangling Market Volume (K Unit), by Component 2024 & 2032
- Figure 109: Middle East and Africa Data Wrangling Market Revenue Share (%), by Component 2024 & 2032
- Figure 110: Middle East and Africa Data Wrangling Market Volume Share (%), by Component 2024 & 2032
- Figure 111: Middle East and Africa Data Wrangling Market Revenue (Million), by Deployment 2024 & 2032
- Figure 112: Middle East and Africa Data Wrangling Market Volume (K Unit), by Deployment 2024 & 2032
- Figure 113: Middle East and Africa Data Wrangling Market Revenue Share (%), by Deployment 2024 & 2032
- Figure 114: Middle East and Africa Data Wrangling Market Volume Share (%), by Deployment 2024 & 2032
- Figure 115: Middle East and Africa Data Wrangling Market Revenue (Million), by Enterprise Type 2024 & 2032
- Figure 116: Middle East and Africa Data Wrangling Market Volume (K Unit), by Enterprise Type 2024 & 2032
- Figure 117: Middle East and Africa Data Wrangling Market Revenue Share (%), by Enterprise Type 2024 & 2032
- Figure 118: Middle East and Africa Data Wrangling Market Volume Share (%), by Enterprise Type 2024 & 2032
- Figure 119: Middle East and Africa Data Wrangling Market Revenue (Million), by End-user Industry 2024 & 2032
- Figure 120: Middle East and Africa Data Wrangling Market Volume (K Unit), by End-user Industry 2024 & 2032
- Figure 121: Middle East and Africa Data Wrangling Market Revenue Share (%), by End-user Industry 2024 & 2032
- Figure 122: Middle East and Africa Data Wrangling Market Volume Share (%), by End-user Industry 2024 & 2032
- Figure 123: Middle East and Africa Data Wrangling Market Revenue (Million), by Country 2024 & 2032
- Figure 124: Middle East and Africa Data Wrangling Market Volume (K Unit), by Country 2024 & 2032
- Figure 125: Middle East and Africa Data Wrangling Market Revenue Share (%), by Country 2024 & 2032
- Figure 126: Middle East and Africa Data Wrangling Market Volume Share (%), by Country 2024 & 2032
List of Tables
- Table 1: Global Data Wrangling Market Revenue Million Forecast, by Region 2019 & 2032
- Table 2: Global Data Wrangling Market Volume K Unit Forecast, by Region 2019 & 2032
- Table 3: Global Data Wrangling Market Revenue Million Forecast, by Component 2019 & 2032
- Table 4: Global Data Wrangling Market Volume K Unit Forecast, by Component 2019 & 2032
- Table 5: Global Data Wrangling Market Revenue Million Forecast, by Deployment 2019 & 2032
- Table 6: Global Data Wrangling Market Volume K Unit Forecast, by Deployment 2019 & 2032
- Table 7: Global Data Wrangling Market Revenue Million Forecast, by Enterprise Type 2019 & 2032
- Table 8: Global Data Wrangling Market Volume K Unit Forecast, by Enterprise Type 2019 & 2032
- Table 9: Global Data Wrangling Market Revenue Million Forecast, by End-user Industry 2019 & 2032
- Table 10: Global Data Wrangling Market Volume K Unit Forecast, by End-user Industry 2019 & 2032
- Table 11: Global Data Wrangling Market Revenue Million Forecast, by Region 2019 & 2032
- Table 12: Global Data Wrangling Market Volume K Unit Forecast, by Region 2019 & 2032
- Table 13: Global Data Wrangling Market Revenue Million Forecast, by Country 2019 & 2032
- Table 14: Global Data Wrangling Market Volume K Unit Forecast, by Country 2019 & 2032
- Table 15: United States Data Wrangling Market Revenue (Million) Forecast, by Application 2019 & 2032
- Table 16: United States Data Wrangling Market Volume (K Unit) Forecast, by Application 2019 & 2032
- Table 17: Canada Data Wrangling Market Revenue (Million) Forecast, by Application 2019 & 2032
- Table 18: Canada Data Wrangling Market Volume (K Unit) Forecast, by Application 2019 & 2032
- Table 19: Mexico Data Wrangling Market Revenue (Million) Forecast, by Application 2019 & 2032
- Table 20: Mexico Data Wrangling Market Volume (K Unit) Forecast, by Application 2019 & 2032
- Table 21: Global Data Wrangling Market Revenue Million Forecast, by Country 2019 & 2032
- Table 22: Global Data Wrangling Market Volume K Unit Forecast, by Country 2019 & 2032
- Table 23: Germany Data Wrangling Market Revenue (Million) Forecast, by Application 2019 & 2032
- Table 24: Germany Data Wrangling Market Volume (K Unit) Forecast, by Application 2019 & 2032
- Table 25: United Kingdom Data Wrangling Market Revenue (Million) Forecast, by Application 2019 & 2032
- Table 26: United Kingdom Data Wrangling Market Volume (K Unit) Forecast, by Application 2019 & 2032
- Table 27: France Data Wrangling Market Revenue (Million) Forecast, by Application 2019 & 2032
- Table 28: France Data Wrangling Market Volume (K Unit) Forecast, by Application 2019 & 2032
- Table 29: Spain Data Wrangling Market Revenue (Million) Forecast, by Application 2019 & 2032
- Table 30: Spain Data Wrangling Market Volume (K Unit) Forecast, by Application 2019 & 2032
- Table 31: Italy Data Wrangling Market Revenue (Million) Forecast, by Application 2019 & 2032
- Table 32: Italy Data Wrangling Market Volume (K Unit) Forecast, by Application 2019 & 2032
- Table 33: Spain Data Wrangling Market Revenue (Million) Forecast, by Application 2019 & 2032
- Table 34: Spain Data Wrangling Market Volume (K Unit) Forecast, by Application 2019 & 2032
- Table 35: Belgium Data Wrangling Market Revenue (Million) Forecast, by Application 2019 & 2032
- Table 36: Belgium Data Wrangling Market Volume (K Unit) Forecast, by Application 2019 & 2032
- Table 37: Netherland Data Wrangling Market Revenue (Million) Forecast, by Application 2019 & 2032
- Table 38: Netherland Data Wrangling Market Volume (K Unit) Forecast, by Application 2019 & 2032
- Table 39: Nordics Data Wrangling Market Revenue (Million) Forecast, by Application 2019 & 2032
- Table 40: Nordics Data Wrangling Market Volume (K Unit) Forecast, by Application 2019 & 2032
- Table 41: Rest of Europe Data Wrangling Market Revenue (Million) Forecast, by Application 2019 & 2032
- Table 42: Rest of Europe Data Wrangling Market Volume (K Unit) Forecast, by Application 2019 & 2032
- Table 43: Global Data Wrangling Market Revenue Million Forecast, by Country 2019 & 2032
- Table 44: Global Data Wrangling Market Volume K Unit Forecast, by Country 2019 & 2032
- Table 45: China Data Wrangling Market Revenue (Million) Forecast, by Application 2019 & 2032
- Table 46: China Data Wrangling Market Volume (K Unit) Forecast, by Application 2019 & 2032
- Table 47: Japan Data Wrangling Market Revenue (Million) Forecast, by Application 2019 & 2032
- Table 48: Japan Data Wrangling Market Volume (K Unit) Forecast, by Application 2019 & 2032
- Table 49: India Data Wrangling Market Revenue (Million) Forecast, by Application 2019 & 2032
- Table 50: India Data Wrangling Market Volume (K Unit) Forecast, by Application 2019 & 2032
- Table 51: South Korea Data Wrangling Market Revenue (Million) Forecast, by Application 2019 & 2032
- Table 52: South Korea Data Wrangling Market Volume (K Unit) Forecast, by Application 2019 & 2032
- Table 53: Southeast Asia Data Wrangling Market Revenue (Million) Forecast, by Application 2019 & 2032
- Table 54: Southeast Asia Data Wrangling Market Volume (K Unit) Forecast, by Application 2019 & 2032
- Table 55: Australia Data Wrangling Market Revenue (Million) Forecast, by Application 2019 & 2032
- Table 56: Australia Data Wrangling Market Volume (K Unit) Forecast, by Application 2019 & 2032
- Table 57: Indonesia Data Wrangling Market Revenue (Million) Forecast, by Application 2019 & 2032
- Table 58: Indonesia Data Wrangling Market Volume (K Unit) Forecast, by Application 2019 & 2032
- Table 59: Phillipes Data Wrangling Market Revenue (Million) Forecast, by Application 2019 & 2032
- Table 60: Phillipes Data Wrangling Market Volume (K Unit) Forecast, by Application 2019 & 2032
- Table 61: Singapore Data Wrangling Market Revenue (Million) Forecast, by Application 2019 & 2032
- Table 62: Singapore Data Wrangling Market Volume (K Unit) Forecast, by Application 2019 & 2032
- Table 63: Thailandc Data Wrangling Market Revenue (Million) Forecast, by Application 2019 & 2032
- Table 64: Thailandc Data Wrangling Market Volume (K Unit) Forecast, by Application 2019 & 2032
- Table 65: Rest of Asia Pacific Data Wrangling Market Revenue (Million) Forecast, by Application 2019 & 2032
- Table 66: Rest of Asia Pacific Data Wrangling Market Volume (K Unit) Forecast, by Application 2019 & 2032
- Table 67: Global Data Wrangling Market Revenue Million Forecast, by Country 2019 & 2032
- Table 68: Global Data Wrangling Market Volume K Unit Forecast, by Country 2019 & 2032
- Table 69: Brazil Data Wrangling Market Revenue (Million) Forecast, by Application 2019 & 2032
- Table 70: Brazil Data Wrangling Market Volume (K Unit) Forecast, by Application 2019 & 2032
- Table 71: Argentina Data Wrangling Market Revenue (Million) Forecast, by Application 2019 & 2032
- Table 72: Argentina Data Wrangling Market Volume (K Unit) Forecast, by Application 2019 & 2032
- Table 73: Peru Data Wrangling Market Revenue (Million) Forecast, by Application 2019 & 2032
- Table 74: Peru Data Wrangling Market Volume (K Unit) Forecast, by Application 2019 & 2032
- Table 75: Chile Data Wrangling Market Revenue (Million) Forecast, by Application 2019 & 2032
- Table 76: Chile Data Wrangling Market Volume (K Unit) Forecast, by Application 2019 & 2032
- Table 77: Colombia Data Wrangling Market Revenue (Million) Forecast, by Application 2019 & 2032
- Table 78: Colombia Data Wrangling Market Volume (K Unit) Forecast, by Application 2019 & 2032
- Table 79: Ecuador Data Wrangling Market Revenue (Million) Forecast, by Application 2019 & 2032
- Table 80: Ecuador Data Wrangling Market Volume (K Unit) Forecast, by Application 2019 & 2032
- Table 81: Venezuela Data Wrangling Market Revenue (Million) Forecast, by Application 2019 & 2032
- Table 82: Venezuela Data Wrangling Market Volume (K Unit) Forecast, by Application 2019 & 2032
- Table 83: Rest of South America Data Wrangling Market Revenue (Million) Forecast, by Application 2019 & 2032
- Table 84: Rest of South America Data Wrangling Market Volume (K Unit) Forecast, by Application 2019 & 2032
- Table 85: Global Data Wrangling Market Revenue Million Forecast, by Country 2019 & 2032
- Table 86: Global Data Wrangling Market Volume K Unit Forecast, by Country 2019 & 2032
- Table 87: United States Data Wrangling Market Revenue (Million) Forecast, by Application 2019 & 2032
- Table 88: United States Data Wrangling Market Volume (K Unit) Forecast, by Application 2019 & 2032
- Table 89: Canada Data Wrangling Market Revenue (Million) Forecast, by Application 2019 & 2032
- Table 90: Canada Data Wrangling Market Volume (K Unit) Forecast, by Application 2019 & 2032
- Table 91: Mexico Data Wrangling Market Revenue (Million) Forecast, by Application 2019 & 2032
- Table 92: Mexico Data Wrangling Market Volume (K Unit) Forecast, by Application 2019 & 2032
- Table 93: Global Data Wrangling Market Revenue Million Forecast, by Country 2019 & 2032
- Table 94: Global Data Wrangling Market Volume K Unit Forecast, by Country 2019 & 2032
- Table 95: United Arab Emirates Data Wrangling Market Revenue (Million) Forecast, by Application 2019 & 2032
- Table 96: United Arab Emirates Data Wrangling Market Volume (K Unit) Forecast, by Application 2019 & 2032
- Table 97: Saudi Arabia Data Wrangling Market Revenue (Million) Forecast, by Application 2019 & 2032
- Table 98: Saudi Arabia Data Wrangling Market Volume (K Unit) Forecast, by Application 2019 & 2032
- Table 99: South Africa Data Wrangling Market Revenue (Million) Forecast, by Application 2019 & 2032
- Table 100: South Africa Data Wrangling Market Volume (K Unit) Forecast, by Application 2019 & 2032
- Table 101: Rest of Middle East and Africa Data Wrangling Market Revenue (Million) Forecast, by Application 2019 & 2032
- Table 102: Rest of Middle East and Africa Data Wrangling Market Volume (K Unit) Forecast, by Application 2019 & 2032
- Table 103: Global Data Wrangling Market Revenue Million Forecast, by Component 2019 & 2032
- Table 104: Global Data Wrangling Market Volume K Unit Forecast, by Component 2019 & 2032
- Table 105: Global Data Wrangling Market Revenue Million Forecast, by Deployment 2019 & 2032
- Table 106: Global Data Wrangling Market Volume K Unit Forecast, by Deployment 2019 & 2032
- Table 107: Global Data Wrangling Market Revenue Million Forecast, by Enterprise Type 2019 & 2032
- Table 108: Global Data Wrangling Market Volume K Unit Forecast, by Enterprise Type 2019 & 2032
- Table 109: Global Data Wrangling Market Revenue Million Forecast, by End-user Industry 2019 & 2032
- Table 110: Global Data Wrangling Market Volume K Unit Forecast, by End-user Industry 2019 & 2032
- Table 111: Global Data Wrangling Market Revenue Million Forecast, by Country 2019 & 2032
- Table 112: Global Data Wrangling Market Volume K Unit Forecast, by Country 2019 & 2032
- Table 113: United States Data Wrangling Market Revenue (Million) Forecast, by Application 2019 & 2032
- Table 114: United States Data Wrangling Market Volume (K Unit) Forecast, by Application 2019 & 2032
- Table 115: Canada Data Wrangling Market Revenue (Million) Forecast, by Application 2019 & 2032
- Table 116: Canada Data Wrangling Market Volume (K Unit) Forecast, by Application 2019 & 2032
- Table 117: Global Data Wrangling Market Revenue Million Forecast, by Component 2019 & 2032
- Table 118: Global Data Wrangling Market Volume K Unit Forecast, by Component 2019 & 2032
- Table 119: Global Data Wrangling Market Revenue Million Forecast, by Deployment 2019 & 2032
- Table 120: Global Data Wrangling Market Volume K Unit Forecast, by Deployment 2019 & 2032
- Table 121: Global Data Wrangling Market Revenue Million Forecast, by Enterprise Type 2019 & 2032
- Table 122: Global Data Wrangling Market Volume K Unit Forecast, by Enterprise Type 2019 & 2032
- Table 123: Global Data Wrangling Market Revenue Million Forecast, by End-user Industry 2019 & 2032
- Table 124: Global Data Wrangling Market Volume K Unit Forecast, by End-user Industry 2019 & 2032
- Table 125: Global Data Wrangling Market Revenue Million Forecast, by Country 2019 & 2032
- Table 126: Global Data Wrangling Market Volume K Unit Forecast, by Country 2019 & 2032
- Table 127: United Kingdom Data Wrangling Market Revenue (Million) Forecast, by Application 2019 & 2032
- Table 128: United Kingdom Data Wrangling Market Volume (K Unit) Forecast, by Application 2019 & 2032
- Table 129: Germany Data Wrangling Market Revenue (Million) Forecast, by Application 2019 & 2032
- Table 130: Germany Data Wrangling Market Volume (K Unit) Forecast, by Application 2019 & 2032
- Table 131: France Data Wrangling Market Revenue (Million) Forecast, by Application 2019 & 2032
- Table 132: France Data Wrangling Market Volume (K Unit) Forecast, by Application 2019 & 2032
- Table 133: Rest of Europe Data Wrangling Market Revenue (Million) Forecast, by Application 2019 & 2032
- Table 134: Rest of Europe Data Wrangling Market Volume (K Unit) Forecast, by Application 2019 & 2032
- Table 135: Global Data Wrangling Market Revenue Million Forecast, by Component 2019 & 2032
- Table 136: Global Data Wrangling Market Volume K Unit Forecast, by Component 2019 & 2032
- Table 137: Global Data Wrangling Market Revenue Million Forecast, by Deployment 2019 & 2032
- Table 138: Global Data Wrangling Market Volume K Unit Forecast, by Deployment 2019 & 2032
- Table 139: Global Data Wrangling Market Revenue Million Forecast, by Enterprise Type 2019 & 2032
- Table 140: Global Data Wrangling Market Volume K Unit Forecast, by Enterprise Type 2019 & 2032
- Table 141: Global Data Wrangling Market Revenue Million Forecast, by End-user Industry 2019 & 2032
- Table 142: Global Data Wrangling Market Volume K Unit Forecast, by End-user Industry 2019 & 2032
- Table 143: Global Data Wrangling Market Revenue Million Forecast, by Country 2019 & 2032
- Table 144: Global Data Wrangling Market Volume K Unit Forecast, by Country 2019 & 2032
- Table 145: China Data Wrangling Market Revenue (Million) Forecast, by Application 2019 & 2032
- Table 146: China Data Wrangling Market Volume (K Unit) Forecast, by Application 2019 & 2032
- Table 147: Japan Data Wrangling Market Revenue (Million) Forecast, by Application 2019 & 2032
- Table 148: Japan Data Wrangling Market Volume (K Unit) Forecast, by Application 2019 & 2032
- Table 149: Singapore Data Wrangling Market Revenue (Million) Forecast, by Application 2019 & 2032
- Table 150: Singapore Data Wrangling Market Volume (K Unit) Forecast, by Application 2019 & 2032
- Table 151: Rest of Asia Pacific Data Wrangling Market Revenue (Million) Forecast, by Application 2019 & 2032
- Table 152: Rest of Asia Pacific Data Wrangling Market Volume (K Unit) Forecast, by Application 2019 & 2032
- Table 153: Global Data Wrangling Market Revenue Million Forecast, by Component 2019 & 2032
- Table 154: Global Data Wrangling Market Volume K Unit Forecast, by Component 2019 & 2032
- Table 155: Global Data Wrangling Market Revenue Million Forecast, by Deployment 2019 & 2032
- Table 156: Global Data Wrangling Market Volume K Unit Forecast, by Deployment 2019 & 2032
- Table 157: Global Data Wrangling Market Revenue Million Forecast, by Enterprise Type 2019 & 2032
- Table 158: Global Data Wrangling Market Volume K Unit Forecast, by Enterprise Type 2019 & 2032
- Table 159: Global Data Wrangling Market Revenue Million Forecast, by End-user Industry 2019 & 2032
- Table 160: Global Data Wrangling Market Volume K Unit Forecast, by End-user Industry 2019 & 2032
- Table 161: Global Data Wrangling Market Revenue Million Forecast, by Country 2019 & 2032
- Table 162: Global Data Wrangling Market Volume K Unit Forecast, by Country 2019 & 2032
- Table 163: Mexico Data Wrangling Market Revenue (Million) Forecast, by Application 2019 & 2032
- Table 164: Mexico Data Wrangling Market Volume (K Unit) Forecast, by Application 2019 & 2032
- Table 165: Brazil Data Wrangling Market Revenue (Million) Forecast, by Application 2019 & 2032
- Table 166: Brazil Data Wrangling Market Volume (K Unit) Forecast, by Application 2019 & 2032
- Table 167: Rest of Latin America Data Wrangling Market Revenue (Million) Forecast, by Application 2019 & 2032
- Table 168: Rest of Latin America Data Wrangling Market Volume (K Unit) Forecast, by Application 2019 & 2032
- Table 169: Global Data Wrangling Market Revenue Million Forecast, by Component 2019 & 2032
- Table 170: Global Data Wrangling Market Volume K Unit Forecast, by Component 2019 & 2032
- Table 171: Global Data Wrangling Market Revenue Million Forecast, by Deployment 2019 & 2032
- Table 172: Global Data Wrangling Market Volume K Unit Forecast, by Deployment 2019 & 2032
- Table 173: Global Data Wrangling Market Revenue Million Forecast, by Enterprise Type 2019 & 2032
- Table 174: Global Data Wrangling Market Volume K Unit Forecast, by Enterprise Type 2019 & 2032
- Table 175: Global Data Wrangling Market Revenue Million Forecast, by End-user Industry 2019 & 2032
- Table 176: Global Data Wrangling Market Volume K Unit Forecast, by End-user Industry 2019 & 2032
- Table 177: Global Data Wrangling Market Revenue Million Forecast, by Country 2019 & 2032
- Table 178: Global Data Wrangling Market Volume K Unit Forecast, by Country 2019 & 2032
- Table 179: United Arab Emirates Data Wrangling Market Revenue (Million) Forecast, by Application 2019 & 2032
- Table 180: United Arab Emirates Data Wrangling Market Volume (K Unit) Forecast, by Application 2019 & 2032
- Table 181: Saudi Arabia Data Wrangling Market Revenue (Million) Forecast, by Application 2019 & 2032
- Table 182: Saudi Arabia Data Wrangling Market Volume (K Unit) Forecast, by Application 2019 & 2032
- Table 183: Rest of Middle East Data Wrangling Market Revenue (Million) Forecast, by Application 2019 & 2032
- Table 184: Rest of Middle East Data Wrangling Market Volume (K Unit) Forecast, by Application 2019 & 2032
Frequently Asked Questions
1. What is the projected Compound Annual Growth Rate (CAGR) of the Data Wrangling Market?
The projected CAGR is approximately 11.03%.
2. Which companies are prominent players in the Data Wrangling Market?
Key companies in the market include SAS Institute Inc, TIBCO Software Inc (Cloud Software Group Inc ), Teradata Corporation, Cloudera Inc, Altair Engineering Inc, Cambridge Semantics Inc , Alteryx Inc, Oracle Corporation, DataRobot Inc, Datameer Inc.
3. What are the main segments of the Data Wrangling Market?
The market segments include Component, Deployment, Enterprise Type, End-user Industry.
4. Can you provide details about the market size?
The market size is estimated to be USD 3.41 Million as of 2022.
5. What are some drivers contributing to market growth?
Growing Volumes of Data; Advancement in AI And Big Data Technologies; Growing Concern about Data Veracity.
6. What are the notable trends driving market growth?
Large Enterprises are Analyzed to Hold Significant Market Share.
7. Are there any restraints impacting market growth?
Lack Of Awareness Of Data Wrangling Tools Among Enterprises; Explicit Data Access Permission.
8. Can you provide examples of recent developments in the market?
May 2023 - Adroit DI launched SDF Pro, a cloud-based application that provides a cost-effective solution for storing, sorting, and Wrangling 10 million molecules within seconds. SDF Pro offers a user-configurable interface accessible from login, enabling users to organize, structure, and store large data sets.
9. What pricing options are available for accessing the report?
Pricing options include single-user, multi-user, and enterprise licenses priced at USD 4750, USD 5250, and USD 8750 respectively.
10. Is the market size provided in terms of value or volume?
The market size is provided in terms of value, measured in Million and volume, measured in K Unit.
11. Are there any specific market keywords associated with the report?
Yes, the market keyword associated with the report is "Data Wrangling Market," which aids in identifying and referencing the specific market segment covered.
12. How do I determine which pricing option suits my needs best?
The pricing options vary based on user requirements and access needs. Individual users may opt for single-user licenses, while businesses requiring broader access may choose multi-user or enterprise licenses for cost-effective access to the report.
13. Are there any additional resources or data provided in the Data Wrangling Market report?
While the report offers comprehensive insights, it's advisable to review the specific contents or supplementary materials provided to ascertain if additional resources or data are available.
14. How can I stay updated on further developments or reports in the Data Wrangling Market?
To stay informed about further developments, trends, and reports in the Data Wrangling Market, consider subscribing to industry newsletters, following relevant companies and organizations, or regularly checking reputable industry news sources and publications.
Methodology
Step 1 - Identification of Relevant Samples Size from Population Database


Step 2 - Approaches for Defining Global Market Size (Value, Volume* & Price*)

Note*: In applicable scenarios
Step 3 - Data Sources
Primary Research
- Web Analytics
- Survey Reports
- Research Institute
- Latest Research Reports
- Opinion Leaders
Secondary Research
- Annual Reports
- White Paper
- Latest Press Release
- Industry Association
- Paid Database
- Investor Presentations

Step 4 - Data Triangulation
Involves using different sources of information in order to increase the validity of a study
These sources are likely to be stakeholders in a program - participants, other researchers, program staff, other community members, and so on.
Then we put all data in single framework & apply various statistical tools to find out the dynamic on the market.
During the analysis stage, feedback from the stakeholder groups would be compared to determine areas of agreement as well as areas of divergence


