


Key Insights
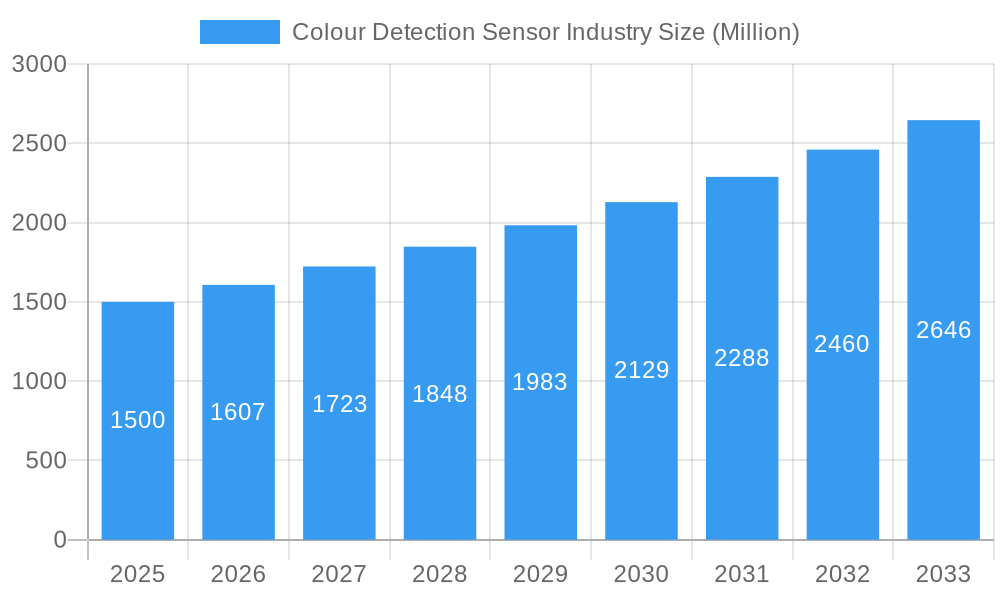
The global Colour Detection Sensor market is poised for significant expansion, projected to reach approximately USD 1.5 billion in 2025 and grow at a robust Compound Annual Growth Rate (CAGR) of 7.18% through 2033. This upward trajectory is primarily fueled by the escalating demand for automation and quality control across a multitude of industries. The increasing sophistication of manufacturing processes, particularly in sectors like food and beverage, healthcare, and automotive, necessitates precise colour identification for product differentiation, defect detection, and adherence to stringent quality standards. Furthermore, the burgeoning consumer electronics sector's reliance on accurate colour reproduction for displays and components contributes substantially to market growth. Advancements in sensor technology, leading to enhanced accuracy, faster response times, and miniaturization, are also key drivers, making colour detection sensors more accessible and adaptable to diverse applications. The integration of these sensors into Industry 4.0 frameworks, enabling real-time data collection and analysis for optimized production, further solidifies their importance.

Colour Detection Sensor Industry Market Size (In Billion)

The market's dynamic landscape is characterized by segmentation across various sensor types, including Brightness Sensors, Molecular Luminescence Sensors, RGB Sensors, and Printed Mark Sensors. Each segment caters to specific industry needs, with RGB sensors being particularly prevalent due to their versatility in detecting a broad spectrum of colours. The end-user industry segmentation highlights the dominant roles of the Food and Beverage, Healthcare, Chemical, Textile, Automotive, and Consumer Electronics sectors, each leveraging colour detection for critical functions. While the market benefits from strong growth drivers, potential restraints such as the high initial cost of advanced sensor systems and the need for skilled personnel for integration and maintenance could temper rapid adoption in certain segments or regions. However, the continuous innovation in sensor technology and the increasing awareness of the benefits of automated colour inspection are expected to outweigh these challenges, driving sustained market expansion worldwide.
Colour Detection Sensor Industry Company Market Share
This in-depth report offers a detailed examination of the global Colour Detection Sensor Market, a rapidly evolving sector vital to automation, quality control, and innovation across diverse industries. With a robust study period from 2019 to 2033, including a base year of 2025, an estimated year of 2025, and a comprehensive forecast period from 2025 to 2033, this analysis provides actionable insights for stakeholders. We delve into market dynamics, growth trends, regional dominance, product landscapes, key drivers and challenges, emerging opportunities, growth accelerators, and the influential players shaping this dynamic industry. Leveraging high-traffic keywords such as "colour sensor," "vision sensor," "automation sensor," "industrial sensors," "quality control solutions," "machine vision," and "smart manufacturing," this report is optimized for maximum search engine visibility and designed to engage industry professionals seeking a competitive edge.
Colour Detection Sensor Industry Market Dynamics & Structure
The Colour Detection Sensor Industry exhibits a moderately concentrated market structure, characterized by a blend of established global players and emerging specialized manufacturers. Technological innovation is a primary driver, fueled by advancements in optical components, image processing algorithms, and miniaturization, leading to increasingly sophisticated and accurate sensor solutions. For instance, the development of RGB-IR sensors marks a significant leap in ambient light adaptability and object differentiation. Regulatory frameworks, particularly those concerning industrial safety, environmental monitoring, and product quality standards, indirectly influence the adoption and specifications of colour detection sensors. Competitive product substitutes include more basic colorimeters or manual inspection methods, but their limitations in speed, accuracy, and consistency pave the way for sensor-based automation. End-user demographics are broad, spanning manufacturing, agriculture, healthcare, and research, with a growing demand from the Automotive, Consumer Electronics, and Food and Beverage sectors. Mergers and acquisitions (M&A) trends indicate a strategic consolidation, with larger players acquiring innovative smaller firms to expand their product portfolios and market reach. For example, recent years have seen several acquisitions of specialized vision technology companies by diversified automation providers. Innovation barriers primarily stem from high research and development costs, the need for specialized expertise, and the lengthy product development cycles required to meet stringent industrial certifications.
Colour Detection Sensor Industry Growth Trends & Insights
The Colour Detection Sensor Industry is projected for robust growth, driven by the relentless pursuit of automation and enhanced quality control across global manufacturing landscapes. The market size is expected to experience a Compound Annual Growth Rate (CAGR) of approximately 7.5% during the forecast period (2025-2033), escalating from an estimated $1.8 billion in 2025 to over $3.2 billion by 2033. Adoption rates are accelerating, particularly in industries prioritizing precision, efficiency, and reduced human error. Technological disruptions, such as the integration of AI and machine learning into sensor data analysis, are revolutionizing capabilities, enabling predictive maintenance and adaptive process control. Consumer behavior shifts towards higher quality products and stringent regulatory compliance are further fueling demand for reliable colour detection solutions. For example, in the Food and Beverage industry, sensors are crucial for ensuring product consistency, detecting spoilage, and verifying packaging integrity, contributing to higher consumer trust and safety. Similarly, the Healthcare sector leverages these sensors for accurate drug identification, medical device quality assurance, and diagnostic imaging enhancement. The increasing sophistication of RGB Sensors and the emergence of specialized Molecular Luminescence Sensors for environmental monitoring highlight the expanding application spectrum. The penetration of these sensors into emerging economies, driven by industrialization and investment in smart manufacturing infrastructure, presents significant untapped potential. The trend towards Industry 4.0 initiatives globally is a paramount catalyst, pushing manufacturers to adopt advanced sensing technologies to achieve operational excellence and maintain competitive advantage.
Dominant Regions, Countries, or Segments in Colour Detection Sensor Industry
The Colour Detection Sensor Industry is witnessing dominant growth fueled by key segments and strategically positioned regions. Within the Type segment, RGB Sensors are emerging as a leading force, driven by their versatility in color matching, quality inspection, and alignment applications across a multitude of industries. Their ability to accurately differentiate a wide spectrum of colors makes them indispensable for sectors like Textile (dye consistency), Automotive (paint finish inspection), and Consumer Electronics (component verification). The Printed Mark Sensor segment also plays a crucial role, especially in packaging and labeling, ensuring product traceability and brand integrity.
Geographically, Asia Pacific is projected to be the dominant region, driven by its robust manufacturing base, rapid industrialization, and increasing adoption of automation technologies. Countries like China, Japan, and South Korea are at the forefront, with substantial investments in smart factories and advanced manufacturing processes. The region's growth is further propelled by government initiatives promoting technological innovation and digital transformation.
The End-user Industry landscape reveals significant contributions from:
- Automotive: High demand for paint inspection, part identification, and quality control in assembly lines. The increasing complexity of vehicle interiors and exteriors necessitates precise colour verification.
- Consumer Electronics: Crucial for component inspection, color calibration of displays, and quality assurance in the production of smartphones, televisions, and other electronic devices.
- Food and Beverage: Essential for product consistency, ripeness detection, contamination checks, and packaging quality control, ensuring consumer safety and brand reputation.
Factors contributing to this dominance include favorable economic policies, significant infrastructure development, a large and skilled workforce, and strong domestic demand for manufactured goods. Market share within these dominant segments and regions is steadily increasing, reflecting the growing reliance on sophisticated colour detection for operational efficiency and product excellence. The penetration of advanced sensors in these areas is expected to continue its upward trajectory, solidifying their leading positions in the global market.
Colour Detection Sensor Industry Product Landscape
The Colour Detection Sensor Industry is characterized by continuous product innovation, enhancing accuracy, speed, and integration capabilities. Key advancements include the development of high-resolution RGB Sensors with wider spectral sensitivity, enabling finer color distinctions for critical applications like pharmaceutical quality control and food sorting. Molecular Luminescence Sensors are gaining traction for their ability to detect specific chemical compounds and environmental pollutants, particularly in the Healthcare and Chemical sectors. Product applications are expanding from basic color identification to complex tasks such as defect detection, material sorting, and process monitoring. Unique selling propositions include enhanced robustness for harsh industrial environments, miniaturized designs for space-constrained applications, and seamless integration with IoT platforms for real-time data analytics. Technological advancements are also focused on improving sensor response times and reducing susceptibility to ambient light variations, further increasing their utility in diverse operating conditions.
Key Drivers, Barriers & Challenges in Colour Detection Sensor Industry
Key Drivers:
- Automation and Industry 4.0 Adoption: The global push for smart manufacturing and industrial automation is a primary growth catalyst, demanding precise sensors for quality control and process optimization.
- Increasing Quality Control Demands: Stringent regulations and consumer expectations for product consistency and safety across industries like Food & Beverage and Healthcare necessitate advanced colour detection.
- Technological Advancements: Innovations in sensor technology, AI integration, and data processing are enhancing accuracy, speed, and functionality, driving new applications.
- Miniaturization and Integration: Smaller, more integrated sensors are enabling their deployment in a wider range of devices and complex machinery.
Barriers & Challenges:
- High R&D Investment: Developing cutting-edge sensor technology requires substantial financial resources and specialized expertise, posing a challenge for smaller companies.
- Complex Integration and Calibration: Implementing and calibrating advanced colour detection systems can be complex, requiring skilled personnel and significant setup time.
- Economic Downturns and Supply Chain Disruptions: Global economic uncertainties and supply chain vulnerabilities can impact raw material availability, production costs, and market demand.
- Competitive Pricing Pressure: While innovation drives value, intense competition can lead to pricing pressures, affecting profit margins for some market players. The ongoing development of more affordable yet capable sensors can also disrupt established market dynamics.
Emerging Opportunities in Colour Detection Sensor Industry
Emerging opportunities within the Colour Detection Sensor Industry lie in the growing demand for specialized sensing solutions and untapped market segments. The expansion of precision agriculture presents a significant opportunity for sensors that can monitor crop health and maturity through color analysis. Furthermore, the increasing focus on sustainable manufacturing and recycling processes creates a need for sensors capable of efficiently sorting materials based on color and composition. The burgeoning augmented reality (AR) and virtual reality (VR) markets also offer potential applications for advanced colour detection in creating immersive and accurate visual experiences. The development of "smart packaging" solutions that incorporate colour-indicating features for freshness or tamper detection is another promising avenue.
Growth Accelerators in the Colour Detection Sensor Industry Industry
Several factors are acting as growth accelerators for the Colour Detection Sensor Industry. The increasing adoption of the Industrial Internet of Things (IIoT) is a significant catalyst, enabling real-time data collection and analysis from colour sensors, leading to improved process efficiency and predictive capabilities. Strategic partnerships between sensor manufacturers and automation solution providers are also accelerating market penetration by offering integrated and comprehensive solutions to end-users. Furthermore, the growing awareness and implementation of stringent product safety and quality standards worldwide are directly boosting the demand for reliable colour detection technologies across various manufacturing sectors. The continuous drive towards operational excellence and cost reduction in manufacturing environments further solidifies the role of these sensors as essential components for achieving these goals.
Key Players Shaping the Colour Detection Sensor Industry Market
- Vishay Intertechnology Inc
- Keyence Corporation
- Hamamatsu Photonics KK
- Astech Applied Sensor Technology Gmbh
- Pepperl+Fuchs
- Baumer NV
- Jenoptik AG
- SensoPart Industriesensorik GmbH
- SICK AG
- Wenglor Sensoric GmbH
- Omron Corporation
- Ams-Osram AG
- EMX Industries Inc
- Balluff GmbH
- Banner Engineering Corp
- Rockwell Automation Inc
- Datalogic SpA
- Panasonic Corporation
Notable Milestones in Colour Detection Sensor Industry Sector
- May 2024: Leopard Imaging Inc. announced the stereo camera EAGLE 2 LI-VB1940-GM2A-119H launch at Embedded Vision Summit 2024. The camera marked a significant milestone in vision technology. It introduces the world's first RGB-IR high-resolution stereo camera with patent-pending features, poised to redefine day and night vision capabilities. The Eagle 2 camera boasts an advanced design, incorporating two automotive-grade 5.1-megapixel shutter RGB-IR image sensors.
- January 2024: Chemistry and Environmental Science researchers at the University of Birmingham, in partnership with scientists from the German Federal Institute for Materials Research and Testing (BAM), pioneered an innovative method to detect 'forever chemicals' in water using luminescence sensors.
In-Depth Colour Detection Sensor Industry Market Outlook
The Colour Detection Sensor Industry is poised for sustained and accelerated growth, driven by the pervasive need for automation, precision, and quality assurance. Future market potential is immense, fueled by the continued evolution of AI-powered sensor analytics and the expansion into new application frontiers such as advanced medical diagnostics and environmental monitoring. Strategic opportunities abound in developing customizable solutions for niche industrial requirements and in fortifying supply chains to meet escalating global demand. The ongoing commitment to innovation by key players, coupled with increasing investments in smart manufacturing infrastructure, will ensure that colour detection sensors remain indispensable components driving industrial progress and operational excellence for the foreseeable future.
Colour Detection Sensor Industry Segmentation
-
1. Type
- 1.1. Brightness Sensor
- 1.2. Molecular Luminescence Sensor
- 1.3. RGB Sensor
- 1.4. Printed Mark Sensor
-
2. End-user Industry
- 2.1. Food and Beverage
- 2.2. Healthcare
- 2.3. Chemical
- 2.4. Textile
- 2.5. Automotive
- 2.6. Consumer Electronics
- 2.7. Other End-user Industries
Colour Detection Sensor Industry Segmentation By Geography
- 1. North America
- 2. Europe
- 3. Asia
- 4. Australia and New Zealand
- 5. Latin America
- 6. Middle East

Colour Detection Sensor Industry Regional Market Share
Geographic Coverage of Colour Detection Sensor Industry
Colour Detection Sensor Industry REPORT HIGHLIGHTS
| Aspects | Details |
|---|---|
| Study Period | 2020-2034 |
| Base Year | 2025 |
| Estimated Year | 2026 |
| Forecast Period | 2026-2034 |
| Historical Period | 2020-2025 |
| Growth Rate | CAGR of 7.18% from 2020-2034 |
| Segmentation |
|
Table of Contents
- 1. Introduction
- 1.1. Research Scope
- 1.2. Market Segmentation
- 1.3. Research Methodology
- 1.4. Definitions and Assumptions
- 2. Executive Summary
- 2.1. Introduction
- 3. Market Dynamics
- 3.1. Introduction
- 3.2. Market Drivers
- 3.2.1. Process Automation across Various Industries; Increased Use of Color Sensors in Smartphones
- 3.3. Market Restrains
- 3.3.1. Higher Initial Costs
- 3.4. Market Trends
- 3.4.1. Food and Beverage Industry to be the Fastest Growing End User
- 4. Market Factor Analysis
- 4.1. Porters Five Forces
- 4.2. Supply/Value Chain
- 4.3. PESTEL analysis
- 4.4. Market Entropy
- 4.5. Patent/Trademark Analysis
- 5. Global Colour Detection Sensor Industry Analysis, Insights and Forecast, 2020-2032
- 5.1. Market Analysis, Insights and Forecast - by Type
- 5.1.1. Brightness Sensor
- 5.1.2. Molecular Luminescence Sensor
- 5.1.3. RGB Sensor
- 5.1.4. Printed Mark Sensor
- 5.2. Market Analysis, Insights and Forecast - by End-user Industry
- 5.2.1. Food and Beverage
- 5.2.2. Healthcare
- 5.2.3. Chemical
- 5.2.4. Textile
- 5.2.5. Automotive
- 5.2.6. Consumer Electronics
- 5.2.7. Other End-user Industries
- 5.3. Market Analysis, Insights and Forecast - by Region
- 5.3.1. North America
- 5.3.2. Europe
- 5.3.3. Asia
- 5.3.4. Australia and New Zealand
- 5.3.5. Latin America
- 5.3.6. Middle East
- 5.1. Market Analysis, Insights and Forecast - by Type
- 6. North America Colour Detection Sensor Industry Analysis, Insights and Forecast, 2020-2032
- 6.1. Market Analysis, Insights and Forecast - by Type
- 6.1.1. Brightness Sensor
- 6.1.2. Molecular Luminescence Sensor
- 6.1.3. RGB Sensor
- 6.1.4. Printed Mark Sensor
- 6.2. Market Analysis, Insights and Forecast - by End-user Industry
- 6.2.1. Food and Beverage
- 6.2.2. Healthcare
- 6.2.3. Chemical
- 6.2.4. Textile
- 6.2.5. Automotive
- 6.2.6. Consumer Electronics
- 6.2.7. Other End-user Industries
- 6.1. Market Analysis, Insights and Forecast - by Type
- 7. Europe Colour Detection Sensor Industry Analysis, Insights and Forecast, 2020-2032
- 7.1. Market Analysis, Insights and Forecast - by Type
- 7.1.1. Brightness Sensor
- 7.1.2. Molecular Luminescence Sensor
- 7.1.3. RGB Sensor
- 7.1.4. Printed Mark Sensor
- 7.2. Market Analysis, Insights and Forecast - by End-user Industry
- 7.2.1. Food and Beverage
- 7.2.2. Healthcare
- 7.2.3. Chemical
- 7.2.4. Textile
- 7.2.5. Automotive
- 7.2.6. Consumer Electronics
- 7.2.7. Other End-user Industries
- 7.1. Market Analysis, Insights and Forecast - by Type
- 8. Asia Colour Detection Sensor Industry Analysis, Insights and Forecast, 2020-2032
- 8.1. Market Analysis, Insights and Forecast - by Type
- 8.1.1. Brightness Sensor
- 8.1.2. Molecular Luminescence Sensor
- 8.1.3. RGB Sensor
- 8.1.4. Printed Mark Sensor
- 8.2. Market Analysis, Insights and Forecast - by End-user Industry
- 8.2.1. Food and Beverage
- 8.2.2. Healthcare
- 8.2.3. Chemical
- 8.2.4. Textile
- 8.2.5. Automotive
- 8.2.6. Consumer Electronics
- 8.2.7. Other End-user Industries
- 8.1. Market Analysis, Insights and Forecast - by Type
- 9. Australia and New Zealand Colour Detection Sensor Industry Analysis, Insights and Forecast, 2020-2032
- 9.1. Market Analysis, Insights and Forecast - by Type
- 9.1.1. Brightness Sensor
- 9.1.2. Molecular Luminescence Sensor
- 9.1.3. RGB Sensor
- 9.1.4. Printed Mark Sensor
- 9.2. Market Analysis, Insights and Forecast - by End-user Industry
- 9.2.1. Food and Beverage
- 9.2.2. Healthcare
- 9.2.3. Chemical
- 9.2.4. Textile
- 9.2.5. Automotive
- 9.2.6. Consumer Electronics
- 9.2.7. Other End-user Industries
- 9.1. Market Analysis, Insights and Forecast - by Type
- 10. Latin America Colour Detection Sensor Industry Analysis, Insights and Forecast, 2020-2032
- 10.1. Market Analysis, Insights and Forecast - by Type
- 10.1.1. Brightness Sensor
- 10.1.2. Molecular Luminescence Sensor
- 10.1.3. RGB Sensor
- 10.1.4. Printed Mark Sensor
- 10.2. Market Analysis, Insights and Forecast - by End-user Industry
- 10.2.1. Food and Beverage
- 10.2.2. Healthcare
- 10.2.3. Chemical
- 10.2.4. Textile
- 10.2.5. Automotive
- 10.2.6. Consumer Electronics
- 10.2.7. Other End-user Industries
- 10.1. Market Analysis, Insights and Forecast - by Type
- 11. Middle East Colour Detection Sensor Industry Analysis, Insights and Forecast, 2020-2032
- 11.1. Market Analysis, Insights and Forecast - by Type
- 11.1.1. Brightness Sensor
- 11.1.2. Molecular Luminescence Sensor
- 11.1.3. RGB Sensor
- 11.1.4. Printed Mark Sensor
- 11.2. Market Analysis, Insights and Forecast - by End-user Industry
- 11.2.1. Food and Beverage
- 11.2.2. Healthcare
- 11.2.3. Chemical
- 11.2.4. Textile
- 11.2.5. Automotive
- 11.2.6. Consumer Electronics
- 11.2.7. Other End-user Industries
- 11.1. Market Analysis, Insights and Forecast - by Type
- 12. Competitive Analysis
- 12.1. Global Market Share Analysis 2025
- 12.2. Company Profiles
- 12.2.1 Vishay Intertechnology Inc
- 12.2.1.1. Overview
- 12.2.1.2. Products
- 12.2.1.3. SWOT Analysis
- 12.2.1.4. Recent Developments
- 12.2.1.5. Financials (Based on Availability)
- 12.2.2 Keyence Corporation
- 12.2.2.1. Overview
- 12.2.2.2. Products
- 12.2.2.3. SWOT Analysis
- 12.2.2.4. Recent Developments
- 12.2.2.5. Financials (Based on Availability)
- 12.2.3 Hamamatsu Photonics KK
- 12.2.3.1. Overview
- 12.2.3.2. Products
- 12.2.3.3. SWOT Analysis
- 12.2.3.4. Recent Developments
- 12.2.3.5. Financials (Based on Availability)
- 12.2.4 Astech Applied Sensor Technology Gmbh
- 12.2.4.1. Overview
- 12.2.4.2. Products
- 12.2.4.3. SWOT Analysis
- 12.2.4.4. Recent Developments
- 12.2.4.5. Financials (Based on Availability)
- 12.2.5 Pepperl+Fuch
- 12.2.5.1. Overview
- 12.2.5.2. Products
- 12.2.5.3. SWOT Analysis
- 12.2.5.4. Recent Developments
- 12.2.5.5. Financials (Based on Availability)
- 12.2.6 Baumer NV
- 12.2.6.1. Overview
- 12.2.6.2. Products
- 12.2.6.3. SWOT Analysis
- 12.2.6.4. Recent Developments
- 12.2.6.5. Financials (Based on Availability)
- 12.2.7 Jenoptik AG
- 12.2.7.1. Overview
- 12.2.7.2. Products
- 12.2.7.3. SWOT Analysis
- 12.2.7.4. Recent Developments
- 12.2.7.5. Financials (Based on Availability)
- 12.2.8 SensoPart Industriesensorik GmbH
- 12.2.8.1. Overview
- 12.2.8.2. Products
- 12.2.8.3. SWOT Analysis
- 12.2.8.4. Recent Developments
- 12.2.8.5. Financials (Based on Availability)
- 12.2.9 SICK AG
- 12.2.9.1. Overview
- 12.2.9.2. Products
- 12.2.9.3. SWOT Analysis
- 12.2.9.4. Recent Developments
- 12.2.9.5. Financials (Based on Availability)
- 12.2.10 Wenglor Sensoric GmbH
- 12.2.10.1. Overview
- 12.2.10.2. Products
- 12.2.10.3. SWOT Analysis
- 12.2.10.4. Recent Developments
- 12.2.10.5. Financials (Based on Availability)
- 12.2.11 Omron Corporation
- 12.2.11.1. Overview
- 12.2.11.2. Products
- 12.2.11.3. SWOT Analysis
- 12.2.11.4. Recent Developments
- 12.2.11.5. Financials (Based on Availability)
- 12.2.12 Ams-Osram AG
- 12.2.12.1. Overview
- 12.2.12.2. Products
- 12.2.12.3. SWOT Analysis
- 12.2.12.4. Recent Developments
- 12.2.12.5. Financials (Based on Availability)
- 12.2.13 EMX Industries Inc
- 12.2.13.1. Overview
- 12.2.13.2. Products
- 12.2.13.3. SWOT Analysis
- 12.2.13.4. Recent Developments
- 12.2.13.5. Financials (Based on Availability)
- 12.2.14 Balluff GmbH
- 12.2.14.1. Overview
- 12.2.14.2. Products
- 12.2.14.3. SWOT Analysis
- 12.2.14.4. Recent Developments
- 12.2.14.5. Financials (Based on Availability)
- 12.2.15 Banner Engineering Corp
- 12.2.15.1. Overview
- 12.2.15.2. Products
- 12.2.15.3. SWOT Analysis
- 12.2.15.4. Recent Developments
- 12.2.15.5. Financials (Based on Availability)
- 12.2.16 Rockwell Automation Inc
- 12.2.16.1. Overview
- 12.2.16.2. Products
- 12.2.16.3. SWOT Analysis
- 12.2.16.4. Recent Developments
- 12.2.16.5. Financials (Based on Availability)
- 12.2.17 Datalogic SpA
- 12.2.17.1. Overview
- 12.2.17.2. Products
- 12.2.17.3. SWOT Analysis
- 12.2.17.4. Recent Developments
- 12.2.17.5. Financials (Based on Availability)
- 12.2.18 Panasonic Corporation
- 12.2.18.1. Overview
- 12.2.18.2. Products
- 12.2.18.3. SWOT Analysis
- 12.2.18.4. Recent Developments
- 12.2.18.5. Financials (Based on Availability)
- 12.2.1 Vishay Intertechnology Inc
List of Figures
- Figure 1: Global Colour Detection Sensor Industry Revenue Breakdown (Million, %) by Region 2025 & 2033
- Figure 2: North America Colour Detection Sensor Industry Revenue (Million), by Type 2025 & 2033
- Figure 3: North America Colour Detection Sensor Industry Revenue Share (%), by Type 2025 & 2033
- Figure 4: North America Colour Detection Sensor Industry Revenue (Million), by End-user Industry 2025 & 2033
- Figure 5: North America Colour Detection Sensor Industry Revenue Share (%), by End-user Industry 2025 & 2033
- Figure 6: North America Colour Detection Sensor Industry Revenue (Million), by Country 2025 & 2033
- Figure 7: North America Colour Detection Sensor Industry Revenue Share (%), by Country 2025 & 2033
- Figure 8: Europe Colour Detection Sensor Industry Revenue (Million), by Type 2025 & 2033
- Figure 9: Europe Colour Detection Sensor Industry Revenue Share (%), by Type 2025 & 2033
- Figure 10: Europe Colour Detection Sensor Industry Revenue (Million), by End-user Industry 2025 & 2033
- Figure 11: Europe Colour Detection Sensor Industry Revenue Share (%), by End-user Industry 2025 & 2033
- Figure 12: Europe Colour Detection Sensor Industry Revenue (Million), by Country 2025 & 2033
- Figure 13: Europe Colour Detection Sensor Industry Revenue Share (%), by Country 2025 & 2033
- Figure 14: Asia Colour Detection Sensor Industry Revenue (Million), by Type 2025 & 2033
- Figure 15: Asia Colour Detection Sensor Industry Revenue Share (%), by Type 2025 & 2033
- Figure 16: Asia Colour Detection Sensor Industry Revenue (Million), by End-user Industry 2025 & 2033
- Figure 17: Asia Colour Detection Sensor Industry Revenue Share (%), by End-user Industry 2025 & 2033
- Figure 18: Asia Colour Detection Sensor Industry Revenue (Million), by Country 2025 & 2033
- Figure 19: Asia Colour Detection Sensor Industry Revenue Share (%), by Country 2025 & 2033
- Figure 20: Australia and New Zealand Colour Detection Sensor Industry Revenue (Million), by Type 2025 & 2033
- Figure 21: Australia and New Zealand Colour Detection Sensor Industry Revenue Share (%), by Type 2025 & 2033
- Figure 22: Australia and New Zealand Colour Detection Sensor Industry Revenue (Million), by End-user Industry 2025 & 2033
- Figure 23: Australia and New Zealand Colour Detection Sensor Industry Revenue Share (%), by End-user Industry 2025 & 2033
- Figure 24: Australia and New Zealand Colour Detection Sensor Industry Revenue (Million), by Country 2025 & 2033
- Figure 25: Australia and New Zealand Colour Detection Sensor Industry Revenue Share (%), by Country 2025 & 2033
- Figure 26: Latin America Colour Detection Sensor Industry Revenue (Million), by Type 2025 & 2033
- Figure 27: Latin America Colour Detection Sensor Industry Revenue Share (%), by Type 2025 & 2033
- Figure 28: Latin America Colour Detection Sensor Industry Revenue (Million), by End-user Industry 2025 & 2033
- Figure 29: Latin America Colour Detection Sensor Industry Revenue Share (%), by End-user Industry 2025 & 2033
- Figure 30: Latin America Colour Detection Sensor Industry Revenue (Million), by Country 2025 & 2033
- Figure 31: Latin America Colour Detection Sensor Industry Revenue Share (%), by Country 2025 & 2033
- Figure 32: Middle East Colour Detection Sensor Industry Revenue (Million), by Type 2025 & 2033
- Figure 33: Middle East Colour Detection Sensor Industry Revenue Share (%), by Type 2025 & 2033
- Figure 34: Middle East Colour Detection Sensor Industry Revenue (Million), by End-user Industry 2025 & 2033
- Figure 35: Middle East Colour Detection Sensor Industry Revenue Share (%), by End-user Industry 2025 & 2033
- Figure 36: Middle East Colour Detection Sensor Industry Revenue (Million), by Country 2025 & 2033
- Figure 37: Middle East Colour Detection Sensor Industry Revenue Share (%), by Country 2025 & 2033
List of Tables
- Table 1: Global Colour Detection Sensor Industry Revenue Million Forecast, by Type 2020 & 2033
- Table 2: Global Colour Detection Sensor Industry Revenue Million Forecast, by End-user Industry 2020 & 2033
- Table 3: Global Colour Detection Sensor Industry Revenue Million Forecast, by Region 2020 & 2033
- Table 4: Global Colour Detection Sensor Industry Revenue Million Forecast, by Type 2020 & 2033
- Table 5: Global Colour Detection Sensor Industry Revenue Million Forecast, by End-user Industry 2020 & 2033
- Table 6: Global Colour Detection Sensor Industry Revenue Million Forecast, by Country 2020 & 2033
- Table 7: Global Colour Detection Sensor Industry Revenue Million Forecast, by Type 2020 & 2033
- Table 8: Global Colour Detection Sensor Industry Revenue Million Forecast, by End-user Industry 2020 & 2033
- Table 9: Global Colour Detection Sensor Industry Revenue Million Forecast, by Country 2020 & 2033
- Table 10: Global Colour Detection Sensor Industry Revenue Million Forecast, by Type 2020 & 2033
- Table 11: Global Colour Detection Sensor Industry Revenue Million Forecast, by End-user Industry 2020 & 2033
- Table 12: Global Colour Detection Sensor Industry Revenue Million Forecast, by Country 2020 & 2033
- Table 13: Global Colour Detection Sensor Industry Revenue Million Forecast, by Type 2020 & 2033
- Table 14: Global Colour Detection Sensor Industry Revenue Million Forecast, by End-user Industry 2020 & 2033
- Table 15: Global Colour Detection Sensor Industry Revenue Million Forecast, by Country 2020 & 2033
- Table 16: Global Colour Detection Sensor Industry Revenue Million Forecast, by Type 2020 & 2033
- Table 17: Global Colour Detection Sensor Industry Revenue Million Forecast, by End-user Industry 2020 & 2033
- Table 18: Global Colour Detection Sensor Industry Revenue Million Forecast, by Country 2020 & 2033
- Table 19: Global Colour Detection Sensor Industry Revenue Million Forecast, by Type 2020 & 2033
- Table 20: Global Colour Detection Sensor Industry Revenue Million Forecast, by End-user Industry 2020 & 2033
- Table 21: Global Colour Detection Sensor Industry Revenue Million Forecast, by Country 2020 & 2033
Frequently Asked Questions
1. What is the projected Compound Annual Growth Rate (CAGR) of the Colour Detection Sensor Industry?
The projected CAGR is approximately 7.18%.
2. Which companies are prominent players in the Colour Detection Sensor Industry?
Key companies in the market include Vishay Intertechnology Inc, Keyence Corporation, Hamamatsu Photonics KK, Astech Applied Sensor Technology Gmbh, Pepperl+Fuch, Baumer NV, Jenoptik AG, SensoPart Industriesensorik GmbH, SICK AG, Wenglor Sensoric GmbH, Omron Corporation, Ams-Osram AG, EMX Industries Inc, Balluff GmbH, Banner Engineering Corp, Rockwell Automation Inc, Datalogic SpA, Panasonic Corporation.
3. What are the main segments of the Colour Detection Sensor Industry?
The market segments include Type, End-user Industry.
4. Can you provide details about the market size?
The market size is estimated to be USD 1.5 Million as of 2022.
5. What are some drivers contributing to market growth?
Process Automation across Various Industries; Increased Use of Color Sensors in Smartphones.
6. What are the notable trends driving market growth?
Food and Beverage Industry to be the Fastest Growing End User.
7. Are there any restraints impacting market growth?
Higher Initial Costs.
8. Can you provide examples of recent developments in the market?
May 2024: Leopard Imaging Inc. announced the stereo camera EAGLE 2 LI-VB1940-GM2A-119H launch at Embedded Vision Summit 2024. The camera marked a significant milestone in vision technology. It introduces the world's first RGB-IR high-resolution stereo camera with patent-pending features, poised to redefine day and night vision capabilities. The Eagle 2 camera boasts an advanced design, incorporating two automotive-grade 5.1-megapixel shutter RGB-IR image sensors.
9. What pricing options are available for accessing the report?
Pricing options include single-user, multi-user, and enterprise licenses priced at USD 4750, USD 5250, and USD 8750 respectively.
10. Is the market size provided in terms of value or volume?
The market size is provided in terms of value, measured in Million.
11. Are there any specific market keywords associated with the report?
Yes, the market keyword associated with the report is "Colour Detection Sensor Industry," which aids in identifying and referencing the specific market segment covered.
12. How do I determine which pricing option suits my needs best?
The pricing options vary based on user requirements and access needs. Individual users may opt for single-user licenses, while businesses requiring broader access may choose multi-user or enterprise licenses for cost-effective access to the report.
13. Are there any additional resources or data provided in the Colour Detection Sensor Industry report?
While the report offers comprehensive insights, it's advisable to review the specific contents or supplementary materials provided to ascertain if additional resources or data are available.
14. How can I stay updated on further developments or reports in the Colour Detection Sensor Industry?
To stay informed about further developments, trends, and reports in the Colour Detection Sensor Industry, consider subscribing to industry newsletters, following relevant companies and organizations, or regularly checking reputable industry news sources and publications.
Methodology
Step 1 - Identification of Relevant Samples Size from Population Database


Step 2 - Approaches for Defining Global Market Size (Value, Volume* & Price*)

Note*: In applicable scenarios
Step 3 - Data Sources
Primary Research
- Web Analytics
- Survey Reports
- Research Institute
- Latest Research Reports
- Opinion Leaders
Secondary Research
- Annual Reports
- White Paper
- Latest Press Release
- Industry Association
- Paid Database
- Investor Presentations

Step 4 - Data Triangulation
Involves using different sources of information in order to increase the validity of a study
These sources are likely to be stakeholders in a program - participants, other researchers, program staff, other community members, and so on.
Then we put all data in single framework & apply various statistical tools to find out the dynamic on the market.
During the analysis stage, feedback from the stakeholder groups would be compared to determine areas of agreement as well as areas of divergence