
Key Insights
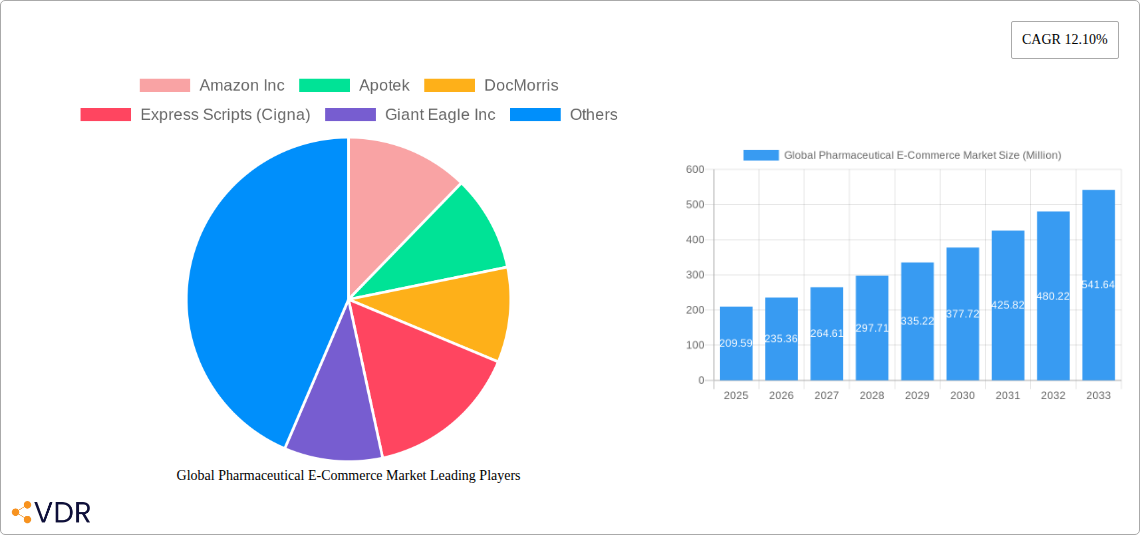
The global pharmaceutical e-commerce market is experiencing robust growth, projected to reach \$209.59 million in 2025 and exhibiting a Compound Annual Growth Rate (CAGR) of 12.10% from 2025 to 2033. This expansion is fueled by several key factors. Increasing internet and smartphone penetration, particularly in emerging markets, is driving greater accessibility to online pharmacies. Consumers are increasingly embracing the convenience and often lower costs associated with online prescription refills and over-the-counter medication purchases. Furthermore, the COVID-19 pandemic significantly accelerated the adoption of telehealth and online pharmacy services, establishing a new normal for many patients. The rise of digital health platforms and telemedicine integration further enhances the market's growth trajectory. Major players like Amazon, CVS Health, and Walgreens are strategically investing in and expanding their online pharmaceutical offerings, intensifying competition and driving innovation within the sector. This competitive landscape is fostering improvements in website design, delivery logistics, and customer service, further boosting market appeal.
However, the market also faces challenges. Stringent regulations regarding online prescription drug sales vary significantly across geographical regions, creating complexities for both businesses and consumers. Concerns surrounding data privacy and security related to sensitive patient information remain a critical obstacle. Counterfeit medication proliferation is another significant risk that demands robust regulatory frameworks and industry collaboration to mitigate. Despite these challenges, the long-term outlook for the global pharmaceutical e-commerce market remains positive, driven by continued technological advancements, changing consumer preferences, and the ongoing expansion of telehealth services. The market is expected to witness considerable diversification with new business models, increased specialization, and the integration of advanced technologies such as AI and blockchain to enhance security and efficiency.
Global Pharmaceutical E-Commerce Market: A Comprehensive Report (2019-2033)
This comprehensive report provides a detailed analysis of the Global Pharmaceutical E-Commerce Market, encompassing market dynamics, growth trends, regional dominance, product landscapes, key players, and future outlooks. The report covers the historical period (2019-2024), base year (2025), and forecast period (2025-2033), offering invaluable insights for industry professionals, investors, and strategic decision-makers. The total market size is projected to reach xx Million units by 2033, demonstrating significant growth potential. The report delves into the parent market of online retail and the child market of pharmaceutical distribution, providing a granular understanding of market segmentation and dynamics.
Global Pharmaceutical E-Commerce Market Dynamics & Structure
The global pharmaceutical e-commerce market exhibits a moderately concentrated structure, with a few large players such as Amazon Inc. and CVS Health holding significant market share. However, the market is also characterized by a substantial number of smaller, regional players, particularly in emerging markets. Technological innovation, specifically in areas like telehealth integration, AI-powered drug discovery, and personalized medicine, are key drivers of market expansion. Regulatory frameworks, including data privacy regulations and prescription drug dispensing guidelines, significantly impact market operations. Competitive product substitutes, such as brick-and-mortar pharmacies, influence market dynamics. End-user demographics, including aging populations and growing internet penetration, contribute to market growth. M&A activity in the sector has been robust, with several large-scale acquisitions and partnerships aimed at enhancing market reach and product offerings.
- Market Concentration: Moderately concentrated, with a few dominant players and many smaller regional players. Amazon and CVS Health hold a combined xx% market share (estimated).
- Technological Innovation: AI-driven drug discovery, telehealth integration, and personalized medicine are major drivers. Barriers include data security concerns and regulatory approvals.
- Regulatory Frameworks: Stringent regulations governing data privacy, prescription drug dispensing, and advertising significantly impact market growth. Variations across regions create complexities.
- Competitive Substitutes: Brick-and-mortar pharmacies remain a significant competitive force, particularly for consumers preferring in-person consultations.
- End-User Demographics: Aging populations and rising internet penetration in developing countries are key factors propelling market growth.
- M&A Activity: Significant M&A activity observed in recent years, with approximately xx deals (estimated) in the last five years, primarily focused on enhancing market reach and expanding product portfolios.
Global Pharmaceutical E-Commerce Market Growth Trends & Insights
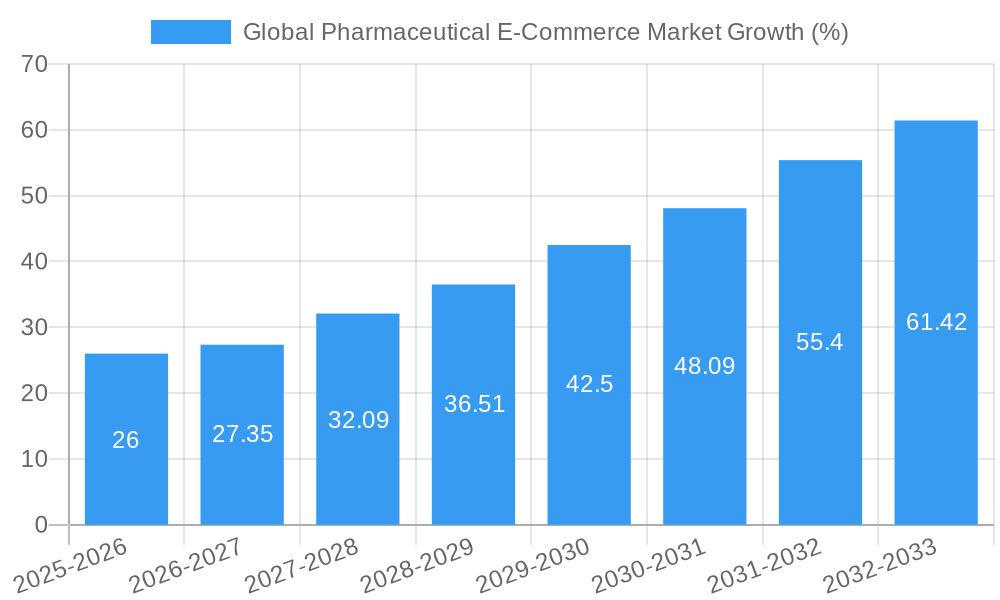
The global pharmaceutical e-commerce market has witnessed substantial growth over the past few years, driven by factors like increasing internet penetration, rising healthcare costs, and the convenience offered by online pharmacies. The market size has grown from xx Million units in 2019 to xx Million units in 2024. The Compound Annual Growth Rate (CAGR) during this period is estimated at xx%. This growth trajectory is projected to continue, with a projected CAGR of xx% from 2025 to 2033. Technological disruptions, such as the integration of artificial intelligence and telemedicine, are accelerating market adoption. Consumer behavior shifts towards online purchasing, especially among younger demographics, are also contributing to market expansion. Market penetration remains relatively low in some regions but is expected to increase significantly.
Dominant Regions, Countries, or Segments in Global Pharmaceutical E-Commerce Market
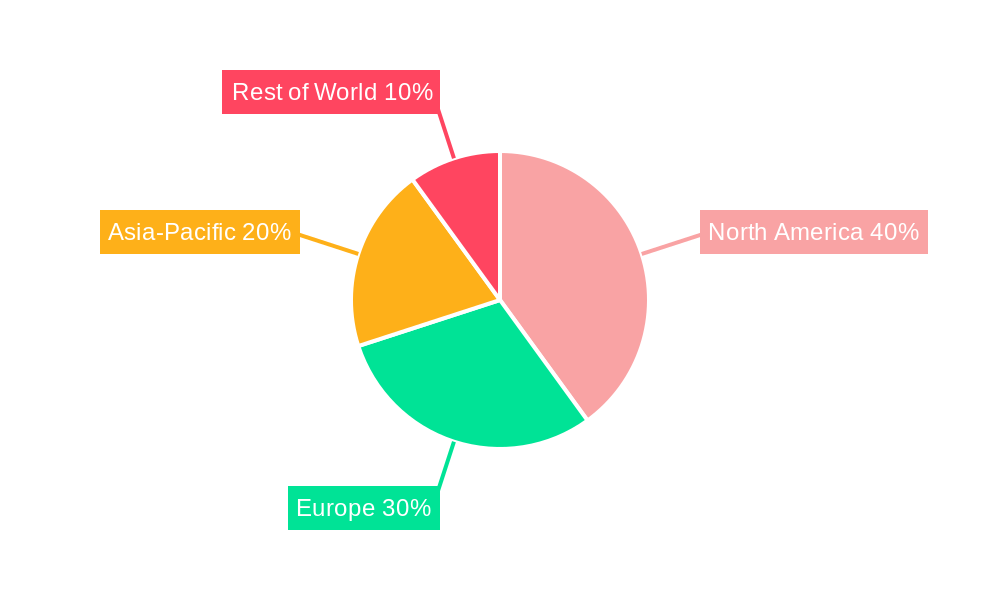
North America currently dominates the global pharmaceutical e-commerce market, holding an estimated xx% market share in 2025. This dominance is primarily attributed to high internet penetration, robust healthcare infrastructure, and a favorable regulatory environment. Europe follows as the second largest market, driven by high technological adoption and a growing aging population. Asia-Pacific is poised for significant growth, fuelled by increasing internet access and rising healthcare expenditure.
- North America: High internet penetration, advanced healthcare infrastructure, and favorable regulations.
- Europe: High technological adoption and a large aging population.
- Asia-Pacific: Rapidly growing internet penetration and increasing healthcare spending.
- Key Drivers: Strong regulatory frameworks, supportive government policies, robust logistics infrastructure, and high consumer trust in online platforms.
Global Pharmaceutical E-Commerce Market Product Landscape
The pharmaceutical e-commerce market offers a wide range of products, including prescription drugs, over-the-counter medications, medical devices, and health supplements. Innovative product offerings include personalized medicine kits, subscription-based medication delivery services, and telehealth integration platforms. The focus is on improving user experience through convenient interfaces, secure payment gateways, and reliable delivery systems. Technological advancements are enhancing product traceability, reducing counterfeiting risks, and improving patient adherence.
Key Drivers, Barriers & Challenges in Global Pharmaceutical E-Commerce Market
Key Drivers: Increased internet and smartphone penetration, rising demand for convenience and accessibility, cost savings compared to traditional pharmacies, personalized medicine, and the integration of telehealth services.
Challenges: Stringent regulatory frameworks concerning data privacy, prescription drug dispensing, and security, concerns about drug counterfeiting, challenges in ensuring secure online transactions, and supply chain complexities. The estimated impact of these challenges results in a xx% reduction in potential market growth.
Emerging Opportunities in Global Pharmaceutical E-Commerce Market
Untapped markets in developing countries present substantial growth opportunities. Expanding into underserved regions with rising internet penetration offers significant potential. Innovative applications, such as AI-powered drug discovery and personalized medicine delivery, are also opening new avenues for growth. Evolving consumer preferences towards convenient and personalized healthcare solutions create a strong demand for customized offerings.
Growth Accelerators in the Global Pharmaceutical E-Commerce Market Industry
Technological advancements, particularly in areas like artificial intelligence, blockchain technology for enhancing supply chain security, and telemedicine platforms for integrating online consultations, will continue to be significant growth catalysts. Strategic partnerships between pharmaceutical companies, online retailers, and telehealth providers will accelerate market expansion. Aggressive market expansion strategies in emerging markets with rising internet penetration are poised to drive long-term growth.
Key Players Shaping the Global Pharmaceutical E-Commerce Market Market
- Amazon Inc
- Apotek
- DocMorris
- Express Scripts (Cigna)
- Giant Eagle Inc
- NetMeds
- Tata 1mg
- Optum Inc (UnitedHealth Group Inc)
- EMedStore
- Walgreen Co
- CVS Health
- Apteka ru
- Rite Aid Corp
- shop-apotheke
- PharmEas
Notable Milestones in Global Pharmaceutical E-Commerce Market Sector
- March 2024: Eli Lilly partnered with Amazon Pharmacy to deliver the weight loss drug Mounjaro and other medicines from its direct-to-consumer website, expanding Amazon's pharmaceutical offerings and boosting Lilly's direct-to-consumer reach.
- January 2024: Eli Lilly and Company launched LillyDirect, a platform offering disease management resources and direct home delivery of select Lilly medicines for people in the United States with obesity, migraine, and diabetes, creating a new direct-to-consumer channel for Lilly.
In-Depth Global Pharmaceutical E-Commerce Market Market Outlook
The future of the pharmaceutical e-commerce market appears bright, with continued growth driven by technological advancements, strategic partnerships, and expanding market penetration. The market is projected to witness significant expansion, particularly in emerging economies, as internet access and healthcare spending increase. Strategic partnerships between online retailers and pharmaceutical companies will play a crucial role in driving future growth, while ongoing technological innovations will enhance the patient experience and improve market efficiency. The overall market potential remains substantial, with significant opportunities for innovation and expansion in the coming years.
Global Pharmaceutical E-Commerce Market Segmentation
-
1. Type
- 1.1. Prescription
- 1.2. Over-the-counter (OTC)
-
2. Product Type
- 2.1. Vaccines
- 2.2. Specialty Care
- 2.3. General Medicines
- 2.4. Consumer Healthcare
-
3. Therapeutic Area
- 3.1. Diabetes
- 3.2. Immune-system Diseases
- 3.3. Cancer
- 3.4. Neurodegenerative Diseases
- 3.5. Cardiovascular Diseases
- 3.6. Other Therapeutic Areas
-
4. Market Type
- 4.1. B2B
- 4.2. B2B2B
- 4.3. B2B2C
-
5. Platform
- 5.1. Manufacturer-owned Digital Commerce
- 5.2. Distributor/Wholesaler-owned Digital Commerce
- 5.3. Manufacturer-owned Marketplace
- 5.4. Third Party Market Place
- 5.5. Retail
Global Pharmaceutical E-Commerce Market Segmentation By Geography
-
1. North America
- 1.1. United States
- 1.2. Canada
- 1.3. Mexico
-
2. Europe
- 2.1. United Kingdom
- 2.2. Germany
- 2.3. France
- 2.4. Italy
- 2.5. Spain
- 2.6. Rest of Europe
-
3. Asia Pacific
- 3.1. China
- 3.2. Japan
- 3.3. India
- 3.4. Australia
- 3.5. South Korea
- 3.6. Rest of Asia Pacific
-
4. Middle East and Africa
- 4.1. GCC
- 4.2. South Africa
- 4.3. Rest of Middle East and Africa
-
5. South America
- 5.1. Brazil
- 5.2. Argentina
- 5.3. Rest of South America
Global Pharmaceutical E-Commerce Market REPORT HIGHLIGHTS
| Aspects | Details |
|---|---|
| Study Period | 2019-2033 |
| Base Year | 2024 |
| Estimated Year | 2025 |
| Forecast Period | 2025-2033 |
| Historical Period | 2019-2024 |
| Growth Rate | CAGR of 12.10% from 2019-2033 |
| Segmentation |
|
Table of Contents
- 1. Introduction
- 1.1. Research Scope
- 1.2. Market Segmentation
- 1.3. Research Methodology
- 1.4. Definitions and Assumptions
- 2. Executive Summary
- 2.1. Introduction
- 3. Market Dynamics
- 3.1. Introduction
- 3.2. Market Drivers
- 3.2.1. Increasing Smartphone Penetration and Growing Demand for E-pharmacies; Rising Prevalence of Chronic Diseases; Convenience and Other Benefits Offered by E-pharmacies
- 3.3. Market Restrains
- 3.3.1. Increasing Smartphone Penetration and Growing Demand for E-pharmacies; Rising Prevalence of Chronic Diseases; Convenience and Other Benefits Offered by E-pharmacies
- 3.4. Market Trends
- 3.4.1. The Cancer Segment is Expected to Exhibit a Significant Growth Rate During the Forecast Period
- 4. Market Factor Analysis
- 4.1. Porters Five Forces
- 4.2. Supply/Value Chain
- 4.3. PESTEL analysis
- 4.4. Market Entropy
- 4.5. Patent/Trademark Analysis
- 5. Global Pharmaceutical E-Commerce Market Analysis, Insights and Forecast, 2019-2031
- 5.1. Market Analysis, Insights and Forecast - by Type
- 5.1.1. Prescription
- 5.1.2. Over-the-counter (OTC)
- 5.2. Market Analysis, Insights and Forecast - by Product Type
- 5.2.1. Vaccines
- 5.2.2. Specialty Care
- 5.2.3. General Medicines
- 5.2.4. Consumer Healthcare
- 5.3. Market Analysis, Insights and Forecast - by Therapeutic Area
- 5.3.1. Diabetes
- 5.3.2. Immune-system Diseases
- 5.3.3. Cancer
- 5.3.4. Neurodegenerative Diseases
- 5.3.5. Cardiovascular Diseases
- 5.3.6. Other Therapeutic Areas
- 5.4. Market Analysis, Insights and Forecast - by Market Type
- 5.4.1. B2B
- 5.4.2. B2B2B
- 5.4.3. B2B2C
- 5.5. Market Analysis, Insights and Forecast - by Platform
- 5.5.1. Manufacturer-owned Digital Commerce
- 5.5.2. Distributor/Wholesaler-owned Digital Commerce
- 5.5.3. Manufacturer-owned Marketplace
- 5.5.4. Third Party Market Place
- 5.5.5. Retail
- 5.6. Market Analysis, Insights and Forecast - by Region
- 5.6.1. North America
- 5.6.2. Europe
- 5.6.3. Asia Pacific
- 5.6.4. Middle East and Africa
- 5.6.5. South America
- 5.1. Market Analysis, Insights and Forecast - by Type
- 6. North America Global Pharmaceutical E-Commerce Market Analysis, Insights and Forecast, 2019-2031
- 6.1. Market Analysis, Insights and Forecast - by Type
- 6.1.1. Prescription
- 6.1.2. Over-the-counter (OTC)
- 6.2. Market Analysis, Insights and Forecast - by Product Type
- 6.2.1. Vaccines
- 6.2.2. Specialty Care
- 6.2.3. General Medicines
- 6.2.4. Consumer Healthcare
- 6.3. Market Analysis, Insights and Forecast - by Therapeutic Area
- 6.3.1. Diabetes
- 6.3.2. Immune-system Diseases
- 6.3.3. Cancer
- 6.3.4. Neurodegenerative Diseases
- 6.3.5. Cardiovascular Diseases
- 6.3.6. Other Therapeutic Areas
- 6.4. Market Analysis, Insights and Forecast - by Market Type
- 6.4.1. B2B
- 6.4.2. B2B2B
- 6.4.3. B2B2C
- 6.5. Market Analysis, Insights and Forecast - by Platform
- 6.5.1. Manufacturer-owned Digital Commerce
- 6.5.2. Distributor/Wholesaler-owned Digital Commerce
- 6.5.3. Manufacturer-owned Marketplace
- 6.5.4. Third Party Market Place
- 6.5.5. Retail
- 6.1. Market Analysis, Insights and Forecast - by Type
- 7. Europe Global Pharmaceutical E-Commerce Market Analysis, Insights and Forecast, 2019-2031
- 7.1. Market Analysis, Insights and Forecast - by Type
- 7.1.1. Prescription
- 7.1.2. Over-the-counter (OTC)
- 7.2. Market Analysis, Insights and Forecast - by Product Type
- 7.2.1. Vaccines
- 7.2.2. Specialty Care
- 7.2.3. General Medicines
- 7.2.4. Consumer Healthcare
- 7.3. Market Analysis, Insights and Forecast - by Therapeutic Area
- 7.3.1. Diabetes
- 7.3.2. Immune-system Diseases
- 7.3.3. Cancer
- 7.3.4. Neurodegenerative Diseases
- 7.3.5. Cardiovascular Diseases
- 7.3.6. Other Therapeutic Areas
- 7.4. Market Analysis, Insights and Forecast - by Market Type
- 7.4.1. B2B
- 7.4.2. B2B2B
- 7.4.3. B2B2C
- 7.5. Market Analysis, Insights and Forecast - by Platform
- 7.5.1. Manufacturer-owned Digital Commerce
- 7.5.2. Distributor/Wholesaler-owned Digital Commerce
- 7.5.3. Manufacturer-owned Marketplace
- 7.5.4. Third Party Market Place
- 7.5.5. Retail
- 7.1. Market Analysis, Insights and Forecast - by Type
- 8. Asia Pacific Global Pharmaceutical E-Commerce Market Analysis, Insights and Forecast, 2019-2031
- 8.1. Market Analysis, Insights and Forecast - by Type
- 8.1.1. Prescription
- 8.1.2. Over-the-counter (OTC)
- 8.2. Market Analysis, Insights and Forecast - by Product Type
- 8.2.1. Vaccines
- 8.2.2. Specialty Care
- 8.2.3. General Medicines
- 8.2.4. Consumer Healthcare
- 8.3. Market Analysis, Insights and Forecast - by Therapeutic Area
- 8.3.1. Diabetes
- 8.3.2. Immune-system Diseases
- 8.3.3. Cancer
- 8.3.4. Neurodegenerative Diseases
- 8.3.5. Cardiovascular Diseases
- 8.3.6. Other Therapeutic Areas
- 8.4. Market Analysis, Insights and Forecast - by Market Type
- 8.4.1. B2B
- 8.4.2. B2B2B
- 8.4.3. B2B2C
- 8.5. Market Analysis, Insights and Forecast - by Platform
- 8.5.1. Manufacturer-owned Digital Commerce
- 8.5.2. Distributor/Wholesaler-owned Digital Commerce
- 8.5.3. Manufacturer-owned Marketplace
- 8.5.4. Third Party Market Place
- 8.5.5. Retail
- 8.1. Market Analysis, Insights and Forecast - by Type
- 9. Middle East and Africa Global Pharmaceutical E-Commerce Market Analysis, Insights and Forecast, 2019-2031
- 9.1. Market Analysis, Insights and Forecast - by Type
- 9.1.1. Prescription
- 9.1.2. Over-the-counter (OTC)
- 9.2. Market Analysis, Insights and Forecast - by Product Type
- 9.2.1. Vaccines
- 9.2.2. Specialty Care
- 9.2.3. General Medicines
- 9.2.4. Consumer Healthcare
- 9.3. Market Analysis, Insights and Forecast - by Therapeutic Area
- 9.3.1. Diabetes
- 9.3.2. Immune-system Diseases
- 9.3.3. Cancer
- 9.3.4. Neurodegenerative Diseases
- 9.3.5. Cardiovascular Diseases
- 9.3.6. Other Therapeutic Areas
- 9.4. Market Analysis, Insights and Forecast - by Market Type
- 9.4.1. B2B
- 9.4.2. B2B2B
- 9.4.3. B2B2C
- 9.5. Market Analysis, Insights and Forecast - by Platform
- 9.5.1. Manufacturer-owned Digital Commerce
- 9.5.2. Distributor/Wholesaler-owned Digital Commerce
- 9.5.3. Manufacturer-owned Marketplace
- 9.5.4. Third Party Market Place
- 9.5.5. Retail
- 9.1. Market Analysis, Insights and Forecast - by Type
- 10. South America Global Pharmaceutical E-Commerce Market Analysis, Insights and Forecast, 2019-2031
- 10.1. Market Analysis, Insights and Forecast - by Type
- 10.1.1. Prescription
- 10.1.2. Over-the-counter (OTC)
- 10.2. Market Analysis, Insights and Forecast - by Product Type
- 10.2.1. Vaccines
- 10.2.2. Specialty Care
- 10.2.3. General Medicines
- 10.2.4. Consumer Healthcare
- 10.3. Market Analysis, Insights and Forecast - by Therapeutic Area
- 10.3.1. Diabetes
- 10.3.2. Immune-system Diseases
- 10.3.3. Cancer
- 10.3.4. Neurodegenerative Diseases
- 10.3.5. Cardiovascular Diseases
- 10.3.6. Other Therapeutic Areas
- 10.4. Market Analysis, Insights and Forecast - by Market Type
- 10.4.1. B2B
- 10.4.2. B2B2B
- 10.4.3. B2B2C
- 10.5. Market Analysis, Insights and Forecast - by Platform
- 10.5.1. Manufacturer-owned Digital Commerce
- 10.5.2. Distributor/Wholesaler-owned Digital Commerce
- 10.5.3. Manufacturer-owned Marketplace
- 10.5.4. Third Party Market Place
- 10.5.5. Retail
- 10.1. Market Analysis, Insights and Forecast - by Type
- 11. Competitive Analysis
- 11.1. Market Share Analysis 2024
- 11.2. Company Profiles
- 11.2.1 Amazon Inc
- 11.2.1.1. Overview
- 11.2.1.2. Products
- 11.2.1.3. SWOT Analysis
- 11.2.1.4. Recent Developments
- 11.2.1.5. Financials (Based on Availability)
- 11.2.2 Apotek
- 11.2.2.1. Overview
- 11.2.2.2. Products
- 11.2.2.3. SWOT Analysis
- 11.2.2.4. Recent Developments
- 11.2.2.5. Financials (Based on Availability)
- 11.2.3 DocMorris
- 11.2.3.1. Overview
- 11.2.3.2. Products
- 11.2.3.3. SWOT Analysis
- 11.2.3.4. Recent Developments
- 11.2.3.5. Financials (Based on Availability)
- 11.2.4 Express Scripts (Cigna)
- 11.2.4.1. Overview
- 11.2.4.2. Products
- 11.2.4.3. SWOT Analysis
- 11.2.4.4. Recent Developments
- 11.2.4.5. Financials (Based on Availability)
- 11.2.5 Giant Eagle Inc
- 11.2.5.1. Overview
- 11.2.5.2. Products
- 11.2.5.3. SWOT Analysis
- 11.2.5.4. Recent Developments
- 11.2.5.5. Financials (Based on Availability)
- 11.2.6 NetMeds
- 11.2.6.1. Overview
- 11.2.6.2. Products
- 11.2.6.3. SWOT Analysis
- 11.2.6.4. Recent Developments
- 11.2.6.5. Financials (Based on Availability)
- 11.2.7 Tata 1mg
- 11.2.7.1. Overview
- 11.2.7.2. Products
- 11.2.7.3. SWOT Analysis
- 11.2.7.4. Recent Developments
- 11.2.7.5. Financials (Based on Availability)
- 11.2.8 �Optum Inc �(UnitedHealth Group Inc )
- 11.2.8.1. Overview
- 11.2.8.2. Products
- 11.2.8.3. SWOT Analysis
- 11.2.8.4. Recent Developments
- 11.2.8.5. Financials (Based on Availability)
- 11.2.9 EMedStore
- 11.2.9.1. Overview
- 11.2.9.2. Products
- 11.2.9.3. SWOT Analysis
- 11.2.9.4. Recent Developments
- 11.2.9.5. Financials (Based on Availability)
- 11.2.10 Walgreen Co
- 11.2.10.1. Overview
- 11.2.10.2. Products
- 11.2.10.3. SWOT Analysis
- 11.2.10.4. Recent Developments
- 11.2.10.5. Financials (Based on Availability)
- 11.2.11 CVS Health
- 11.2.11.1. Overview
- 11.2.11.2. Products
- 11.2.11.3. SWOT Analysis
- 11.2.11.4. Recent Developments
- 11.2.11.5. Financials (Based on Availability)
- 11.2.12 �Apteka ru
- 11.2.12.1. Overview
- 11.2.12.2. Products
- 11.2.12.3. SWOT Analysis
- 11.2.12.4. Recent Developments
- 11.2.12.5. Financials (Based on Availability)
- 11.2.13 Rite Aid Corp
- 11.2.13.1. Overview
- 11.2.13.2. Products
- 11.2.13.3. SWOT Analysis
- 11.2.13.4. Recent Developments
- 11.2.13.5. Financials (Based on Availability)
- 11.2.14 shop-apotheke
- 11.2.14.1. Overview
- 11.2.14.2. Products
- 11.2.14.3. SWOT Analysis
- 11.2.14.4. Recent Developments
- 11.2.14.5. Financials (Based on Availability)
- 11.2.15 PharmEas
- 11.2.15.1. Overview
- 11.2.15.2. Products
- 11.2.15.3. SWOT Analysis
- 11.2.15.4. Recent Developments
- 11.2.15.5. Financials (Based on Availability)
- 11.2.1 Amazon Inc
List of Figures
- Figure 1: Global Global Pharmaceutical E-Commerce Market Revenue Breakdown (Million, %) by Region 2024 & 2032
- Figure 2: Global Global Pharmaceutical E-Commerce Market Volume Breakdown (Billion, %) by Region 2024 & 2032
- Figure 3: North America Global Pharmaceutical E-Commerce Market Revenue (Million), by Type 2024 & 2032
- Figure 4: North America Global Pharmaceutical E-Commerce Market Volume (Billion), by Type 2024 & 2032
- Figure 5: North America Global Pharmaceutical E-Commerce Market Revenue Share (%), by Type 2024 & 2032
- Figure 6: North America Global Pharmaceutical E-Commerce Market Volume Share (%), by Type 2024 & 2032
- Figure 7: North America Global Pharmaceutical E-Commerce Market Revenue (Million), by Product Type 2024 & 2032
- Figure 8: North America Global Pharmaceutical E-Commerce Market Volume (Billion), by Product Type 2024 & 2032
- Figure 9: North America Global Pharmaceutical E-Commerce Market Revenue Share (%), by Product Type 2024 & 2032
- Figure 10: North America Global Pharmaceutical E-Commerce Market Volume Share (%), by Product Type 2024 & 2032
- Figure 11: North America Global Pharmaceutical E-Commerce Market Revenue (Million), by Therapeutic Area 2024 & 2032
- Figure 12: North America Global Pharmaceutical E-Commerce Market Volume (Billion), by Therapeutic Area 2024 & 2032
- Figure 13: North America Global Pharmaceutical E-Commerce Market Revenue Share (%), by Therapeutic Area 2024 & 2032
- Figure 14: North America Global Pharmaceutical E-Commerce Market Volume Share (%), by Therapeutic Area 2024 & 2032
- Figure 15: North America Global Pharmaceutical E-Commerce Market Revenue (Million), by Market Type 2024 & 2032
- Figure 16: North America Global Pharmaceutical E-Commerce Market Volume (Billion), by Market Type 2024 & 2032
- Figure 17: North America Global Pharmaceutical E-Commerce Market Revenue Share (%), by Market Type 2024 & 2032
- Figure 18: North America Global Pharmaceutical E-Commerce Market Volume Share (%), by Market Type 2024 & 2032
- Figure 19: North America Global Pharmaceutical E-Commerce Market Revenue (Million), by Platform 2024 & 2032
- Figure 20: North America Global Pharmaceutical E-Commerce Market Volume (Billion), by Platform 2024 & 2032
- Figure 21: North America Global Pharmaceutical E-Commerce Market Revenue Share (%), by Platform 2024 & 2032
- Figure 22: North America Global Pharmaceutical E-Commerce Market Volume Share (%), by Platform 2024 & 2032
- Figure 23: North America Global Pharmaceutical E-Commerce Market Revenue (Million), by Country 2024 & 2032
- Figure 24: North America Global Pharmaceutical E-Commerce Market Volume (Billion), by Country 2024 & 2032
- Figure 25: North America Global Pharmaceutical E-Commerce Market Revenue Share (%), by Country 2024 & 2032
- Figure 26: North America Global Pharmaceutical E-Commerce Market Volume Share (%), by Country 2024 & 2032
- Figure 27: Europe Global Pharmaceutical E-Commerce Market Revenue (Million), by Type 2024 & 2032
- Figure 28: Europe Global Pharmaceutical E-Commerce Market Volume (Billion), by Type 2024 & 2032
- Figure 29: Europe Global Pharmaceutical E-Commerce Market Revenue Share (%), by Type 2024 & 2032
- Figure 30: Europe Global Pharmaceutical E-Commerce Market Volume Share (%), by Type 2024 & 2032
- Figure 31: Europe Global Pharmaceutical E-Commerce Market Revenue (Million), by Product Type 2024 & 2032
- Figure 32: Europe Global Pharmaceutical E-Commerce Market Volume (Billion), by Product Type 2024 & 2032
- Figure 33: Europe Global Pharmaceutical E-Commerce Market Revenue Share (%), by Product Type 2024 & 2032
- Figure 34: Europe Global Pharmaceutical E-Commerce Market Volume Share (%), by Product Type 2024 & 2032
- Figure 35: Europe Global Pharmaceutical E-Commerce Market Revenue (Million), by Therapeutic Area 2024 & 2032
- Figure 36: Europe Global Pharmaceutical E-Commerce Market Volume (Billion), by Therapeutic Area 2024 & 2032
- Figure 37: Europe Global Pharmaceutical E-Commerce Market Revenue Share (%), by Therapeutic Area 2024 & 2032
- Figure 38: Europe Global Pharmaceutical E-Commerce Market Volume Share (%), by Therapeutic Area 2024 & 2032
- Figure 39: Europe Global Pharmaceutical E-Commerce Market Revenue (Million), by Market Type 2024 & 2032
- Figure 40: Europe Global Pharmaceutical E-Commerce Market Volume (Billion), by Market Type 2024 & 2032
- Figure 41: Europe Global Pharmaceutical E-Commerce Market Revenue Share (%), by Market Type 2024 & 2032
- Figure 42: Europe Global Pharmaceutical E-Commerce Market Volume Share (%), by Market Type 2024 & 2032
- Figure 43: Europe Global Pharmaceutical E-Commerce Market Revenue (Million), by Platform 2024 & 2032
- Figure 44: Europe Global Pharmaceutical E-Commerce Market Volume (Billion), by Platform 2024 & 2032
- Figure 45: Europe Global Pharmaceutical E-Commerce Market Revenue Share (%), by Platform 2024 & 2032
- Figure 46: Europe Global Pharmaceutical E-Commerce Market Volume Share (%), by Platform 2024 & 2032
- Figure 47: Europe Global Pharmaceutical E-Commerce Market Revenue (Million), by Country 2024 & 2032
- Figure 48: Europe Global Pharmaceutical E-Commerce Market Volume (Billion), by Country 2024 & 2032
- Figure 49: Europe Global Pharmaceutical E-Commerce Market Revenue Share (%), by Country 2024 & 2032
- Figure 50: Europe Global Pharmaceutical E-Commerce Market Volume Share (%), by Country 2024 & 2032
- Figure 51: Asia Pacific Global Pharmaceutical E-Commerce Market Revenue (Million), by Type 2024 & 2032
- Figure 52: Asia Pacific Global Pharmaceutical E-Commerce Market Volume (Billion), by Type 2024 & 2032
- Figure 53: Asia Pacific Global Pharmaceutical E-Commerce Market Revenue Share (%), by Type 2024 & 2032
- Figure 54: Asia Pacific Global Pharmaceutical E-Commerce Market Volume Share (%), by Type 2024 & 2032
- Figure 55: Asia Pacific Global Pharmaceutical E-Commerce Market Revenue (Million), by Product Type 2024 & 2032
- Figure 56: Asia Pacific Global Pharmaceutical E-Commerce Market Volume (Billion), by Product Type 2024 & 2032
- Figure 57: Asia Pacific Global Pharmaceutical E-Commerce Market Revenue Share (%), by Product Type 2024 & 2032
- Figure 58: Asia Pacific Global Pharmaceutical E-Commerce Market Volume Share (%), by Product Type 2024 & 2032
- Figure 59: Asia Pacific Global Pharmaceutical E-Commerce Market Revenue (Million), by Therapeutic Area 2024 & 2032
- Figure 60: Asia Pacific Global Pharmaceutical E-Commerce Market Volume (Billion), by Therapeutic Area 2024 & 2032
- Figure 61: Asia Pacific Global Pharmaceutical E-Commerce Market Revenue Share (%), by Therapeutic Area 2024 & 2032
- Figure 62: Asia Pacific Global Pharmaceutical E-Commerce Market Volume Share (%), by Therapeutic Area 2024 & 2032
- Figure 63: Asia Pacific Global Pharmaceutical E-Commerce Market Revenue (Million), by Market Type 2024 & 2032
- Figure 64: Asia Pacific Global Pharmaceutical E-Commerce Market Volume (Billion), by Market Type 2024 & 2032
- Figure 65: Asia Pacific Global Pharmaceutical E-Commerce Market Revenue Share (%), by Market Type 2024 & 2032
- Figure 66: Asia Pacific Global Pharmaceutical E-Commerce Market Volume Share (%), by Market Type 2024 & 2032
- Figure 67: Asia Pacific Global Pharmaceutical E-Commerce Market Revenue (Million), by Platform 2024 & 2032
- Figure 68: Asia Pacific Global Pharmaceutical E-Commerce Market Volume (Billion), by Platform 2024 & 2032
- Figure 69: Asia Pacific Global Pharmaceutical E-Commerce Market Revenue Share (%), by Platform 2024 & 2032
- Figure 70: Asia Pacific Global Pharmaceutical E-Commerce Market Volume Share (%), by Platform 2024 & 2032
- Figure 71: Asia Pacific Global Pharmaceutical E-Commerce Market Revenue (Million), by Country 2024 & 2032
- Figure 72: Asia Pacific Global Pharmaceutical E-Commerce Market Volume (Billion), by Country 2024 & 2032
- Figure 73: Asia Pacific Global Pharmaceutical E-Commerce Market Revenue Share (%), by Country 2024 & 2032
- Figure 74: Asia Pacific Global Pharmaceutical E-Commerce Market Volume Share (%), by Country 2024 & 2032
- Figure 75: Middle East and Africa Global Pharmaceutical E-Commerce Market Revenue (Million), by Type 2024 & 2032
- Figure 76: Middle East and Africa Global Pharmaceutical E-Commerce Market Volume (Billion), by Type 2024 & 2032
- Figure 77: Middle East and Africa Global Pharmaceutical E-Commerce Market Revenue Share (%), by Type 2024 & 2032
- Figure 78: Middle East and Africa Global Pharmaceutical E-Commerce Market Volume Share (%), by Type 2024 & 2032
- Figure 79: Middle East and Africa Global Pharmaceutical E-Commerce Market Revenue (Million), by Product Type 2024 & 2032
- Figure 80: Middle East and Africa Global Pharmaceutical E-Commerce Market Volume (Billion), by Product Type 2024 & 2032
- Figure 81: Middle East and Africa Global Pharmaceutical E-Commerce Market Revenue Share (%), by Product Type 2024 & 2032
- Figure 82: Middle East and Africa Global Pharmaceutical E-Commerce Market Volume Share (%), by Product Type 2024 & 2032
- Figure 83: Middle East and Africa Global Pharmaceutical E-Commerce Market Revenue (Million), by Therapeutic Area 2024 & 2032
- Figure 84: Middle East and Africa Global Pharmaceutical E-Commerce Market Volume (Billion), by Therapeutic Area 2024 & 2032
- Figure 85: Middle East and Africa Global Pharmaceutical E-Commerce Market Revenue Share (%), by Therapeutic Area 2024 & 2032
- Figure 86: Middle East and Africa Global Pharmaceutical E-Commerce Market Volume Share (%), by Therapeutic Area 2024 & 2032
- Figure 87: Middle East and Africa Global Pharmaceutical E-Commerce Market Revenue (Million), by Market Type 2024 & 2032
- Figure 88: Middle East and Africa Global Pharmaceutical E-Commerce Market Volume (Billion), by Market Type 2024 & 2032
- Figure 89: Middle East and Africa Global Pharmaceutical E-Commerce Market Revenue Share (%), by Market Type 2024 & 2032
- Figure 90: Middle East and Africa Global Pharmaceutical E-Commerce Market Volume Share (%), by Market Type 2024 & 2032
- Figure 91: Middle East and Africa Global Pharmaceutical E-Commerce Market Revenue (Million), by Platform 2024 & 2032
- Figure 92: Middle East and Africa Global Pharmaceutical E-Commerce Market Volume (Billion), by Platform 2024 & 2032
- Figure 93: Middle East and Africa Global Pharmaceutical E-Commerce Market Revenue Share (%), by Platform 2024 & 2032
- Figure 94: Middle East and Africa Global Pharmaceutical E-Commerce Market Volume Share (%), by Platform 2024 & 2032
- Figure 95: Middle East and Africa Global Pharmaceutical E-Commerce Market Revenue (Million), by Country 2024 & 2032
- Figure 96: Middle East and Africa Global Pharmaceutical E-Commerce Market Volume (Billion), by Country 2024 & 2032
- Figure 97: Middle East and Africa Global Pharmaceutical E-Commerce Market Revenue Share (%), by Country 2024 & 2032
- Figure 98: Middle East and Africa Global Pharmaceutical E-Commerce Market Volume Share (%), by Country 2024 & 2032
- Figure 99: South America Global Pharmaceutical E-Commerce Market Revenue (Million), by Type 2024 & 2032
- Figure 100: South America Global Pharmaceutical E-Commerce Market Volume (Billion), by Type 2024 & 2032
- Figure 101: South America Global Pharmaceutical E-Commerce Market Revenue Share (%), by Type 2024 & 2032
- Figure 102: South America Global Pharmaceutical E-Commerce Market Volume Share (%), by Type 2024 & 2032
- Figure 103: South America Global Pharmaceutical E-Commerce Market Revenue (Million), by Product Type 2024 & 2032
- Figure 104: South America Global Pharmaceutical E-Commerce Market Volume (Billion), by Product Type 2024 & 2032
- Figure 105: South America Global Pharmaceutical E-Commerce Market Revenue Share (%), by Product Type 2024 & 2032
- Figure 106: South America Global Pharmaceutical E-Commerce Market Volume Share (%), by Product Type 2024 & 2032
- Figure 107: South America Global Pharmaceutical E-Commerce Market Revenue (Million), by Therapeutic Area 2024 & 2032
- Figure 108: South America Global Pharmaceutical E-Commerce Market Volume (Billion), by Therapeutic Area 2024 & 2032
- Figure 109: South America Global Pharmaceutical E-Commerce Market Revenue Share (%), by Therapeutic Area 2024 & 2032
- Figure 110: South America Global Pharmaceutical E-Commerce Market Volume Share (%), by Therapeutic Area 2024 & 2032
- Figure 111: South America Global Pharmaceutical E-Commerce Market Revenue (Million), by Market Type 2024 & 2032
- Figure 112: South America Global Pharmaceutical E-Commerce Market Volume (Billion), by Market Type 2024 & 2032
- Figure 113: South America Global Pharmaceutical E-Commerce Market Revenue Share (%), by Market Type 2024 & 2032
- Figure 114: South America Global Pharmaceutical E-Commerce Market Volume Share (%), by Market Type 2024 & 2032
- Figure 115: South America Global Pharmaceutical E-Commerce Market Revenue (Million), by Platform 2024 & 2032
- Figure 116: South America Global Pharmaceutical E-Commerce Market Volume (Billion), by Platform 2024 & 2032
- Figure 117: South America Global Pharmaceutical E-Commerce Market Revenue Share (%), by Platform 2024 & 2032
- Figure 118: South America Global Pharmaceutical E-Commerce Market Volume Share (%), by Platform 2024 & 2032
- Figure 119: South America Global Pharmaceutical E-Commerce Market Revenue (Million), by Country 2024 & 2032
- Figure 120: South America Global Pharmaceutical E-Commerce Market Volume (Billion), by Country 2024 & 2032
- Figure 121: South America Global Pharmaceutical E-Commerce Market Revenue Share (%), by Country 2024 & 2032
- Figure 122: South America Global Pharmaceutical E-Commerce Market Volume Share (%), by Country 2024 & 2032
List of Tables
- Table 1: Global Pharmaceutical E-Commerce Market Revenue Million Forecast, by Region 2019 & 2032
- Table 2: Global Pharmaceutical E-Commerce Market Volume Billion Forecast, by Region 2019 & 2032
- Table 3: Global Pharmaceutical E-Commerce Market Revenue Million Forecast, by Type 2019 & 2032
- Table 4: Global Pharmaceutical E-Commerce Market Volume Billion Forecast, by Type 2019 & 2032
- Table 5: Global Pharmaceutical E-Commerce Market Revenue Million Forecast, by Product Type 2019 & 2032
- Table 6: Global Pharmaceutical E-Commerce Market Volume Billion Forecast, by Product Type 2019 & 2032
- Table 7: Global Pharmaceutical E-Commerce Market Revenue Million Forecast, by Therapeutic Area 2019 & 2032
- Table 8: Global Pharmaceutical E-Commerce Market Volume Billion Forecast, by Therapeutic Area 2019 & 2032
- Table 9: Global Pharmaceutical E-Commerce Market Revenue Million Forecast, by Market Type 2019 & 2032
- Table 10: Global Pharmaceutical E-Commerce Market Volume Billion Forecast, by Market Type 2019 & 2032
- Table 11: Global Pharmaceutical E-Commerce Market Revenue Million Forecast, by Platform 2019 & 2032
- Table 12: Global Pharmaceutical E-Commerce Market Volume Billion Forecast, by Platform 2019 & 2032
- Table 13: Global Pharmaceutical E-Commerce Market Revenue Million Forecast, by Region 2019 & 2032
- Table 14: Global Pharmaceutical E-Commerce Market Volume Billion Forecast, by Region 2019 & 2032
- Table 15: Global Pharmaceutical E-Commerce Market Revenue Million Forecast, by Type 2019 & 2032
- Table 16: Global Pharmaceutical E-Commerce Market Volume Billion Forecast, by Type 2019 & 2032
- Table 17: Global Pharmaceutical E-Commerce Market Revenue Million Forecast, by Product Type 2019 & 2032
- Table 18: Global Pharmaceutical E-Commerce Market Volume Billion Forecast, by Product Type 2019 & 2032
- Table 19: Global Pharmaceutical E-Commerce Market Revenue Million Forecast, by Therapeutic Area 2019 & 2032
- Table 20: Global Pharmaceutical E-Commerce Market Volume Billion Forecast, by Therapeutic Area 2019 & 2032
- Table 21: Global Pharmaceutical E-Commerce Market Revenue Million Forecast, by Market Type 2019 & 2032
- Table 22: Global Pharmaceutical E-Commerce Market Volume Billion Forecast, by Market Type 2019 & 2032
- Table 23: Global Pharmaceutical E-Commerce Market Revenue Million Forecast, by Platform 2019 & 2032
- Table 24: Global Pharmaceutical E-Commerce Market Volume Billion Forecast, by Platform 2019 & 2032
- Table 25: Global Pharmaceutical E-Commerce Market Revenue Million Forecast, by Country 2019 & 2032
- Table 26: Global Pharmaceutical E-Commerce Market Volume Billion Forecast, by Country 2019 & 2032
- Table 27: United States Global Pharmaceutical E-Commerce Market Revenue (Million) Forecast, by Application 2019 & 2032
- Table 28: United States Global Pharmaceutical E-Commerce Market Volume (Billion) Forecast, by Application 2019 & 2032
- Table 29: Canada Global Pharmaceutical E-Commerce Market Revenue (Million) Forecast, by Application 2019 & 2032
- Table 30: Canada Global Pharmaceutical E-Commerce Market Volume (Billion) Forecast, by Application 2019 & 2032
- Table 31: Mexico Global Pharmaceutical E-Commerce Market Revenue (Million) Forecast, by Application 2019 & 2032
- Table 32: Mexico Global Pharmaceutical E-Commerce Market Volume (Billion) Forecast, by Application 2019 & 2032
- Table 33: Global Pharmaceutical E-Commerce Market Revenue Million Forecast, by Type 2019 & 2032
- Table 34: Global Pharmaceutical E-Commerce Market Volume Billion Forecast, by Type 2019 & 2032
- Table 35: Global Pharmaceutical E-Commerce Market Revenue Million Forecast, by Product Type 2019 & 2032
- Table 36: Global Pharmaceutical E-Commerce Market Volume Billion Forecast, by Product Type 2019 & 2032
- Table 37: Global Pharmaceutical E-Commerce Market Revenue Million Forecast, by Therapeutic Area 2019 & 2032
- Table 38: Global Pharmaceutical E-Commerce Market Volume Billion Forecast, by Therapeutic Area 2019 & 2032
- Table 39: Global Pharmaceutical E-Commerce Market Revenue Million Forecast, by Market Type 2019 & 2032
- Table 40: Global Pharmaceutical E-Commerce Market Volume Billion Forecast, by Market Type 2019 & 2032
- Table 41: Global Pharmaceutical E-Commerce Market Revenue Million Forecast, by Platform 2019 & 2032
- Table 42: Global Pharmaceutical E-Commerce Market Volume Billion Forecast, by Platform 2019 & 2032
- Table 43: Global Pharmaceutical E-Commerce Market Revenue Million Forecast, by Country 2019 & 2032
- Table 44: Global Pharmaceutical E-Commerce Market Volume Billion Forecast, by Country 2019 & 2032
- Table 45: United Kingdom Global Pharmaceutical E-Commerce Market Revenue (Million) Forecast, by Application 2019 & 2032
- Table 46: United Kingdom Global Pharmaceutical E-Commerce Market Volume (Billion) Forecast, by Application 2019 & 2032
- Table 47: Germany Global Pharmaceutical E-Commerce Market Revenue (Million) Forecast, by Application 2019 & 2032
- Table 48: Germany Global Pharmaceutical E-Commerce Market Volume (Billion) Forecast, by Application 2019 & 2032
- Table 49: France Global Pharmaceutical E-Commerce Market Revenue (Million) Forecast, by Application 2019 & 2032
- Table 50: France Global Pharmaceutical E-Commerce Market Volume (Billion) Forecast, by Application 2019 & 2032
- Table 51: Italy Global Pharmaceutical E-Commerce Market Revenue (Million) Forecast, by Application 2019 & 2032
- Table 52: Italy Global Pharmaceutical E-Commerce Market Volume (Billion) Forecast, by Application 2019 & 2032
- Table 53: Spain Global Pharmaceutical E-Commerce Market Revenue (Million) Forecast, by Application 2019 & 2032
- Table 54: Spain Global Pharmaceutical E-Commerce Market Volume (Billion) Forecast, by Application 2019 & 2032
- Table 55: Rest of Europe Global Pharmaceutical E-Commerce Market Revenue (Million) Forecast, by Application 2019 & 2032
- Table 56: Rest of Europe Global Pharmaceutical E-Commerce Market Volume (Billion) Forecast, by Application 2019 & 2032
- Table 57: Global Pharmaceutical E-Commerce Market Revenue Million Forecast, by Type 2019 & 2032
- Table 58: Global Pharmaceutical E-Commerce Market Volume Billion Forecast, by Type 2019 & 2032
- Table 59: Global Pharmaceutical E-Commerce Market Revenue Million Forecast, by Product Type 2019 & 2032
- Table 60: Global Pharmaceutical E-Commerce Market Volume Billion Forecast, by Product Type 2019 & 2032
- Table 61: Global Pharmaceutical E-Commerce Market Revenue Million Forecast, by Therapeutic Area 2019 & 2032
- Table 62: Global Pharmaceutical E-Commerce Market Volume Billion Forecast, by Therapeutic Area 2019 & 2032
- Table 63: Global Pharmaceutical E-Commerce Market Revenue Million Forecast, by Market Type 2019 & 2032
- Table 64: Global Pharmaceutical E-Commerce Market Volume Billion Forecast, by Market Type 2019 & 2032
- Table 65: Global Pharmaceutical E-Commerce Market Revenue Million Forecast, by Platform 2019 & 2032
- Table 66: Global Pharmaceutical E-Commerce Market Volume Billion Forecast, by Platform 2019 & 2032
- Table 67: Global Pharmaceutical E-Commerce Market Revenue Million Forecast, by Country 2019 & 2032
- Table 68: Global Pharmaceutical E-Commerce Market Volume Billion Forecast, by Country 2019 & 2032
- Table 69: China Global Pharmaceutical E-Commerce Market Revenue (Million) Forecast, by Application 2019 & 2032
- Table 70: China Global Pharmaceutical E-Commerce Market Volume (Billion) Forecast, by Application 2019 & 2032
- Table 71: Japan Global Pharmaceutical E-Commerce Market Revenue (Million) Forecast, by Application 2019 & 2032
- Table 72: Japan Global Pharmaceutical E-Commerce Market Volume (Billion) Forecast, by Application 2019 & 2032
- Table 73: India Global Pharmaceutical E-Commerce Market Revenue (Million) Forecast, by Application 2019 & 2032
- Table 74: India Global Pharmaceutical E-Commerce Market Volume (Billion) Forecast, by Application 2019 & 2032
- Table 75: Australia Global Pharmaceutical E-Commerce Market Revenue (Million) Forecast, by Application 2019 & 2032
- Table 76: Australia Global Pharmaceutical E-Commerce Market Volume (Billion) Forecast, by Application 2019 & 2032
- Table 77: South Korea Global Pharmaceutical E-Commerce Market Revenue (Million) Forecast, by Application 2019 & 2032
- Table 78: South Korea Global Pharmaceutical E-Commerce Market Volume (Billion) Forecast, by Application 2019 & 2032
- Table 79: Rest of Asia Pacific Global Pharmaceutical E-Commerce Market Revenue (Million) Forecast, by Application 2019 & 2032
- Table 80: Rest of Asia Pacific Global Pharmaceutical E-Commerce Market Volume (Billion) Forecast, by Application 2019 & 2032
- Table 81: Global Pharmaceutical E-Commerce Market Revenue Million Forecast, by Type 2019 & 2032
- Table 82: Global Pharmaceutical E-Commerce Market Volume Billion Forecast, by Type 2019 & 2032
- Table 83: Global Pharmaceutical E-Commerce Market Revenue Million Forecast, by Product Type 2019 & 2032
- Table 84: Global Pharmaceutical E-Commerce Market Volume Billion Forecast, by Product Type 2019 & 2032
- Table 85: Global Pharmaceutical E-Commerce Market Revenue Million Forecast, by Therapeutic Area 2019 & 2032
- Table 86: Global Pharmaceutical E-Commerce Market Volume Billion Forecast, by Therapeutic Area 2019 & 2032
- Table 87: Global Pharmaceutical E-Commerce Market Revenue Million Forecast, by Market Type 2019 & 2032
- Table 88: Global Pharmaceutical E-Commerce Market Volume Billion Forecast, by Market Type 2019 & 2032
- Table 89: Global Pharmaceutical E-Commerce Market Revenue Million Forecast, by Platform 2019 & 2032
- Table 90: Global Pharmaceutical E-Commerce Market Volume Billion Forecast, by Platform 2019 & 2032
- Table 91: Global Pharmaceutical E-Commerce Market Revenue Million Forecast, by Country 2019 & 2032
- Table 92: Global Pharmaceutical E-Commerce Market Volume Billion Forecast, by Country 2019 & 2032
- Table 93: GCC Global Pharmaceutical E-Commerce Market Revenue (Million) Forecast, by Application 2019 & 2032
- Table 94: GCC Global Pharmaceutical E-Commerce Market Volume (Billion) Forecast, by Application 2019 & 2032
- Table 95: South Africa Global Pharmaceutical E-Commerce Market Revenue (Million) Forecast, by Application 2019 & 2032
- Table 96: South Africa Global Pharmaceutical E-Commerce Market Volume (Billion) Forecast, by Application 2019 & 2032
- Table 97: Rest of Middle East and Africa Global Pharmaceutical E-Commerce Market Revenue (Million) Forecast, by Application 2019 & 2032
- Table 98: Rest of Middle East and Africa Global Pharmaceutical E-Commerce Market Volume (Billion) Forecast, by Application 2019 & 2032
- Table 99: Global Pharmaceutical E-Commerce Market Revenue Million Forecast, by Type 2019 & 2032
- Table 100: Global Pharmaceutical E-Commerce Market Volume Billion Forecast, by Type 2019 & 2032
- Table 101: Global Pharmaceutical E-Commerce Market Revenue Million Forecast, by Product Type 2019 & 2032
- Table 102: Global Pharmaceutical E-Commerce Market Volume Billion Forecast, by Product Type 2019 & 2032
- Table 103: Global Pharmaceutical E-Commerce Market Revenue Million Forecast, by Therapeutic Area 2019 & 2032
- Table 104: Global Pharmaceutical E-Commerce Market Volume Billion Forecast, by Therapeutic Area 2019 & 2032
- Table 105: Global Pharmaceutical E-Commerce Market Revenue Million Forecast, by Market Type 2019 & 2032
- Table 106: Global Pharmaceutical E-Commerce Market Volume Billion Forecast, by Market Type 2019 & 2032
- Table 107: Global Pharmaceutical E-Commerce Market Revenue Million Forecast, by Platform 2019 & 2032
- Table 108: Global Pharmaceutical E-Commerce Market Volume Billion Forecast, by Platform 2019 & 2032
- Table 109: Global Pharmaceutical E-Commerce Market Revenue Million Forecast, by Country 2019 & 2032
- Table 110: Global Pharmaceutical E-Commerce Market Volume Billion Forecast, by Country 2019 & 2032
- Table 111: Brazil Global Pharmaceutical E-Commerce Market Revenue (Million) Forecast, by Application 2019 & 2032
- Table 112: Brazil Global Pharmaceutical E-Commerce Market Volume (Billion) Forecast, by Application 2019 & 2032
- Table 113: Argentina Global Pharmaceutical E-Commerce Market Revenue (Million) Forecast, by Application 2019 & 2032
- Table 114: Argentina Global Pharmaceutical E-Commerce Market Volume (Billion) Forecast, by Application 2019 & 2032
- Table 115: Rest of South America Global Pharmaceutical E-Commerce Market Revenue (Million) Forecast, by Application 2019 & 2032
- Table 116: Rest of South America Global Pharmaceutical E-Commerce Market Volume (Billion) Forecast, by Application 2019 & 2032
Frequently Asked Questions
1. What is the projected Compound Annual Growth Rate (CAGR) of the Global Pharmaceutical E-Commerce Market?
The projected CAGR is approximately 12.10%.
2. Which companies are prominent players in the Global Pharmaceutical E-Commerce Market?
Key companies in the market include Amazon Inc, Apotek, DocMorris, Express Scripts (Cigna), Giant Eagle Inc, NetMeds, Tata 1mg, �Optum Inc �(UnitedHealth Group Inc ), EMedStore, Walgreen Co, CVS Health, �Apteka ru, Rite Aid Corp, shop-apotheke, PharmEas.
3. What are the main segments of the Global Pharmaceutical E-Commerce Market?
The market segments include Type, Product Type, Therapeutic Area, Market Type, Platform.
4. Can you provide details about the market size?
The market size is estimated to be USD 209.59 Million as of 2022.
5. What are some drivers contributing to market growth?
Increasing Smartphone Penetration and Growing Demand for E-pharmacies; Rising Prevalence of Chronic Diseases; Convenience and Other Benefits Offered by E-pharmacies.
6. What are the notable trends driving market growth?
The Cancer Segment is Expected to Exhibit a Significant Growth Rate During the Forecast Period.
7. Are there any restraints impacting market growth?
Increasing Smartphone Penetration and Growing Demand for E-pharmacies; Rising Prevalence of Chronic Diseases; Convenience and Other Benefits Offered by E-pharmacies.
8. Can you provide examples of recent developments in the market?
March 2024: Eli Lilly partnered with Amazon Pharmacy to deliver the weight loss drug Zepbound and other medicines from its direct-to-consumer website.
9. What pricing options are available for accessing the report?
Pricing options include single-user, multi-user, and enterprise licenses priced at USD 4750, USD 5250, and USD 8750 respectively.
10. Is the market size provided in terms of value or volume?
The market size is provided in terms of value, measured in Million and volume, measured in Billion.
11. Are there any specific market keywords associated with the report?
Yes, the market keyword associated with the report is "Global Pharmaceutical E-Commerce Market," which aids in identifying and referencing the specific market segment covered.
12. How do I determine which pricing option suits my needs best?
The pricing options vary based on user requirements and access needs. Individual users may opt for single-user licenses, while businesses requiring broader access may choose multi-user or enterprise licenses for cost-effective access to the report.
13. Are there any additional resources or data provided in the Global Pharmaceutical E-Commerce Market report?
While the report offers comprehensive insights, it's advisable to review the specific contents or supplementary materials provided to ascertain if additional resources or data are available.
14. How can I stay updated on further developments or reports in the Global Pharmaceutical E-Commerce Market?
To stay informed about further developments, trends, and reports in the Global Pharmaceutical E-Commerce Market, consider subscribing to industry newsletters, following relevant companies and organizations, or regularly checking reputable industry news sources and publications.
Methodology
Step 1 - Identification of Relevant Samples Size from Population Database


Step 2 - Approaches for Defining Global Market Size (Value, Volume* & Price*)

Note*: In applicable scenarios
Step 3 - Data Sources
Primary Research
- Web Analytics
- Survey Reports
- Research Institute
- Latest Research Reports
- Opinion Leaders
Secondary Research
- Annual Reports
- White Paper
- Latest Press Release
- Industry Association
- Paid Database
- Investor Presentations

Step 4 - Data Triangulation
Involves using different sources of information in order to increase the validity of a study
These sources are likely to be stakeholders in a program - participants, other researchers, program staff, other community members, and so on.
Then we put all data in single framework & apply various statistical tools to find out the dynamic on the market.
During the analysis stage, feedback from the stakeholder groups would be compared to determine areas of agreement as well as areas of divergence


