
Key Insights
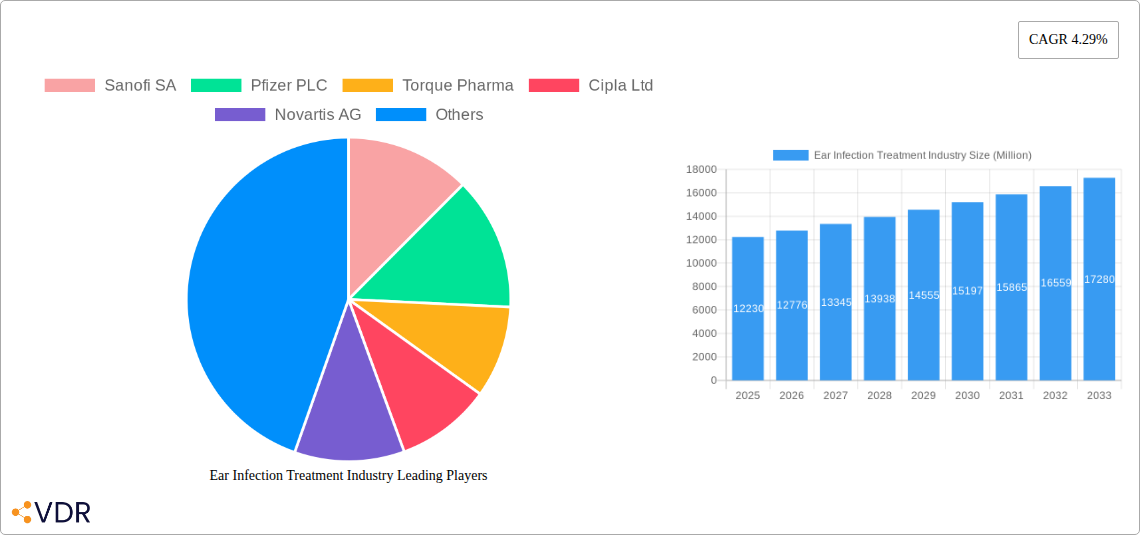
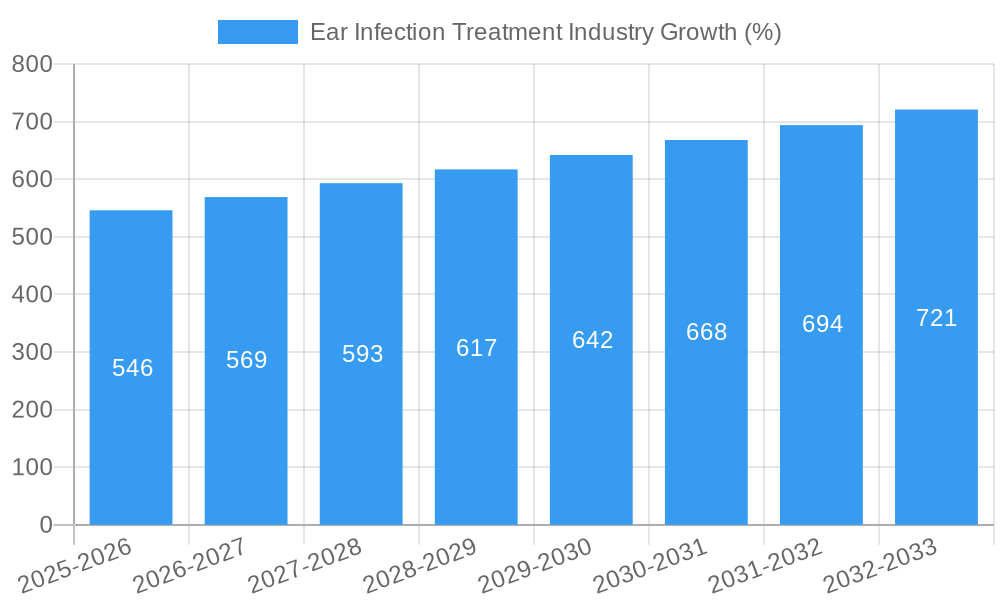
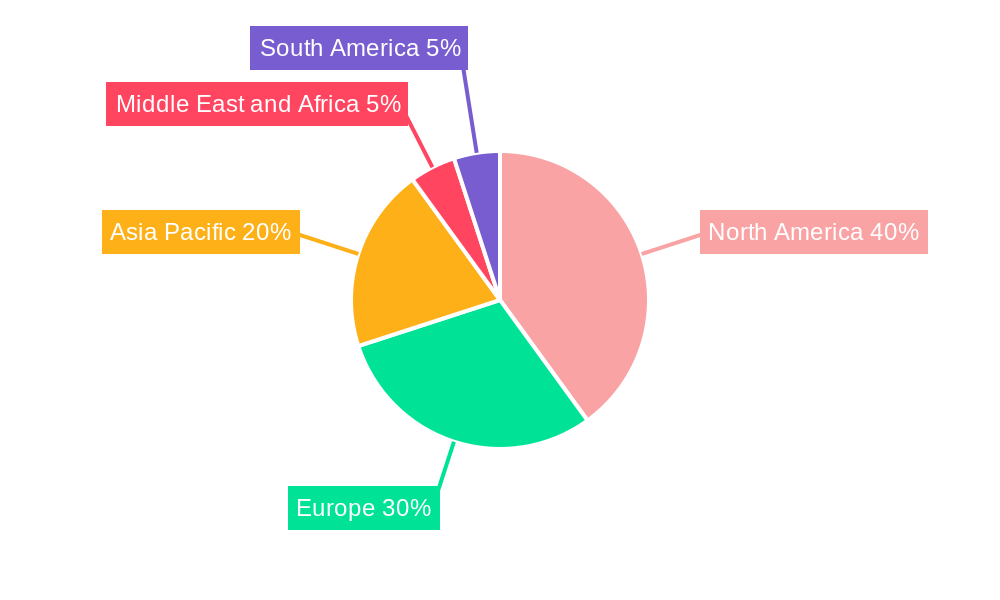
The global ear infection treatment market, valued at $12.23 billion in 2025, is projected to experience robust growth, driven by rising prevalence of ear infections, particularly among children, and an aging population susceptible to chronic conditions. The market's Compound Annual Growth Rate (CAGR) of 4.29% from 2025 to 2033 indicates a steady expansion. Key drivers include increasing healthcare expenditure, advancements in diagnostic techniques enabling earlier and more accurate detection, and the development of innovative treatment options like targeted antibiotics and minimally invasive surgical procedures. The market is segmented by infection cause (viral, bacterial), treatment type (medication, surgery), and infection location (inner, middle, outer ear). The increasing adoption of advanced diagnostic tools and effective treatment strategies contributes significantly to market expansion. However, factors such as the emergence of antibiotic resistance and high treatment costs pose challenges to market growth. Competition among established pharmaceutical companies like Sanofi, Pfizer, and Johnson & Johnson, along with emerging players, fuels innovation and accessibility of treatments. Geographic distribution reveals significant market potential across North America (driven by high healthcare spending and prevalence rates), Europe, and the Asia-Pacific region, particularly in countries with burgeoning middle classes and improving healthcare infrastructure.
The market's growth trajectory is further influenced by several trends. The rising awareness about ear infections and the benefits of early intervention is boosting demand for treatment. The pharmaceutical industry's focus on developing novel therapies with improved efficacy and reduced side effects is also a key driver. Furthermore, technological advancements in surgical techniques are making ear infection treatment less invasive and more effective. The increasing prevalence of chronic ear infections, particularly in elderly individuals, further contributes to market expansion. However, the potential for antibiotic resistance, the high cost of advanced treatments, and the need for greater access to healthcare in developing economies remain considerable constraints. The competitive landscape is characterized by a mix of large multinational corporations and smaller specialized companies, all vying to capture market share through product innovation and strategic partnerships.
Ear Infection Treatment Market Report: 2019-2033
This comprehensive report provides a detailed analysis of the Ear Infection Treatment industry, encompassing market dynamics, growth trends, regional segmentation, product landscape, key players, and future outlook. The study period covers 2019-2033, with 2025 as the base and estimated year. The report segments the market by cause (Viral Infection, Bacterial Infection), type (Medication, Surgery), and infection type (Inner Ear Infection, Middle Ear Infection, Outer Ear Infection), providing granular insights into each segment's growth trajectory. This report is invaluable for industry professionals, investors, and researchers seeking to understand and navigate this dynamic market.
Ear Infection Treatment Industry Market Dynamics & Structure
The global ear infection treatment market, valued at xx million units in 2024, is characterized by moderate concentration with several major players and numerous smaller niche players. Technological innovation, particularly in minimally invasive surgical techniques and targeted drug delivery systems, is a key driver. Regulatory frameworks, varying across regions, significantly impact market access and product approvals. Competitive pressure comes from both established pharmaceutical companies and emerging biotech firms. The market is primarily driven by the high prevalence of ear infections, especially among children. Mergers and acquisitions (M&A) activity is expected to remain moderate, driven by companies seeking to expand their product portfolios and geographic reach.
- Market Concentration: Moderately concentrated, with a few major players holding significant market share (xx%).
- Technological Innovation: Significant advancements in diagnostics and treatment options.
- Regulatory Frameworks: Varying regulations across countries impacting market access.
- Competitive Landscape: Intense competition among pharmaceutical and medical device companies.
- M&A Activity: Moderate activity, driven by portfolio diversification and market expansion.
- End-User Demographics: High prevalence among children drives demand for pediatric treatments.
Ear Infection Treatment Industry Growth Trends & Insights
The ear infection treatment market is projected to experience a CAGR of xx% during the forecast period (2025-2033), reaching xx million units by 2033. This growth is driven by rising prevalence of ear infections, particularly in developing countries with limited access to healthcare. The increasing adoption of advanced diagnostic tools, coupled with the development of new and effective treatments, is also contributing to market expansion. Consumer behavior shifts towards proactive healthcare and increased awareness of ear infection symptoms fuel market growth. Technological disruptions, such as telehealth and remote patient monitoring, are starting to influence treatment delivery and market access. Market penetration is expected to improve with increased awareness campaigns and improved access to healthcare services.
Dominant Regions, Countries, or Segments in Ear Infection Treatment Industry
North America currently holds the largest market share, driven by high healthcare expenditure and advanced medical infrastructure. However, the Asia-Pacific region is poised for significant growth due to rising disposable incomes, increasing awareness of ear infections, and expanding healthcare facilities.
- Medication Segment: Dominates the market due to its widespread accessibility and cost-effectiveness compared to surgical interventions.
- Bacterial Infection Treatment: Represents a larger segment due to the higher prevalence of bacterial ear infections.
- Middle Ear Infection Treatment: The most common type of ear infection, driving significant market demand.
- Key Drivers in North America: High healthcare expenditure, advanced medical infrastructure, and robust research and development.
- Key Drivers in Asia-Pacific: Rising disposable incomes, increasing population, expanding healthcare access.
Ear Infection Treatment Industry Product Landscape
The product landscape includes a wide range of medications (antibiotics, analgesics), surgical instruments, and diagnostic tools. Recent innovations focus on targeted drug delivery systems for enhanced efficacy and reduced side effects, minimally invasive surgical techniques, and advanced diagnostic imaging for early and accurate detection. Unique selling propositions emphasize efficacy, safety, and convenience, particularly for pediatric populations. The integration of telehealth platforms and remote monitoring systems is improving treatment adherence and patient outcomes.
Key Drivers, Barriers & Challenges in Ear Infection Treatment Industry
Key Drivers:
- Growing prevalence of ear infections globally.
- Increasing healthcare expenditure.
- Technological advancements in diagnostics and treatment.
- Rising awareness of ear infection symptoms and prevention.
Challenges and Restraints:
- High cost of advanced treatments can limit accessibility, particularly in low-income countries.
- Antibiotic resistance poses a significant challenge, requiring the development of new treatment options.
- Stringent regulatory hurdles in some regions can delay product approvals.
- Intense competition among various treatment options.
Emerging Opportunities in Ear Infection Treatment Industry
- Development of novel antibiotics to combat antibiotic resistance.
- Growing demand for minimally invasive surgical procedures.
- Increased adoption of telehealth solutions for remote patient monitoring.
- Focus on personalized medicine approaches tailored to individual patient needs.
Growth Accelerators in the Ear Infection Treatment Industry
Technological breakthroughs, particularly in gene therapy and nanomedicine, offer significant potential for developing novel, highly effective ear infection treatments. Strategic partnerships between pharmaceutical companies and technology providers are facilitating the development and adoption of advanced diagnostic and treatment tools. Market expansion into underserved regions will also drive future growth.
Key Players Shaping the Ear Infection Treatment Industry Market
- Sanofi SA
- Pfizer PLC
- Torque Pharma
- Cipla Ltd
- Novartis AG
- Grace Medical
- Medtronic PLC
- GSK plc
- Otonomy Inc
- Johnson & Johnson
- Olympus Corporation
- American Diagnostic Corporation
Notable Milestones in Ear Infection Treatment Industry Sector
- November 2022: The Denver Health and Hospital Authority initiated the "RELAX" clinical trial to evaluate shorter antibiotic durations for children with acute otitis media (AOM).
- June 2021: Olympus Australia partnered with InterMed Medical to distribute ENT products in Australia and New Zealand, expanding market reach.
In-Depth Ear Infection Treatment Industry Market Outlook
The future of the ear infection treatment market is bright, driven by continuous innovation in diagnostics, therapeutics, and treatment delivery methods. Strategic partnerships, market expansion into emerging economies, and the development of personalized treatment strategies will further accelerate market growth. The focus on combating antibiotic resistance and improving patient access to affordable and effective treatments will remain paramount in shaping the industry's trajectory.
Ear Infection Treatment Industry Segmentation
-
1. Infection
- 1.1. Inner Ear Infection
- 1.2. Middle Ear Infection
- 1.3. Outer Ear Infection
-
2. Cause
- 2.1. Viral Infection
- 2.2. Bacterial Infection
-
3. Type
-
3.1. Medication
- 3.1.1. Antibiotics
- 3.1.2. Analgesics
- 3.1.3. AntiViral
- 3.2. Surgery
-
3.1. Medication
Ear Infection Treatment Industry Segmentation By Geography
-
1. North America
- 1.1. United States
- 1.2. Canada
- 1.3. Mexico
-
2. Europe
- 2.1. Germany
- 2.2. United Kingdom
- 2.3. France
- 2.4. Italy
- 2.5. Spain
- 2.6. Rest of Europe
-
3. Asia Pacific
- 3.1. China
- 3.2. Japan
- 3.3. India
- 3.4. Australia
- 3.5. South Korea
- 3.6. Rest of Asia Pacific
-
4. Middle East and Africa
- 4.1. GCC
- 4.2. South Africa
- 4.3. Rest of Middle East and Africa
-
5. South America
- 5.1. Brazil
- 5.2. Argentina
- 5.3. Rest of South America
Ear Infection Treatment Industry REPORT HIGHLIGHTS
| Aspects | Details |
|---|---|
| Study Period | 2019-2033 |
| Base Year | 2024 |
| Estimated Year | 2025 |
| Forecast Period | 2025-2033 |
| Historical Period | 2019-2024 |
| Growth Rate | CAGR of 4.29% from 2019-2033 |
| Segmentation |
|
Table of Contents
- 1. Introduction
- 1.1. Research Scope
- 1.2. Market Segmentation
- 1.3. Research Methodology
- 1.4. Definitions and Assumptions
- 2. Executive Summary
- 2.1. Introduction
- 3. Market Dynamics
- 3.1. Introduction
- 3.2. Market Drivers
- 3.2.1. Rising Prevalence of Ear Infections; Increase In Research and Development in the Field of Ear Infections
- 3.3. Market Restrains
- 3.3.1. High Costs and Complications Related to Surgical Procedures
- 3.4. Market Trends
- 3.4.1. The Middle Ear Infection Segment is Expected to Show a High Growth Rate During the Forecast Period
- 4. Market Factor Analysis
- 4.1. Porters Five Forces
- 4.2. Supply/Value Chain
- 4.3. PESTEL analysis
- 4.4. Market Entropy
- 4.5. Patent/Trademark Analysis
- 5. Global Ear Infection Treatment Industry Analysis, Insights and Forecast, 2019-2031
- 5.1. Market Analysis, Insights and Forecast - by Infection
- 5.1.1. Inner Ear Infection
- 5.1.2. Middle Ear Infection
- 5.1.3. Outer Ear Infection
- 5.2. Market Analysis, Insights and Forecast - by Cause
- 5.2.1. Viral Infection
- 5.2.2. Bacterial Infection
- 5.3. Market Analysis, Insights and Forecast - by Type
- 5.3.1. Medication
- 5.3.1.1. Antibiotics
- 5.3.1.2. Analgesics
- 5.3.1.3. AntiViral
- 5.3.2. Surgery
- 5.3.1. Medication
- 5.4. Market Analysis, Insights and Forecast - by Region
- 5.4.1. North America
- 5.4.2. Europe
- 5.4.3. Asia Pacific
- 5.4.4. Middle East and Africa
- 5.4.5. South America
- 5.1. Market Analysis, Insights and Forecast - by Infection
- 6. North America Ear Infection Treatment Industry Analysis, Insights and Forecast, 2019-2031
- 6.1. Market Analysis, Insights and Forecast - by Infection
- 6.1.1. Inner Ear Infection
- 6.1.2. Middle Ear Infection
- 6.1.3. Outer Ear Infection
- 6.2. Market Analysis, Insights and Forecast - by Cause
- 6.2.1. Viral Infection
- 6.2.2. Bacterial Infection
- 6.3. Market Analysis, Insights and Forecast - by Type
- 6.3.1. Medication
- 6.3.1.1. Antibiotics
- 6.3.1.2. Analgesics
- 6.3.1.3. AntiViral
- 6.3.2. Surgery
- 6.3.1. Medication
- 6.1. Market Analysis, Insights and Forecast - by Infection
- 7. Europe Ear Infection Treatment Industry Analysis, Insights and Forecast, 2019-2031
- 7.1. Market Analysis, Insights and Forecast - by Infection
- 7.1.1. Inner Ear Infection
- 7.1.2. Middle Ear Infection
- 7.1.3. Outer Ear Infection
- 7.2. Market Analysis, Insights and Forecast - by Cause
- 7.2.1. Viral Infection
- 7.2.2. Bacterial Infection
- 7.3. Market Analysis, Insights and Forecast - by Type
- 7.3.1. Medication
- 7.3.1.1. Antibiotics
- 7.3.1.2. Analgesics
- 7.3.1.3. AntiViral
- 7.3.2. Surgery
- 7.3.1. Medication
- 7.1. Market Analysis, Insights and Forecast - by Infection
- 8. Asia Pacific Ear Infection Treatment Industry Analysis, Insights and Forecast, 2019-2031
- 8.1. Market Analysis, Insights and Forecast - by Infection
- 8.1.1. Inner Ear Infection
- 8.1.2. Middle Ear Infection
- 8.1.3. Outer Ear Infection
- 8.2. Market Analysis, Insights and Forecast - by Cause
- 8.2.1. Viral Infection
- 8.2.2. Bacterial Infection
- 8.3. Market Analysis, Insights and Forecast - by Type
- 8.3.1. Medication
- 8.3.1.1. Antibiotics
- 8.3.1.2. Analgesics
- 8.3.1.3. AntiViral
- 8.3.2. Surgery
- 8.3.1. Medication
- 8.1. Market Analysis, Insights and Forecast - by Infection
- 9. Middle East and Africa Ear Infection Treatment Industry Analysis, Insights and Forecast, 2019-2031
- 9.1. Market Analysis, Insights and Forecast - by Infection
- 9.1.1. Inner Ear Infection
- 9.1.2. Middle Ear Infection
- 9.1.3. Outer Ear Infection
- 9.2. Market Analysis, Insights and Forecast - by Cause
- 9.2.1. Viral Infection
- 9.2.2. Bacterial Infection
- 9.3. Market Analysis, Insights and Forecast - by Type
- 9.3.1. Medication
- 9.3.1.1. Antibiotics
- 9.3.1.2. Analgesics
- 9.3.1.3. AntiViral
- 9.3.2. Surgery
- 9.3.1. Medication
- 9.1. Market Analysis, Insights and Forecast - by Infection
- 10. South America Ear Infection Treatment Industry Analysis, Insights and Forecast, 2019-2031
- 10.1. Market Analysis, Insights and Forecast - by Infection
- 10.1.1. Inner Ear Infection
- 10.1.2. Middle Ear Infection
- 10.1.3. Outer Ear Infection
- 10.2. Market Analysis, Insights and Forecast - by Cause
- 10.2.1. Viral Infection
- 10.2.2. Bacterial Infection
- 10.3. Market Analysis, Insights and Forecast - by Type
- 10.3.1. Medication
- 10.3.1.1. Antibiotics
- 10.3.1.2. Analgesics
- 10.3.1.3. AntiViral
- 10.3.2. Surgery
- 10.3.1. Medication
- 10.1. Market Analysis, Insights and Forecast - by Infection
- 11. North America Ear Infection Treatment Industry Analysis, Insights and Forecast, 2019-2031
- 11.1. Market Analysis, Insights and Forecast - By Country/Sub-region
- 11.1.1 United States
- 11.1.2 Canada
- 11.1.3 Mexico
- 12. Europe Ear Infection Treatment Industry Analysis, Insights and Forecast, 2019-2031
- 12.1. Market Analysis, Insights and Forecast - By Country/Sub-region
- 12.1.1 Germany
- 12.1.2 United Kingdom
- 12.1.3 France
- 12.1.4 Italy
- 12.1.5 Spain
- 12.1.6 Rest of Europe
- 13. Asia Pacific Ear Infection Treatment Industry Analysis, Insights and Forecast, 2019-2031
- 13.1. Market Analysis, Insights and Forecast - By Country/Sub-region
- 13.1.1 China
- 13.1.2 Japan
- 13.1.3 India
- 13.1.4 Australia
- 13.1.5 South Korea
- 13.1.6 Rest of Asia Pacific
- 14. Middle East and Africa Ear Infection Treatment Industry Analysis, Insights and Forecast, 2019-2031
- 14.1. Market Analysis, Insights and Forecast - By Country/Sub-region
- 14.1.1 GCC
- 14.1.2 South Africa
- 14.1.3 Rest of Middle East and Africa
- 15. South America Ear Infection Treatment Industry Analysis, Insights and Forecast, 2019-2031
- 15.1. Market Analysis, Insights and Forecast - By Country/Sub-region
- 15.1.1 Brazil
- 15.1.2 Argentina
- 15.1.3 Rest of South America
- 16. Competitive Analysis
- 16.1. Global Market Share Analysis 2024
- 16.2. Company Profiles
- 16.2.1 Sanofi SA
- 16.2.1.1. Overview
- 16.2.1.2. Products
- 16.2.1.3. SWOT Analysis
- 16.2.1.4. Recent Developments
- 16.2.1.5. Financials (Based on Availability)
- 16.2.2 Pfizer PLC
- 16.2.2.1. Overview
- 16.2.2.2. Products
- 16.2.2.3. SWOT Analysis
- 16.2.2.4. Recent Developments
- 16.2.2.5. Financials (Based on Availability)
- 16.2.3 Torque Pharma
- 16.2.3.1. Overview
- 16.2.3.2. Products
- 16.2.3.3. SWOT Analysis
- 16.2.3.4. Recent Developments
- 16.2.3.5. Financials (Based on Availability)
- 16.2.4 Cipla Ltd
- 16.2.4.1. Overview
- 16.2.4.2. Products
- 16.2.4.3. SWOT Analysis
- 16.2.4.4. Recent Developments
- 16.2.4.5. Financials (Based on Availability)
- 16.2.5 Novartis AG
- 16.2.5.1. Overview
- 16.2.5.2. Products
- 16.2.5.3. SWOT Analysis
- 16.2.5.4. Recent Developments
- 16.2.5.5. Financials (Based on Availability)
- 16.2.6 Grace Medical
- 16.2.6.1. Overview
- 16.2.6.2. Products
- 16.2.6.3. SWOT Analysis
- 16.2.6.4. Recent Developments
- 16.2.6.5. Financials (Based on Availability)
- 16.2.7 Medtronic PLC
- 16.2.7.1. Overview
- 16.2.7.2. Products
- 16.2.7.3. SWOT Analysis
- 16.2.7.4. Recent Developments
- 16.2.7.5. Financials (Based on Availability)
- 16.2.8 GSK plc
- 16.2.8.1. Overview
- 16.2.8.2. Products
- 16.2.8.3. SWOT Analysis
- 16.2.8.4. Recent Developments
- 16.2.8.5. Financials (Based on Availability)
- 16.2.9 Otonomy Inc
- 16.2.9.1. Overview
- 16.2.9.2. Products
- 16.2.9.3. SWOT Analysis
- 16.2.9.4. Recent Developments
- 16.2.9.5. Financials (Based on Availability)
- 16.2.10 Johnson & Johnson
- 16.2.10.1. Overview
- 16.2.10.2. Products
- 16.2.10.3. SWOT Analysis
- 16.2.10.4. Recent Developments
- 16.2.10.5. Financials (Based on Availability)
- 16.2.11 Olympus Corporation
- 16.2.11.1. Overview
- 16.2.11.2. Products
- 16.2.11.3. SWOT Analysis
- 16.2.11.4. Recent Developments
- 16.2.11.5. Financials (Based on Availability)
- 16.2.12 American Diagnostic Corporation
- 16.2.12.1. Overview
- 16.2.12.2. Products
- 16.2.12.3. SWOT Analysis
- 16.2.12.4. Recent Developments
- 16.2.12.5. Financials (Based on Availability)
- 16.2.1 Sanofi SA
List of Figures
- Figure 1: Global Ear Infection Treatment Industry Revenue Breakdown (Million, %) by Region 2024 & 2032
- Figure 2: Global Ear Infection Treatment Industry Volume Breakdown (K Unit, %) by Region 2024 & 2032
- Figure 3: North America Ear Infection Treatment Industry Revenue (Million), by Country 2024 & 2032
- Figure 4: North America Ear Infection Treatment Industry Volume (K Unit), by Country 2024 & 2032
- Figure 5: North America Ear Infection Treatment Industry Revenue Share (%), by Country 2024 & 2032
- Figure 6: North America Ear Infection Treatment Industry Volume Share (%), by Country 2024 & 2032
- Figure 7: Europe Ear Infection Treatment Industry Revenue (Million), by Country 2024 & 2032
- Figure 8: Europe Ear Infection Treatment Industry Volume (K Unit), by Country 2024 & 2032
- Figure 9: Europe Ear Infection Treatment Industry Revenue Share (%), by Country 2024 & 2032
- Figure 10: Europe Ear Infection Treatment Industry Volume Share (%), by Country 2024 & 2032
- Figure 11: Asia Pacific Ear Infection Treatment Industry Revenue (Million), by Country 2024 & 2032
- Figure 12: Asia Pacific Ear Infection Treatment Industry Volume (K Unit), by Country 2024 & 2032
- Figure 13: Asia Pacific Ear Infection Treatment Industry Revenue Share (%), by Country 2024 & 2032
- Figure 14: Asia Pacific Ear Infection Treatment Industry Volume Share (%), by Country 2024 & 2032
- Figure 15: Middle East and Africa Ear Infection Treatment Industry Revenue (Million), by Country 2024 & 2032
- Figure 16: Middle East and Africa Ear Infection Treatment Industry Volume (K Unit), by Country 2024 & 2032
- Figure 17: Middle East and Africa Ear Infection Treatment Industry Revenue Share (%), by Country 2024 & 2032
- Figure 18: Middle East and Africa Ear Infection Treatment Industry Volume Share (%), by Country 2024 & 2032
- Figure 19: South America Ear Infection Treatment Industry Revenue (Million), by Country 2024 & 2032
- Figure 20: South America Ear Infection Treatment Industry Volume (K Unit), by Country 2024 & 2032
- Figure 21: South America Ear Infection Treatment Industry Revenue Share (%), by Country 2024 & 2032
- Figure 22: South America Ear Infection Treatment Industry Volume Share (%), by Country 2024 & 2032
- Figure 23: North America Ear Infection Treatment Industry Revenue (Million), by Infection 2024 & 2032
- Figure 24: North America Ear Infection Treatment Industry Volume (K Unit), by Infection 2024 & 2032
- Figure 25: North America Ear Infection Treatment Industry Revenue Share (%), by Infection 2024 & 2032
- Figure 26: North America Ear Infection Treatment Industry Volume Share (%), by Infection 2024 & 2032
- Figure 27: North America Ear Infection Treatment Industry Revenue (Million), by Cause 2024 & 2032
- Figure 28: North America Ear Infection Treatment Industry Volume (K Unit), by Cause 2024 & 2032
- Figure 29: North America Ear Infection Treatment Industry Revenue Share (%), by Cause 2024 & 2032
- Figure 30: North America Ear Infection Treatment Industry Volume Share (%), by Cause 2024 & 2032
- Figure 31: North America Ear Infection Treatment Industry Revenue (Million), by Type 2024 & 2032
- Figure 32: North America Ear Infection Treatment Industry Volume (K Unit), by Type 2024 & 2032
- Figure 33: North America Ear Infection Treatment Industry Revenue Share (%), by Type 2024 & 2032
- Figure 34: North America Ear Infection Treatment Industry Volume Share (%), by Type 2024 & 2032
- Figure 35: North America Ear Infection Treatment Industry Revenue (Million), by Country 2024 & 2032
- Figure 36: North America Ear Infection Treatment Industry Volume (K Unit), by Country 2024 & 2032
- Figure 37: North America Ear Infection Treatment Industry Revenue Share (%), by Country 2024 & 2032
- Figure 38: North America Ear Infection Treatment Industry Volume Share (%), by Country 2024 & 2032
- Figure 39: Europe Ear Infection Treatment Industry Revenue (Million), by Infection 2024 & 2032
- Figure 40: Europe Ear Infection Treatment Industry Volume (K Unit), by Infection 2024 & 2032
- Figure 41: Europe Ear Infection Treatment Industry Revenue Share (%), by Infection 2024 & 2032
- Figure 42: Europe Ear Infection Treatment Industry Volume Share (%), by Infection 2024 & 2032
- Figure 43: Europe Ear Infection Treatment Industry Revenue (Million), by Cause 2024 & 2032
- Figure 44: Europe Ear Infection Treatment Industry Volume (K Unit), by Cause 2024 & 2032
- Figure 45: Europe Ear Infection Treatment Industry Revenue Share (%), by Cause 2024 & 2032
- Figure 46: Europe Ear Infection Treatment Industry Volume Share (%), by Cause 2024 & 2032
- Figure 47: Europe Ear Infection Treatment Industry Revenue (Million), by Type 2024 & 2032
- Figure 48: Europe Ear Infection Treatment Industry Volume (K Unit), by Type 2024 & 2032
- Figure 49: Europe Ear Infection Treatment Industry Revenue Share (%), by Type 2024 & 2032
- Figure 50: Europe Ear Infection Treatment Industry Volume Share (%), by Type 2024 & 2032
- Figure 51: Europe Ear Infection Treatment Industry Revenue (Million), by Country 2024 & 2032
- Figure 52: Europe Ear Infection Treatment Industry Volume (K Unit), by Country 2024 & 2032
- Figure 53: Europe Ear Infection Treatment Industry Revenue Share (%), by Country 2024 & 2032
- Figure 54: Europe Ear Infection Treatment Industry Volume Share (%), by Country 2024 & 2032
- Figure 55: Asia Pacific Ear Infection Treatment Industry Revenue (Million), by Infection 2024 & 2032
- Figure 56: Asia Pacific Ear Infection Treatment Industry Volume (K Unit), by Infection 2024 & 2032
- Figure 57: Asia Pacific Ear Infection Treatment Industry Revenue Share (%), by Infection 2024 & 2032
- Figure 58: Asia Pacific Ear Infection Treatment Industry Volume Share (%), by Infection 2024 & 2032
- Figure 59: Asia Pacific Ear Infection Treatment Industry Revenue (Million), by Cause 2024 & 2032
- Figure 60: Asia Pacific Ear Infection Treatment Industry Volume (K Unit), by Cause 2024 & 2032
- Figure 61: Asia Pacific Ear Infection Treatment Industry Revenue Share (%), by Cause 2024 & 2032
- Figure 62: Asia Pacific Ear Infection Treatment Industry Volume Share (%), by Cause 2024 & 2032
- Figure 63: Asia Pacific Ear Infection Treatment Industry Revenue (Million), by Type 2024 & 2032
- Figure 64: Asia Pacific Ear Infection Treatment Industry Volume (K Unit), by Type 2024 & 2032
- Figure 65: Asia Pacific Ear Infection Treatment Industry Revenue Share (%), by Type 2024 & 2032
- Figure 66: Asia Pacific Ear Infection Treatment Industry Volume Share (%), by Type 2024 & 2032
- Figure 67: Asia Pacific Ear Infection Treatment Industry Revenue (Million), by Country 2024 & 2032
- Figure 68: Asia Pacific Ear Infection Treatment Industry Volume (K Unit), by Country 2024 & 2032
- Figure 69: Asia Pacific Ear Infection Treatment Industry Revenue Share (%), by Country 2024 & 2032
- Figure 70: Asia Pacific Ear Infection Treatment Industry Volume Share (%), by Country 2024 & 2032
- Figure 71: Middle East and Africa Ear Infection Treatment Industry Revenue (Million), by Infection 2024 & 2032
- Figure 72: Middle East and Africa Ear Infection Treatment Industry Volume (K Unit), by Infection 2024 & 2032
- Figure 73: Middle East and Africa Ear Infection Treatment Industry Revenue Share (%), by Infection 2024 & 2032
- Figure 74: Middle East and Africa Ear Infection Treatment Industry Volume Share (%), by Infection 2024 & 2032
- Figure 75: Middle East and Africa Ear Infection Treatment Industry Revenue (Million), by Cause 2024 & 2032
- Figure 76: Middle East and Africa Ear Infection Treatment Industry Volume (K Unit), by Cause 2024 & 2032
- Figure 77: Middle East and Africa Ear Infection Treatment Industry Revenue Share (%), by Cause 2024 & 2032
- Figure 78: Middle East and Africa Ear Infection Treatment Industry Volume Share (%), by Cause 2024 & 2032
- Figure 79: Middle East and Africa Ear Infection Treatment Industry Revenue (Million), by Type 2024 & 2032
- Figure 80: Middle East and Africa Ear Infection Treatment Industry Volume (K Unit), by Type 2024 & 2032
- Figure 81: Middle East and Africa Ear Infection Treatment Industry Revenue Share (%), by Type 2024 & 2032
- Figure 82: Middle East and Africa Ear Infection Treatment Industry Volume Share (%), by Type 2024 & 2032
- Figure 83: Middle East and Africa Ear Infection Treatment Industry Revenue (Million), by Country 2024 & 2032
- Figure 84: Middle East and Africa Ear Infection Treatment Industry Volume (K Unit), by Country 2024 & 2032
- Figure 85: Middle East and Africa Ear Infection Treatment Industry Revenue Share (%), by Country 2024 & 2032
- Figure 86: Middle East and Africa Ear Infection Treatment Industry Volume Share (%), by Country 2024 & 2032
- Figure 87: South America Ear Infection Treatment Industry Revenue (Million), by Infection 2024 & 2032
- Figure 88: South America Ear Infection Treatment Industry Volume (K Unit), by Infection 2024 & 2032
- Figure 89: South America Ear Infection Treatment Industry Revenue Share (%), by Infection 2024 & 2032
- Figure 90: South America Ear Infection Treatment Industry Volume Share (%), by Infection 2024 & 2032
- Figure 91: South America Ear Infection Treatment Industry Revenue (Million), by Cause 2024 & 2032
- Figure 92: South America Ear Infection Treatment Industry Volume (K Unit), by Cause 2024 & 2032
- Figure 93: South America Ear Infection Treatment Industry Revenue Share (%), by Cause 2024 & 2032
- Figure 94: South America Ear Infection Treatment Industry Volume Share (%), by Cause 2024 & 2032
- Figure 95: South America Ear Infection Treatment Industry Revenue (Million), by Type 2024 & 2032
- Figure 96: South America Ear Infection Treatment Industry Volume (K Unit), by Type 2024 & 2032
- Figure 97: South America Ear Infection Treatment Industry Revenue Share (%), by Type 2024 & 2032
- Figure 98: South America Ear Infection Treatment Industry Volume Share (%), by Type 2024 & 2032
- Figure 99: South America Ear Infection Treatment Industry Revenue (Million), by Country 2024 & 2032
- Figure 100: South America Ear Infection Treatment Industry Volume (K Unit), by Country 2024 & 2032
- Figure 101: South America Ear Infection Treatment Industry Revenue Share (%), by Country 2024 & 2032
- Figure 102: South America Ear Infection Treatment Industry Volume Share (%), by Country 2024 & 2032
List of Tables
- Table 1: Global Ear Infection Treatment Industry Revenue Million Forecast, by Region 2019 & 2032
- Table 2: Global Ear Infection Treatment Industry Volume K Unit Forecast, by Region 2019 & 2032
- Table 3: Global Ear Infection Treatment Industry Revenue Million Forecast, by Infection 2019 & 2032
- Table 4: Global Ear Infection Treatment Industry Volume K Unit Forecast, by Infection 2019 & 2032
- Table 5: Global Ear Infection Treatment Industry Revenue Million Forecast, by Cause 2019 & 2032
- Table 6: Global Ear Infection Treatment Industry Volume K Unit Forecast, by Cause 2019 & 2032
- Table 7: Global Ear Infection Treatment Industry Revenue Million Forecast, by Type 2019 & 2032
- Table 8: Global Ear Infection Treatment Industry Volume K Unit Forecast, by Type 2019 & 2032
- Table 9: Global Ear Infection Treatment Industry Revenue Million Forecast, by Region 2019 & 2032
- Table 10: Global Ear Infection Treatment Industry Volume K Unit Forecast, by Region 2019 & 2032
- Table 11: Global Ear Infection Treatment Industry Revenue Million Forecast, by Country 2019 & 2032
- Table 12: Global Ear Infection Treatment Industry Volume K Unit Forecast, by Country 2019 & 2032
- Table 13: United States Ear Infection Treatment Industry Revenue (Million) Forecast, by Application 2019 & 2032
- Table 14: United States Ear Infection Treatment Industry Volume (K Unit) Forecast, by Application 2019 & 2032
- Table 15: Canada Ear Infection Treatment Industry Revenue (Million) Forecast, by Application 2019 & 2032
- Table 16: Canada Ear Infection Treatment Industry Volume (K Unit) Forecast, by Application 2019 & 2032
- Table 17: Mexico Ear Infection Treatment Industry Revenue (Million) Forecast, by Application 2019 & 2032
- Table 18: Mexico Ear Infection Treatment Industry Volume (K Unit) Forecast, by Application 2019 & 2032
- Table 19: Global Ear Infection Treatment Industry Revenue Million Forecast, by Country 2019 & 2032
- Table 20: Global Ear Infection Treatment Industry Volume K Unit Forecast, by Country 2019 & 2032
- Table 21: Germany Ear Infection Treatment Industry Revenue (Million) Forecast, by Application 2019 & 2032
- Table 22: Germany Ear Infection Treatment Industry Volume (K Unit) Forecast, by Application 2019 & 2032
- Table 23: United Kingdom Ear Infection Treatment Industry Revenue (Million) Forecast, by Application 2019 & 2032
- Table 24: United Kingdom Ear Infection Treatment Industry Volume (K Unit) Forecast, by Application 2019 & 2032
- Table 25: France Ear Infection Treatment Industry Revenue (Million) Forecast, by Application 2019 & 2032
- Table 26: France Ear Infection Treatment Industry Volume (K Unit) Forecast, by Application 2019 & 2032
- Table 27: Italy Ear Infection Treatment Industry Revenue (Million) Forecast, by Application 2019 & 2032
- Table 28: Italy Ear Infection Treatment Industry Volume (K Unit) Forecast, by Application 2019 & 2032
- Table 29: Spain Ear Infection Treatment Industry Revenue (Million) Forecast, by Application 2019 & 2032
- Table 30: Spain Ear Infection Treatment Industry Volume (K Unit) Forecast, by Application 2019 & 2032
- Table 31: Rest of Europe Ear Infection Treatment Industry Revenue (Million) Forecast, by Application 2019 & 2032
- Table 32: Rest of Europe Ear Infection Treatment Industry Volume (K Unit) Forecast, by Application 2019 & 2032
- Table 33: Global Ear Infection Treatment Industry Revenue Million Forecast, by Country 2019 & 2032
- Table 34: Global Ear Infection Treatment Industry Volume K Unit Forecast, by Country 2019 & 2032
- Table 35: China Ear Infection Treatment Industry Revenue (Million) Forecast, by Application 2019 & 2032
- Table 36: China Ear Infection Treatment Industry Volume (K Unit) Forecast, by Application 2019 & 2032
- Table 37: Japan Ear Infection Treatment Industry Revenue (Million) Forecast, by Application 2019 & 2032
- Table 38: Japan Ear Infection Treatment Industry Volume (K Unit) Forecast, by Application 2019 & 2032
- Table 39: India Ear Infection Treatment Industry Revenue (Million) Forecast, by Application 2019 & 2032
- Table 40: India Ear Infection Treatment Industry Volume (K Unit) Forecast, by Application 2019 & 2032
- Table 41: Australia Ear Infection Treatment Industry Revenue (Million) Forecast, by Application 2019 & 2032
- Table 42: Australia Ear Infection Treatment Industry Volume (K Unit) Forecast, by Application 2019 & 2032
- Table 43: South Korea Ear Infection Treatment Industry Revenue (Million) Forecast, by Application 2019 & 2032
- Table 44: South Korea Ear Infection Treatment Industry Volume (K Unit) Forecast, by Application 2019 & 2032
- Table 45: Rest of Asia Pacific Ear Infection Treatment Industry Revenue (Million) Forecast, by Application 2019 & 2032
- Table 46: Rest of Asia Pacific Ear Infection Treatment Industry Volume (K Unit) Forecast, by Application 2019 & 2032
- Table 47: Global Ear Infection Treatment Industry Revenue Million Forecast, by Country 2019 & 2032
- Table 48: Global Ear Infection Treatment Industry Volume K Unit Forecast, by Country 2019 & 2032
- Table 49: GCC Ear Infection Treatment Industry Revenue (Million) Forecast, by Application 2019 & 2032
- Table 50: GCC Ear Infection Treatment Industry Volume (K Unit) Forecast, by Application 2019 & 2032
- Table 51: South Africa Ear Infection Treatment Industry Revenue (Million) Forecast, by Application 2019 & 2032
- Table 52: South Africa Ear Infection Treatment Industry Volume (K Unit) Forecast, by Application 2019 & 2032
- Table 53: Rest of Middle East and Africa Ear Infection Treatment Industry Revenue (Million) Forecast, by Application 2019 & 2032
- Table 54: Rest of Middle East and Africa Ear Infection Treatment Industry Volume (K Unit) Forecast, by Application 2019 & 2032
- Table 55: Global Ear Infection Treatment Industry Revenue Million Forecast, by Country 2019 & 2032
- Table 56: Global Ear Infection Treatment Industry Volume K Unit Forecast, by Country 2019 & 2032
- Table 57: Brazil Ear Infection Treatment Industry Revenue (Million) Forecast, by Application 2019 & 2032
- Table 58: Brazil Ear Infection Treatment Industry Volume (K Unit) Forecast, by Application 2019 & 2032
- Table 59: Argentina Ear Infection Treatment Industry Revenue (Million) Forecast, by Application 2019 & 2032
- Table 60: Argentina Ear Infection Treatment Industry Volume (K Unit) Forecast, by Application 2019 & 2032
- Table 61: Rest of South America Ear Infection Treatment Industry Revenue (Million) Forecast, by Application 2019 & 2032
- Table 62: Rest of South America Ear Infection Treatment Industry Volume (K Unit) Forecast, by Application 2019 & 2032
- Table 63: Global Ear Infection Treatment Industry Revenue Million Forecast, by Infection 2019 & 2032
- Table 64: Global Ear Infection Treatment Industry Volume K Unit Forecast, by Infection 2019 & 2032
- Table 65: Global Ear Infection Treatment Industry Revenue Million Forecast, by Cause 2019 & 2032
- Table 66: Global Ear Infection Treatment Industry Volume K Unit Forecast, by Cause 2019 & 2032
- Table 67: Global Ear Infection Treatment Industry Revenue Million Forecast, by Type 2019 & 2032
- Table 68: Global Ear Infection Treatment Industry Volume K Unit Forecast, by Type 2019 & 2032
- Table 69: Global Ear Infection Treatment Industry Revenue Million Forecast, by Country 2019 & 2032
- Table 70: Global Ear Infection Treatment Industry Volume K Unit Forecast, by Country 2019 & 2032
- Table 71: United States Ear Infection Treatment Industry Revenue (Million) Forecast, by Application 2019 & 2032
- Table 72: United States Ear Infection Treatment Industry Volume (K Unit) Forecast, by Application 2019 & 2032
- Table 73: Canada Ear Infection Treatment Industry Revenue (Million) Forecast, by Application 2019 & 2032
- Table 74: Canada Ear Infection Treatment Industry Volume (K Unit) Forecast, by Application 2019 & 2032
- Table 75: Mexico Ear Infection Treatment Industry Revenue (Million) Forecast, by Application 2019 & 2032
- Table 76: Mexico Ear Infection Treatment Industry Volume (K Unit) Forecast, by Application 2019 & 2032
- Table 77: Global Ear Infection Treatment Industry Revenue Million Forecast, by Infection 2019 & 2032
- Table 78: Global Ear Infection Treatment Industry Volume K Unit Forecast, by Infection 2019 & 2032
- Table 79: Global Ear Infection Treatment Industry Revenue Million Forecast, by Cause 2019 & 2032
- Table 80: Global Ear Infection Treatment Industry Volume K Unit Forecast, by Cause 2019 & 2032
- Table 81: Global Ear Infection Treatment Industry Revenue Million Forecast, by Type 2019 & 2032
- Table 82: Global Ear Infection Treatment Industry Volume K Unit Forecast, by Type 2019 & 2032
- Table 83: Global Ear Infection Treatment Industry Revenue Million Forecast, by Country 2019 & 2032
- Table 84: Global Ear Infection Treatment Industry Volume K Unit Forecast, by Country 2019 & 2032
- Table 85: Germany Ear Infection Treatment Industry Revenue (Million) Forecast, by Application 2019 & 2032
- Table 86: Germany Ear Infection Treatment Industry Volume (K Unit) Forecast, by Application 2019 & 2032
- Table 87: United Kingdom Ear Infection Treatment Industry Revenue (Million) Forecast, by Application 2019 & 2032
- Table 88: United Kingdom Ear Infection Treatment Industry Volume (K Unit) Forecast, by Application 2019 & 2032
- Table 89: France Ear Infection Treatment Industry Revenue (Million) Forecast, by Application 2019 & 2032
- Table 90: France Ear Infection Treatment Industry Volume (K Unit) Forecast, by Application 2019 & 2032
- Table 91: Italy Ear Infection Treatment Industry Revenue (Million) Forecast, by Application 2019 & 2032
- Table 92: Italy Ear Infection Treatment Industry Volume (K Unit) Forecast, by Application 2019 & 2032
- Table 93: Spain Ear Infection Treatment Industry Revenue (Million) Forecast, by Application 2019 & 2032
- Table 94: Spain Ear Infection Treatment Industry Volume (K Unit) Forecast, by Application 2019 & 2032
- Table 95: Rest of Europe Ear Infection Treatment Industry Revenue (Million) Forecast, by Application 2019 & 2032
- Table 96: Rest of Europe Ear Infection Treatment Industry Volume (K Unit) Forecast, by Application 2019 & 2032
- Table 97: Global Ear Infection Treatment Industry Revenue Million Forecast, by Infection 2019 & 2032
- Table 98: Global Ear Infection Treatment Industry Volume K Unit Forecast, by Infection 2019 & 2032
- Table 99: Global Ear Infection Treatment Industry Revenue Million Forecast, by Cause 2019 & 2032
- Table 100: Global Ear Infection Treatment Industry Volume K Unit Forecast, by Cause 2019 & 2032
- Table 101: Global Ear Infection Treatment Industry Revenue Million Forecast, by Type 2019 & 2032
- Table 102: Global Ear Infection Treatment Industry Volume K Unit Forecast, by Type 2019 & 2032
- Table 103: Global Ear Infection Treatment Industry Revenue Million Forecast, by Country 2019 & 2032
- Table 104: Global Ear Infection Treatment Industry Volume K Unit Forecast, by Country 2019 & 2032
- Table 105: China Ear Infection Treatment Industry Revenue (Million) Forecast, by Application 2019 & 2032
- Table 106: China Ear Infection Treatment Industry Volume (K Unit) Forecast, by Application 2019 & 2032
- Table 107: Japan Ear Infection Treatment Industry Revenue (Million) Forecast, by Application 2019 & 2032
- Table 108: Japan Ear Infection Treatment Industry Volume (K Unit) Forecast, by Application 2019 & 2032
- Table 109: India Ear Infection Treatment Industry Revenue (Million) Forecast, by Application 2019 & 2032
- Table 110: India Ear Infection Treatment Industry Volume (K Unit) Forecast, by Application 2019 & 2032
- Table 111: Australia Ear Infection Treatment Industry Revenue (Million) Forecast, by Application 2019 & 2032
- Table 112: Australia Ear Infection Treatment Industry Volume (K Unit) Forecast, by Application 2019 & 2032
- Table 113: South Korea Ear Infection Treatment Industry Revenue (Million) Forecast, by Application 2019 & 2032
- Table 114: South Korea Ear Infection Treatment Industry Volume (K Unit) Forecast, by Application 2019 & 2032
- Table 115: Rest of Asia Pacific Ear Infection Treatment Industry Revenue (Million) Forecast, by Application 2019 & 2032
- Table 116: Rest of Asia Pacific Ear Infection Treatment Industry Volume (K Unit) Forecast, by Application 2019 & 2032
- Table 117: Global Ear Infection Treatment Industry Revenue Million Forecast, by Infection 2019 & 2032
- Table 118: Global Ear Infection Treatment Industry Volume K Unit Forecast, by Infection 2019 & 2032
- Table 119: Global Ear Infection Treatment Industry Revenue Million Forecast, by Cause 2019 & 2032
- Table 120: Global Ear Infection Treatment Industry Volume K Unit Forecast, by Cause 2019 & 2032
- Table 121: Global Ear Infection Treatment Industry Revenue Million Forecast, by Type 2019 & 2032
- Table 122: Global Ear Infection Treatment Industry Volume K Unit Forecast, by Type 2019 & 2032
- Table 123: Global Ear Infection Treatment Industry Revenue Million Forecast, by Country 2019 & 2032
- Table 124: Global Ear Infection Treatment Industry Volume K Unit Forecast, by Country 2019 & 2032
- Table 125: GCC Ear Infection Treatment Industry Revenue (Million) Forecast, by Application 2019 & 2032
- Table 126: GCC Ear Infection Treatment Industry Volume (K Unit) Forecast, by Application 2019 & 2032
- Table 127: South Africa Ear Infection Treatment Industry Revenue (Million) Forecast, by Application 2019 & 2032
- Table 128: South Africa Ear Infection Treatment Industry Volume (K Unit) Forecast, by Application 2019 & 2032
- Table 129: Rest of Middle East and Africa Ear Infection Treatment Industry Revenue (Million) Forecast, by Application 2019 & 2032
- Table 130: Rest of Middle East and Africa Ear Infection Treatment Industry Volume (K Unit) Forecast, by Application 2019 & 2032
- Table 131: Global Ear Infection Treatment Industry Revenue Million Forecast, by Infection 2019 & 2032
- Table 132: Global Ear Infection Treatment Industry Volume K Unit Forecast, by Infection 2019 & 2032
- Table 133: Global Ear Infection Treatment Industry Revenue Million Forecast, by Cause 2019 & 2032
- Table 134: Global Ear Infection Treatment Industry Volume K Unit Forecast, by Cause 2019 & 2032
- Table 135: Global Ear Infection Treatment Industry Revenue Million Forecast, by Type 2019 & 2032
- Table 136: Global Ear Infection Treatment Industry Volume K Unit Forecast, by Type 2019 & 2032
- Table 137: Global Ear Infection Treatment Industry Revenue Million Forecast, by Country 2019 & 2032
- Table 138: Global Ear Infection Treatment Industry Volume K Unit Forecast, by Country 2019 & 2032
- Table 139: Brazil Ear Infection Treatment Industry Revenue (Million) Forecast, by Application 2019 & 2032
- Table 140: Brazil Ear Infection Treatment Industry Volume (K Unit) Forecast, by Application 2019 & 2032
- Table 141: Argentina Ear Infection Treatment Industry Revenue (Million) Forecast, by Application 2019 & 2032
- Table 142: Argentina Ear Infection Treatment Industry Volume (K Unit) Forecast, by Application 2019 & 2032
- Table 143: Rest of South America Ear Infection Treatment Industry Revenue (Million) Forecast, by Application 2019 & 2032
- Table 144: Rest of South America Ear Infection Treatment Industry Volume (K Unit) Forecast, by Application 2019 & 2032
Frequently Asked Questions
1. What is the projected Compound Annual Growth Rate (CAGR) of the Ear Infection Treatment Industry?
The projected CAGR is approximately 4.29%.
2. Which companies are prominent players in the Ear Infection Treatment Industry?
Key companies in the market include Sanofi SA, Pfizer PLC, Torque Pharma, Cipla Ltd, Novartis AG, Grace Medical, Medtronic PLC, GSK plc, Otonomy Inc, Johnson & Johnson, Olympus Corporation, American Diagnostic Corporation.
3. What are the main segments of the Ear Infection Treatment Industry?
The market segments include Infection, Cause, Type.
4. Can you provide details about the market size?
The market size is estimated to be USD 12.23 Million as of 2022.
5. What are some drivers contributing to market growth?
Rising Prevalence of Ear Infections; Increase In Research and Development in the Field of Ear Infections.
6. What are the notable trends driving market growth?
The Middle Ear Infection Segment is Expected to Show a High Growth Rate During the Forecast Period.
7. Are there any restraints impacting market growth?
High Costs and Complications Related to Surgical Procedures.
8. Can you provide examples of recent developments in the market?
November 2022: The Denver Health and Hospital Authority started a clinical trial study under the title "RELAX: Reducing Length of Antibiotics for Children With Ear Infections (RELAX)". The aim of the study is to evaluate the effectiveness and implementation outcomes of two low-cost interventions of different intensities to increase the prescribing of recommended short antibiotic durations for acute otitis media (AOM) in children 2 years of age and older.
9. What pricing options are available for accessing the report?
Pricing options include single-user, multi-user, and enterprise licenses priced at USD 4750, USD 5250, and USD 8750 respectively.
10. Is the market size provided in terms of value or volume?
The market size is provided in terms of value, measured in Million and volume, measured in K Unit.
11. Are there any specific market keywords associated with the report?
Yes, the market keyword associated with the report is "Ear Infection Treatment Industry," which aids in identifying and referencing the specific market segment covered.
12. How do I determine which pricing option suits my needs best?
The pricing options vary based on user requirements and access needs. Individual users may opt for single-user licenses, while businesses requiring broader access may choose multi-user or enterprise licenses for cost-effective access to the report.
13. Are there any additional resources or data provided in the Ear Infection Treatment Industry report?
While the report offers comprehensive insights, it's advisable to review the specific contents or supplementary materials provided to ascertain if additional resources or data are available.
14. How can I stay updated on further developments or reports in the Ear Infection Treatment Industry?
To stay informed about further developments, trends, and reports in the Ear Infection Treatment Industry, consider subscribing to industry newsletters, following relevant companies and organizations, or regularly checking reputable industry news sources and publications.
Methodology
Step 1 - Identification of Relevant Samples Size from Population Database


Step 2 - Approaches for Defining Global Market Size (Value, Volume* & Price*)

Note*: In applicable scenarios
Step 3 - Data Sources
Primary Research
- Web Analytics
- Survey Reports
- Research Institute
- Latest Research Reports
- Opinion Leaders
Secondary Research
- Annual Reports
- White Paper
- Latest Press Release
- Industry Association
- Paid Database
- Investor Presentations

Step 4 - Data Triangulation
Involves using different sources of information in order to increase the validity of a study
These sources are likely to be stakeholders in a program - participants, other researchers, program staff, other community members, and so on.
Then we put all data in single framework & apply various statistical tools to find out the dynamic on the market.
During the analysis stage, feedback from the stakeholder groups would be compared to determine areas of agreement as well as areas of divergence


