
Key Insights
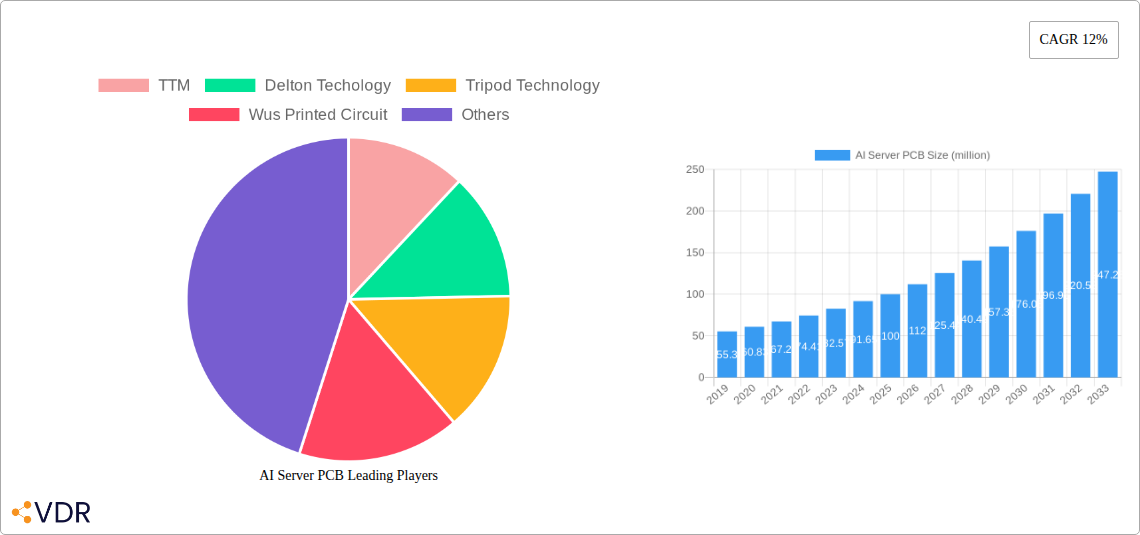
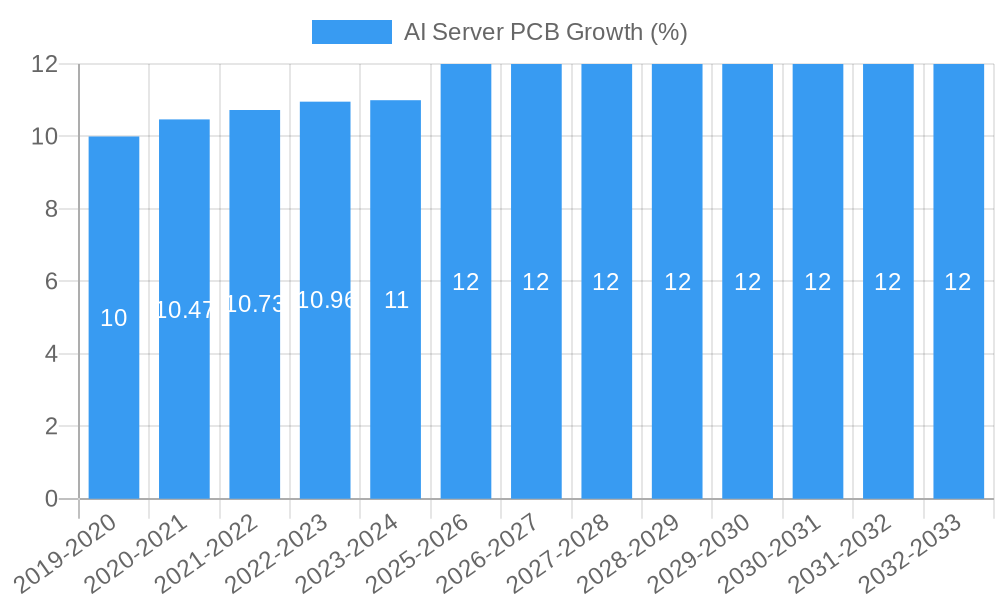
The global AI Server PCB market is poised for significant expansion, projected to reach \$100 million in 2025 and exhibit a robust Compound Annual Growth Rate (CAGR) of 12% through 2033. This impressive growth is primarily propelled by the insatiable demand for AI-powered applications across various sectors. High-performance computing (HPC), which forms a substantial segment, is a key driver, as AI workloads necessitate powerful and reliable server infrastructure. The burgeoning e-commerce sector, with its increasing reliance on AI for personalization, recommendation engines, and fraud detection, also significantly contributes to this demand. The finance industry is another major contributor, leveraging AI for algorithmic trading, risk assessment, and customer service automation. Furthermore, the gaming industry's evolution towards more immersive and AI-driven experiences, coupled with the "Other" applications encompassing healthcare, autonomous vehicles, and smart cities, collectively fuel the need for advanced PCBs capable of handling the complex computational demands of AI servers.
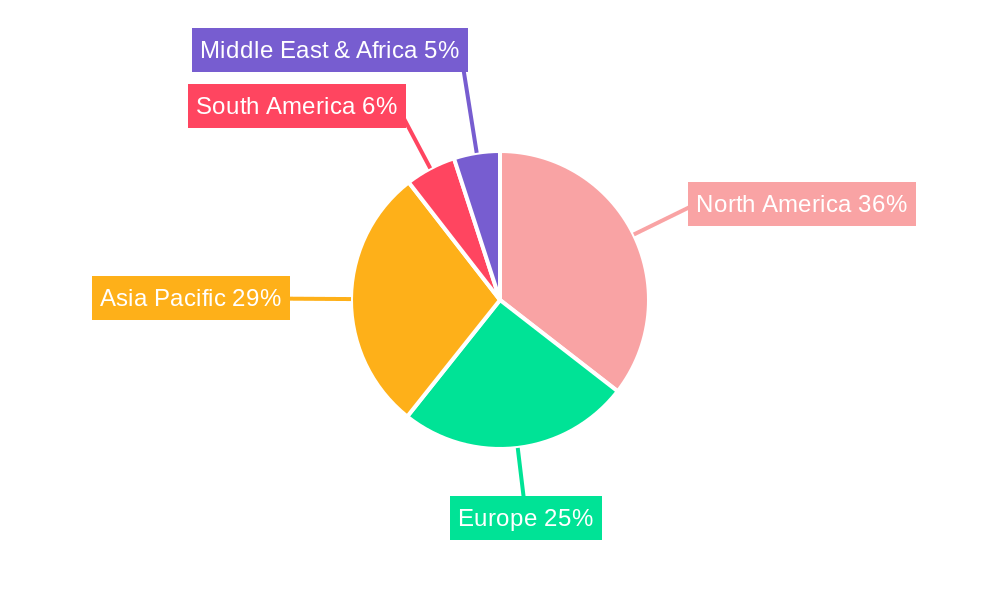
The market is segmented by PCB layer count, with 20, 24, and 28-layer configurations being prominent. The increasing complexity of AI processing units and the need for higher signal integrity and density are driving the adoption of higher layer count PCBs. Geographically, North America, led by the United States, is expected to dominate the market, owing to its advanced technological infrastructure and significant investments in AI research and development. Asia Pacific, particularly China, is emerging as a critical growth region, driven by its rapidly expanding manufacturing capabilities and substantial government support for AI adoption. Europe and other regions also present considerable opportunities as AI integration becomes more widespread. While growth is strong, potential restraints could include the rising costs of advanced materials and manufacturing processes, as well as supply chain complexities for specialized components, though these are generally outweighed by the overwhelming market opportunities.
AI Server PCB Market Report: Strategic Insights and Growth Forecast (2019-2033)
This comprehensive report offers a deep dive into the AI Server PCB market, providing critical intelligence for industry stakeholders. Covering the period from 2019 to 2033, with a base and estimated year of 2025 and a forecast period from 2025 to 2033, this analysis unpacks the dynamics, growth drivers, and future trajectory of this vital segment within the broader PCB industry. With a focus on high-traffic keywords and parent/child market analysis, this report is designed to maximize visibility and deliver actionable insights.
AI Server PCB Market Dynamics & Structure
The AI Server PCB market is characterized by a dynamic interplay of technological innovation, evolving end-user demands, and a competitive landscape. Market concentration, while not overtly monopolistic, is influenced by the presence of established players and the increasing specialization required for high-performance computing applications. Technological innovation, particularly in advanced packaging, miniaturization, and thermal management, serves as a primary driver, enabling the complex computations demanded by AI workloads. Regulatory frameworks, while still developing in specific AI-related sectors, are increasingly focusing on data security and ethical AI deployment, which indirectly impacts hardware requirements. Competitive product substitutes, such as specialized ASICs and FPGAs, pose a challenge but also highlight the foundational role of robust PCBs. End-user demographics are shifting rapidly, with a growing demand from sectors like e-commerce and finance adopting AI for enhanced operations. Mergers and acquisitions (M&A) are anticipated to play a significant role in consolidating expertise and market share, particularly in areas requiring significant R&D investment.
- Market Concentration: Moderate, with key players dominating specialized segments.
- Technological Innovation Drivers: Advanced interconnects, higher layer counts, and superior thermal dissipation.
- Regulatory Frameworks: Indirect influence through AI ethics and data privacy standards.
- Competitive Product Substitutes: ASICs, FPGAs, and other specialized computing hardware.
- End-User Demographics: Expansion into cloud computing, scientific research, and autonomous systems.
- M&A Trends: Consolidation for synergistic technological capabilities and market access.
AI Server PCB Growth Trends & Insights
The AI Server PCB market is poised for exceptional growth, driven by the exponential increase in AI adoption across various industries. The market size evolution is projected to accelerate significantly, fueled by the insatiable demand for more powerful and efficient AI processing. Adoption rates are climbing as businesses recognize the transformative potential of AI in areas such as machine learning, deep learning, and natural language processing. Technological disruptions, including advancements in silicon manufacturing and sophisticated PCB design techniques, are creating new possibilities for enhanced performance and reduced form factors. Consumer behavior shifts, with an increasing reliance on AI-powered services and products, are indirectly translating into a higher demand for the underlying hardware infrastructure. The CAGR for this market is anticipated to be robust, reflecting the foundational role of AI server PCBs in the broader digital transformation. Market penetration is expanding beyond traditional data centers into edge computing environments, further diversifying demand.
The market is expected to witness a substantial surge in value, driven by the escalating need for high-density interconnect (HDI) PCBs and multi-layer PCBs capable of handling complex routing and signal integrity requirements for AI accelerators like GPUs and NPUs. The development of specialized materials with improved thermal conductivity and dielectric properties will be crucial for dissipating heat generated by these power-hungry components, thereby ensuring operational stability and longevity. Furthermore, the increasing adoption of AI in real-time applications, such as autonomous vehicles and smart manufacturing, will necessitate low-latency and high-speed PCB designs. The forecast period is anticipated to be marked by significant investments in R&D, focusing on the development of PCBs that can support next-generation AI architectures and higher compute densities. The ability of AI server PCBs to facilitate seamless data flow and processing at scale will be a critical determinant of market growth, impacting everything from cloud infrastructure providers to specialized AI hardware manufacturers. The evolving landscape of AI workloads, from training massive neural networks to inferencing at the edge, will continue to push the boundaries of PCB technology, demanding innovative solutions for power delivery, signal integrity, and thermal management. The synergy between AI algorithms and hardware capabilities will be a defining characteristic of this market's future.
Dominant Regions, Countries, or Segments in AI Server PCB
North America is currently the dominant region in the AI Server PCB market, driven by its robust technological ecosystem, significant investments in AI research and development, and the presence of major hyperscale cloud providers and AI chip manufacturers. The United States, in particular, spearheads this dominance due to its advanced technological infrastructure and strong presence of leading AI companies. Within the Application segment, High Performance Computing (HPC) is the primary growth engine, as AI model training and complex simulations inherently require the most sophisticated and high-performance PCBs. E-commerce and Finance are rapidly emerging as significant contributors, leveraging AI for personalization, fraud detection, and algorithmic trading, thus demanding scalable and reliable server infrastructure. The Game segment also shows strong growth, with AI enhancing gaming experiences and requiring powerful graphics processing capabilities. The Other application segment, encompassing areas like scientific research and industrial automation, is also experiencing an upward trend.
Regarding Types, PCBs with higher layer counts, specifically 28 Layers, are seeing increased demand due to the intricate routing and power delivery needs of cutting-edge AI processors. While 20 Layers and 24 Layers PCBs remain prevalent for less demanding AI applications and established server architectures, the trend is clearly towards higher density and complexity. Economic policies in North America, such as government funding for AI research and favorable business environments for tech startups, further bolster the region's leadership. Infrastructure investments in advanced semiconductor manufacturing and data center expansion are critical factors supporting this dominance. The concentration of AI talent and the rapid adoption of AI-driven solutions across various industries in this region create a fertile ground for the AI Server PCB market. The competitive advantage enjoyed by North America is also attributed to its early adoption of advanced PCB manufacturing technologies and a strong intellectual property landscape.
- Leading Region: North America (primarily the United States)
- Dominant Application: High Performance Computing (HPC)
- Emerging Applications: E-commerce, Finance, Game
- Key Type Driver: 28 Layers PCBs (driven by complex AI processor requirements)
- Growth Drivers: Strong R&D investment, presence of hyperscale cloud providers, favorable economic policies, advanced technological infrastructure.
AI Server PCB Product Landscape
The AI Server PCB product landscape is defined by relentless innovation, pushing the boundaries of electrical engineering to support increasingly complex AI workloads. Product innovations focus on higher layer counts, advanced materials with superior thermal conductivity, and optimized signal integrity to handle the immense data throughput and processing power demanded by AI accelerators. Applications span from dense server farms for deep learning training to specialized boards for edge AI inference devices. Performance metrics such as signal loss, power delivery network (PDN) impedance control, and thermal resistance are paramount. Unique selling propositions often lie in miniaturization, enhanced reliability under extreme operating conditions, and the integration of advanced features like blind and buried vias for increased routing density. Technological advancements are continuously being made in areas like advanced substrate materials, high-density interconnect (HDI) technologies, and improved manufacturing processes to meet the exacting demands of the AI server ecosystem.
Key Drivers, Barriers & Challenges in AI Server PCB
The AI Server PCB market is propelled by significant drivers, including the escalating demand for AI-powered services and the continuous advancement of AI algorithms requiring more sophisticated hardware. Technological breakthroughs in semiconductor design, necessitating higher performance PCBs, are a major catalyst. The expansion of cloud computing and the growth of edge AI further fuel this demand. The increasing adoption of AI in critical sectors like healthcare and finance also acts as a significant growth accelerator.
However, the market faces considerable barriers and challenges. High R&D costs associated with developing cutting-edge PCB technologies pose a significant hurdle for smaller players. Supply chain disruptions, particularly concerning specialized materials and components, can impact production timelines and costs. Stringent quality control and reliability standards required for mission-critical AI applications add complexity. Intense competition and price pressures from established and emerging manufacturers also present challenges. Regulatory hurdles, especially concerning environmental compliance and material sourcing, can also slow down market expansion.
Emerging Opportunities in AI Server PCB
Emerging opportunities in the AI Server PCB sector are vast and varied. The burgeoning field of AI at the edge presents a significant untapped market, requiring compact, power-efficient, and robust PCBs for devices in smart cities, industrial IoT, and autonomous systems. Innovative applications in areas like AI-driven drug discovery and personalized medicine are creating demand for specialized, high-performance computing platforms. Evolving consumer preferences for AI-enhanced experiences in gaming, entertainment, and personalized services will continue to drive the need for more advanced server infrastructure. The development of sustainable and eco-friendly PCB manufacturing processes also represents an emerging opportunity for companies that can innovate in this space.
Growth Accelerators in the AI Server PCB Industry
Several key growth accelerators are poised to significantly propel the AI Server PCB industry forward. Technological breakthroughs in areas such as advanced materials science, enabling PCBs with unprecedented thermal management capabilities and higher signal speeds, will be pivotal. Strategic partnerships between AI chip manufacturers, server OEMs, and PCB fabricators are crucial for co-design and optimization, ensuring hardware capabilities align with evolving AI workloads. Market expansion strategies targeting new geographical regions and emerging AI applications, such as AI in agriculture and climate modeling, will unlock new revenue streams. The increasing demand for custom AI accelerators, which often require bespoke PCB solutions, further contributes to this growth trajectory.
Key Players Shaping the AI Server PCB Market
- TTM
- Delton Technology
- Tripod Technology
- WUS Printed Circuit
Notable Milestones in AI Server PCB Sector
- 2019: Increased adoption of 16-layer and 20-layer PCBs for early-generation AI accelerators.
- 2020: Introduction of advanced dielectric materials with improved thermal performance in high-layer count PCBs.
- 2021: Significant investments in R&D by key players to develop PCBs supporting next-generation GPUs and NPUs.
- 2022: Growing demand for PCBs with high-density interconnect (HDI) features for compact AI server designs.
- 2023: Enhanced focus on supply chain resilience and diversification for critical PCB components.
- 2024: Emerging trends towards miniaturization and increased power efficiency in AI server PCB designs for edge computing.
In-Depth AI Server PCB Market Outlook
The AI Server PCB market outlook is exceptionally bright, with growth accelerators pointing towards sustained and significant expansion. The continuous innovation in AI algorithms and hardware, coupled with the relentless demand for enhanced computing power, will ensure a strong pipeline of opportunities. Strategic partnerships and collaborations will be crucial for navigating the complex technological landscape and accelerating product development. Market expansion into emerging applications and geographical regions will further diversify the revenue streams. The industry is well-positioned to benefit from the ongoing digital transformation, with AI server PCBs serving as a fundamental enabler of future technological advancements and economic growth.
AI Server PCB Segmentation
-
1. Application
- 1.1. High Performance Computing
- 1.2. E-commerce
- 1.3. Finance
- 1.4. Game
- 1.5. Other
-
2. Types
- 2.1. 20 Layers
- 2.2. 24 Layers
- 2.3. 28 Layers
AI Server PCB Segmentation By Geography
-
1. North America
- 1.1. United States
- 1.2. Canada
- 1.3. Mexico
-
2. South America
- 2.1. Brazil
- 2.2. Argentina
- 2.3. Rest of South America
-
3. Europe
- 3.1. United Kingdom
- 3.2. Germany
- 3.3. France
- 3.4. Italy
- 3.5. Spain
- 3.6. Russia
- 3.7. Benelux
- 3.8. Nordics
- 3.9. Rest of Europe
-
4. Middle East & Africa
- 4.1. Turkey
- 4.2. Israel
- 4.3. GCC
- 4.4. North Africa
- 4.5. South Africa
- 4.6. Rest of Middle East & Africa
-
5. Asia Pacific
- 5.1. China
- 5.2. India
- 5.3. Japan
- 5.4. South Korea
- 5.5. ASEAN
- 5.6. Oceania
- 5.7. Rest of Asia Pacific
AI Server PCB REPORT HIGHLIGHTS
| Aspects | Details |
|---|---|
| Study Period | 2019-2033 |
| Base Year | 2024 |
| Estimated Year | 2025 |
| Forecast Period | 2025-2033 |
| Historical Period | 2019-2024 |
| Growth Rate | CAGR of 12% from 2019-2033 |
| Segmentation |
|
Table of Contents
- 1. Introduction
- 1.1. Research Scope
- 1.2. Market Segmentation
- 1.3. Research Methodology
- 1.4. Definitions and Assumptions
- 2. Executive Summary
- 2.1. Introduction
- 3. Market Dynamics
- 3.1. Introduction
- 3.2. Market Drivers
- 3.3. Market Restrains
- 3.4. Market Trends
- 4. Market Factor Analysis
- 4.1. Porters Five Forces
- 4.2. Supply/Value Chain
- 4.3. PESTEL analysis
- 4.4. Market Entropy
- 4.5. Patent/Trademark Analysis
- 5. Global AI Server PCB Analysis, Insights and Forecast, 2019-2031
- 5.1. Market Analysis, Insights and Forecast - by Application
- 5.1.1. High Performance Computing
- 5.1.2. E-commerce
- 5.1.3. Finance
- 5.1.4. Game
- 5.1.5. Other
- 5.2. Market Analysis, Insights and Forecast - by Types
- 5.2.1. 20 Layers
- 5.2.2. 24 Layers
- 5.2.3. 28 Layers
- 5.3. Market Analysis, Insights and Forecast - by Region
- 5.3.1. North America
- 5.3.2. South America
- 5.3.3. Europe
- 5.3.4. Middle East & Africa
- 5.3.5. Asia Pacific
- 5.1. Market Analysis, Insights and Forecast - by Application
- 6. North America AI Server PCB Analysis, Insights and Forecast, 2019-2031
- 6.1. Market Analysis, Insights and Forecast - by Application
- 6.1.1. High Performance Computing
- 6.1.2. E-commerce
- 6.1.3. Finance
- 6.1.4. Game
- 6.1.5. Other
- 6.2. Market Analysis, Insights and Forecast - by Types
- 6.2.1. 20 Layers
- 6.2.2. 24 Layers
- 6.2.3. 28 Layers
- 6.1. Market Analysis, Insights and Forecast - by Application
- 7. South America AI Server PCB Analysis, Insights and Forecast, 2019-2031
- 7.1. Market Analysis, Insights and Forecast - by Application
- 7.1.1. High Performance Computing
- 7.1.2. E-commerce
- 7.1.3. Finance
- 7.1.4. Game
- 7.1.5. Other
- 7.2. Market Analysis, Insights and Forecast - by Types
- 7.2.1. 20 Layers
- 7.2.2. 24 Layers
- 7.2.3. 28 Layers
- 7.1. Market Analysis, Insights and Forecast - by Application
- 8. Europe AI Server PCB Analysis, Insights and Forecast, 2019-2031
- 8.1. Market Analysis, Insights and Forecast - by Application
- 8.1.1. High Performance Computing
- 8.1.2. E-commerce
- 8.1.3. Finance
- 8.1.4. Game
- 8.1.5. Other
- 8.2. Market Analysis, Insights and Forecast - by Types
- 8.2.1. 20 Layers
- 8.2.2. 24 Layers
- 8.2.3. 28 Layers
- 8.1. Market Analysis, Insights and Forecast - by Application
- 9. Middle East & Africa AI Server PCB Analysis, Insights and Forecast, 2019-2031
- 9.1. Market Analysis, Insights and Forecast - by Application
- 9.1.1. High Performance Computing
- 9.1.2. E-commerce
- 9.1.3. Finance
- 9.1.4. Game
- 9.1.5. Other
- 9.2. Market Analysis, Insights and Forecast - by Types
- 9.2.1. 20 Layers
- 9.2.2. 24 Layers
- 9.2.3. 28 Layers
- 9.1. Market Analysis, Insights and Forecast - by Application
- 10. Asia Pacific AI Server PCB Analysis, Insights and Forecast, 2019-2031
- 10.1. Market Analysis, Insights and Forecast - by Application
- 10.1.1. High Performance Computing
- 10.1.2. E-commerce
- 10.1.3. Finance
- 10.1.4. Game
- 10.1.5. Other
- 10.2. Market Analysis, Insights and Forecast - by Types
- 10.2.1. 20 Layers
- 10.2.2. 24 Layers
- 10.2.3. 28 Layers
- 10.1. Market Analysis, Insights and Forecast - by Application
- 11. Competitive Analysis
- 11.1. Global Market Share Analysis 2024
- 11.2. Company Profiles
- 11.2.1 TTM
- 11.2.1.1. Overview
- 11.2.1.2. Products
- 11.2.1.3. SWOT Analysis
- 11.2.1.4. Recent Developments
- 11.2.1.5. Financials (Based on Availability)
- 11.2.2 Delton Techology
- 11.2.2.1. Overview
- 11.2.2.2. Products
- 11.2.2.3. SWOT Analysis
- 11.2.2.4. Recent Developments
- 11.2.2.5. Financials (Based on Availability)
- 11.2.3 Tripod Technology
- 11.2.3.1. Overview
- 11.2.3.2. Products
- 11.2.3.3. SWOT Analysis
- 11.2.3.4. Recent Developments
- 11.2.3.5. Financials (Based on Availability)
- 11.2.4 Wus Printed Circuit
- 11.2.4.1. Overview
- 11.2.4.2. Products
- 11.2.4.3. SWOT Analysis
- 11.2.4.4. Recent Developments
- 11.2.4.5. Financials (Based on Availability)
- 11.2.1 TTM
List of Figures
- Figure 1: Global AI Server PCB Revenue Breakdown (million, %) by Region 2024 & 2032
- Figure 2: Global AI Server PCB Volume Breakdown (K, %) by Region 2024 & 2032
- Figure 3: North America AI Server PCB Revenue (million), by Application 2024 & 2032
- Figure 4: North America AI Server PCB Volume (K), by Application 2024 & 2032
- Figure 5: North America AI Server PCB Revenue Share (%), by Application 2024 & 2032
- Figure 6: North America AI Server PCB Volume Share (%), by Application 2024 & 2032
- Figure 7: North America AI Server PCB Revenue (million), by Types 2024 & 2032
- Figure 8: North America AI Server PCB Volume (K), by Types 2024 & 2032
- Figure 9: North America AI Server PCB Revenue Share (%), by Types 2024 & 2032
- Figure 10: North America AI Server PCB Volume Share (%), by Types 2024 & 2032
- Figure 11: North America AI Server PCB Revenue (million), by Country 2024 & 2032
- Figure 12: North America AI Server PCB Volume (K), by Country 2024 & 2032
- Figure 13: North America AI Server PCB Revenue Share (%), by Country 2024 & 2032
- Figure 14: North America AI Server PCB Volume Share (%), by Country 2024 & 2032
- Figure 15: South America AI Server PCB Revenue (million), by Application 2024 & 2032
- Figure 16: South America AI Server PCB Volume (K), by Application 2024 & 2032
- Figure 17: South America AI Server PCB Revenue Share (%), by Application 2024 & 2032
- Figure 18: South America AI Server PCB Volume Share (%), by Application 2024 & 2032
- Figure 19: South America AI Server PCB Revenue (million), by Types 2024 & 2032
- Figure 20: South America AI Server PCB Volume (K), by Types 2024 & 2032
- Figure 21: South America AI Server PCB Revenue Share (%), by Types 2024 & 2032
- Figure 22: South America AI Server PCB Volume Share (%), by Types 2024 & 2032
- Figure 23: South America AI Server PCB Revenue (million), by Country 2024 & 2032
- Figure 24: South America AI Server PCB Volume (K), by Country 2024 & 2032
- Figure 25: South America AI Server PCB Revenue Share (%), by Country 2024 & 2032
- Figure 26: South America AI Server PCB Volume Share (%), by Country 2024 & 2032
- Figure 27: Europe AI Server PCB Revenue (million), by Application 2024 & 2032
- Figure 28: Europe AI Server PCB Volume (K), by Application 2024 & 2032
- Figure 29: Europe AI Server PCB Revenue Share (%), by Application 2024 & 2032
- Figure 30: Europe AI Server PCB Volume Share (%), by Application 2024 & 2032
- Figure 31: Europe AI Server PCB Revenue (million), by Types 2024 & 2032
- Figure 32: Europe AI Server PCB Volume (K), by Types 2024 & 2032
- Figure 33: Europe AI Server PCB Revenue Share (%), by Types 2024 & 2032
- Figure 34: Europe AI Server PCB Volume Share (%), by Types 2024 & 2032
- Figure 35: Europe AI Server PCB Revenue (million), by Country 2024 & 2032
- Figure 36: Europe AI Server PCB Volume (K), by Country 2024 & 2032
- Figure 37: Europe AI Server PCB Revenue Share (%), by Country 2024 & 2032
- Figure 38: Europe AI Server PCB Volume Share (%), by Country 2024 & 2032
- Figure 39: Middle East & Africa AI Server PCB Revenue (million), by Application 2024 & 2032
- Figure 40: Middle East & Africa AI Server PCB Volume (K), by Application 2024 & 2032
- Figure 41: Middle East & Africa AI Server PCB Revenue Share (%), by Application 2024 & 2032
- Figure 42: Middle East & Africa AI Server PCB Volume Share (%), by Application 2024 & 2032
- Figure 43: Middle East & Africa AI Server PCB Revenue (million), by Types 2024 & 2032
- Figure 44: Middle East & Africa AI Server PCB Volume (K), by Types 2024 & 2032
- Figure 45: Middle East & Africa AI Server PCB Revenue Share (%), by Types 2024 & 2032
- Figure 46: Middle East & Africa AI Server PCB Volume Share (%), by Types 2024 & 2032
- Figure 47: Middle East & Africa AI Server PCB Revenue (million), by Country 2024 & 2032
- Figure 48: Middle East & Africa AI Server PCB Volume (K), by Country 2024 & 2032
- Figure 49: Middle East & Africa AI Server PCB Revenue Share (%), by Country 2024 & 2032
- Figure 50: Middle East & Africa AI Server PCB Volume Share (%), by Country 2024 & 2032
- Figure 51: Asia Pacific AI Server PCB Revenue (million), by Application 2024 & 2032
- Figure 52: Asia Pacific AI Server PCB Volume (K), by Application 2024 & 2032
- Figure 53: Asia Pacific AI Server PCB Revenue Share (%), by Application 2024 & 2032
- Figure 54: Asia Pacific AI Server PCB Volume Share (%), by Application 2024 & 2032
- Figure 55: Asia Pacific AI Server PCB Revenue (million), by Types 2024 & 2032
- Figure 56: Asia Pacific AI Server PCB Volume (K), by Types 2024 & 2032
- Figure 57: Asia Pacific AI Server PCB Revenue Share (%), by Types 2024 & 2032
- Figure 58: Asia Pacific AI Server PCB Volume Share (%), by Types 2024 & 2032
- Figure 59: Asia Pacific AI Server PCB Revenue (million), by Country 2024 & 2032
- Figure 60: Asia Pacific AI Server PCB Volume (K), by Country 2024 & 2032
- Figure 61: Asia Pacific AI Server PCB Revenue Share (%), by Country 2024 & 2032
- Figure 62: Asia Pacific AI Server PCB Volume Share (%), by Country 2024 & 2032
List of Tables
- Table 1: Global AI Server PCB Revenue million Forecast, by Region 2019 & 2032
- Table 2: Global AI Server PCB Volume K Forecast, by Region 2019 & 2032
- Table 3: Global AI Server PCB Revenue million Forecast, by Application 2019 & 2032
- Table 4: Global AI Server PCB Volume K Forecast, by Application 2019 & 2032
- Table 5: Global AI Server PCB Revenue million Forecast, by Types 2019 & 2032
- Table 6: Global AI Server PCB Volume K Forecast, by Types 2019 & 2032
- Table 7: Global AI Server PCB Revenue million Forecast, by Region 2019 & 2032
- Table 8: Global AI Server PCB Volume K Forecast, by Region 2019 & 2032
- Table 9: Global AI Server PCB Revenue million Forecast, by Application 2019 & 2032
- Table 10: Global AI Server PCB Volume K Forecast, by Application 2019 & 2032
- Table 11: Global AI Server PCB Revenue million Forecast, by Types 2019 & 2032
- Table 12: Global AI Server PCB Volume K Forecast, by Types 2019 & 2032
- Table 13: Global AI Server PCB Revenue million Forecast, by Country 2019 & 2032
- Table 14: Global AI Server PCB Volume K Forecast, by Country 2019 & 2032
- Table 15: United States AI Server PCB Revenue (million) Forecast, by Application 2019 & 2032
- Table 16: United States AI Server PCB Volume (K) Forecast, by Application 2019 & 2032
- Table 17: Canada AI Server PCB Revenue (million) Forecast, by Application 2019 & 2032
- Table 18: Canada AI Server PCB Volume (K) Forecast, by Application 2019 & 2032
- Table 19: Mexico AI Server PCB Revenue (million) Forecast, by Application 2019 & 2032
- Table 20: Mexico AI Server PCB Volume (K) Forecast, by Application 2019 & 2032
- Table 21: Global AI Server PCB Revenue million Forecast, by Application 2019 & 2032
- Table 22: Global AI Server PCB Volume K Forecast, by Application 2019 & 2032
- Table 23: Global AI Server PCB Revenue million Forecast, by Types 2019 & 2032
- Table 24: Global AI Server PCB Volume K Forecast, by Types 2019 & 2032
- Table 25: Global AI Server PCB Revenue million Forecast, by Country 2019 & 2032
- Table 26: Global AI Server PCB Volume K Forecast, by Country 2019 & 2032
- Table 27: Brazil AI Server PCB Revenue (million) Forecast, by Application 2019 & 2032
- Table 28: Brazil AI Server PCB Volume (K) Forecast, by Application 2019 & 2032
- Table 29: Argentina AI Server PCB Revenue (million) Forecast, by Application 2019 & 2032
- Table 30: Argentina AI Server PCB Volume (K) Forecast, by Application 2019 & 2032
- Table 31: Rest of South America AI Server PCB Revenue (million) Forecast, by Application 2019 & 2032
- Table 32: Rest of South America AI Server PCB Volume (K) Forecast, by Application 2019 & 2032
- Table 33: Global AI Server PCB Revenue million Forecast, by Application 2019 & 2032
- Table 34: Global AI Server PCB Volume K Forecast, by Application 2019 & 2032
- Table 35: Global AI Server PCB Revenue million Forecast, by Types 2019 & 2032
- Table 36: Global AI Server PCB Volume K Forecast, by Types 2019 & 2032
- Table 37: Global AI Server PCB Revenue million Forecast, by Country 2019 & 2032
- Table 38: Global AI Server PCB Volume K Forecast, by Country 2019 & 2032
- Table 39: United Kingdom AI Server PCB Revenue (million) Forecast, by Application 2019 & 2032
- Table 40: United Kingdom AI Server PCB Volume (K) Forecast, by Application 2019 & 2032
- Table 41: Germany AI Server PCB Revenue (million) Forecast, by Application 2019 & 2032
- Table 42: Germany AI Server PCB Volume (K) Forecast, by Application 2019 & 2032
- Table 43: France AI Server PCB Revenue (million) Forecast, by Application 2019 & 2032
- Table 44: France AI Server PCB Volume (K) Forecast, by Application 2019 & 2032
- Table 45: Italy AI Server PCB Revenue (million) Forecast, by Application 2019 & 2032
- Table 46: Italy AI Server PCB Volume (K) Forecast, by Application 2019 & 2032
- Table 47: Spain AI Server PCB Revenue (million) Forecast, by Application 2019 & 2032
- Table 48: Spain AI Server PCB Volume (K) Forecast, by Application 2019 & 2032
- Table 49: Russia AI Server PCB Revenue (million) Forecast, by Application 2019 & 2032
- Table 50: Russia AI Server PCB Volume (K) Forecast, by Application 2019 & 2032
- Table 51: Benelux AI Server PCB Revenue (million) Forecast, by Application 2019 & 2032
- Table 52: Benelux AI Server PCB Volume (K) Forecast, by Application 2019 & 2032
- Table 53: Nordics AI Server PCB Revenue (million) Forecast, by Application 2019 & 2032
- Table 54: Nordics AI Server PCB Volume (K) Forecast, by Application 2019 & 2032
- Table 55: Rest of Europe AI Server PCB Revenue (million) Forecast, by Application 2019 & 2032
- Table 56: Rest of Europe AI Server PCB Volume (K) Forecast, by Application 2019 & 2032
- Table 57: Global AI Server PCB Revenue million Forecast, by Application 2019 & 2032
- Table 58: Global AI Server PCB Volume K Forecast, by Application 2019 & 2032
- Table 59: Global AI Server PCB Revenue million Forecast, by Types 2019 & 2032
- Table 60: Global AI Server PCB Volume K Forecast, by Types 2019 & 2032
- Table 61: Global AI Server PCB Revenue million Forecast, by Country 2019 & 2032
- Table 62: Global AI Server PCB Volume K Forecast, by Country 2019 & 2032
- Table 63: Turkey AI Server PCB Revenue (million) Forecast, by Application 2019 & 2032
- Table 64: Turkey AI Server PCB Volume (K) Forecast, by Application 2019 & 2032
- Table 65: Israel AI Server PCB Revenue (million) Forecast, by Application 2019 & 2032
- Table 66: Israel AI Server PCB Volume (K) Forecast, by Application 2019 & 2032
- Table 67: GCC AI Server PCB Revenue (million) Forecast, by Application 2019 & 2032
- Table 68: GCC AI Server PCB Volume (K) Forecast, by Application 2019 & 2032
- Table 69: North Africa AI Server PCB Revenue (million) Forecast, by Application 2019 & 2032
- Table 70: North Africa AI Server PCB Volume (K) Forecast, by Application 2019 & 2032
- Table 71: South Africa AI Server PCB Revenue (million) Forecast, by Application 2019 & 2032
- Table 72: South Africa AI Server PCB Volume (K) Forecast, by Application 2019 & 2032
- Table 73: Rest of Middle East & Africa AI Server PCB Revenue (million) Forecast, by Application 2019 & 2032
- Table 74: Rest of Middle East & Africa AI Server PCB Volume (K) Forecast, by Application 2019 & 2032
- Table 75: Global AI Server PCB Revenue million Forecast, by Application 2019 & 2032
- Table 76: Global AI Server PCB Volume K Forecast, by Application 2019 & 2032
- Table 77: Global AI Server PCB Revenue million Forecast, by Types 2019 & 2032
- Table 78: Global AI Server PCB Volume K Forecast, by Types 2019 & 2032
- Table 79: Global AI Server PCB Revenue million Forecast, by Country 2019 & 2032
- Table 80: Global AI Server PCB Volume K Forecast, by Country 2019 & 2032
- Table 81: China AI Server PCB Revenue (million) Forecast, by Application 2019 & 2032
- Table 82: China AI Server PCB Volume (K) Forecast, by Application 2019 & 2032
- Table 83: India AI Server PCB Revenue (million) Forecast, by Application 2019 & 2032
- Table 84: India AI Server PCB Volume (K) Forecast, by Application 2019 & 2032
- Table 85: Japan AI Server PCB Revenue (million) Forecast, by Application 2019 & 2032
- Table 86: Japan AI Server PCB Volume (K) Forecast, by Application 2019 & 2032
- Table 87: South Korea AI Server PCB Revenue (million) Forecast, by Application 2019 & 2032
- Table 88: South Korea AI Server PCB Volume (K) Forecast, by Application 2019 & 2032
- Table 89: ASEAN AI Server PCB Revenue (million) Forecast, by Application 2019 & 2032
- Table 90: ASEAN AI Server PCB Volume (K) Forecast, by Application 2019 & 2032
- Table 91: Oceania AI Server PCB Revenue (million) Forecast, by Application 2019 & 2032
- Table 92: Oceania AI Server PCB Volume (K) Forecast, by Application 2019 & 2032
- Table 93: Rest of Asia Pacific AI Server PCB Revenue (million) Forecast, by Application 2019 & 2032
- Table 94: Rest of Asia Pacific AI Server PCB Volume (K) Forecast, by Application 2019 & 2032
Frequently Asked Questions
1. What is the projected Compound Annual Growth Rate (CAGR) of the AI Server PCB?
The projected CAGR is approximately 12%.
2. Which companies are prominent players in the AI Server PCB?
Key companies in the market include TTM, Delton Techology, Tripod Technology, Wus Printed Circuit.
3. What are the main segments of the AI Server PCB?
The market segments include Application, Types.
4. Can you provide details about the market size?
The market size is estimated to be USD 100 million as of 2022.
5. What are some drivers contributing to market growth?
N/A
6. What are the notable trends driving market growth?
N/A
7. Are there any restraints impacting market growth?
N/A
8. Can you provide examples of recent developments in the market?
N/A
9. What pricing options are available for accessing the report?
Pricing options include single-user, multi-user, and enterprise licenses priced at USD 3950.00, USD 5925.00, and USD 7900.00 respectively.
10. Is the market size provided in terms of value or volume?
The market size is provided in terms of value, measured in million and volume, measured in K.
11. Are there any specific market keywords associated with the report?
Yes, the market keyword associated with the report is "AI Server PCB," which aids in identifying and referencing the specific market segment covered.
12. How do I determine which pricing option suits my needs best?
The pricing options vary based on user requirements and access needs. Individual users may opt for single-user licenses, while businesses requiring broader access may choose multi-user or enterprise licenses for cost-effective access to the report.
13. Are there any additional resources or data provided in the AI Server PCB report?
While the report offers comprehensive insights, it's advisable to review the specific contents or supplementary materials provided to ascertain if additional resources or data are available.
14. How can I stay updated on further developments or reports in the AI Server PCB?
To stay informed about further developments, trends, and reports in the AI Server PCB, consider subscribing to industry newsletters, following relevant companies and organizations, or regularly checking reputable industry news sources and publications.
Methodology
Step 1 - Identification of Relevant Samples Size from Population Database


Step 2 - Approaches for Defining Global Market Size (Value, Volume* & Price*)

Note*: In applicable scenarios
Step 3 - Data Sources
Primary Research
- Web Analytics
- Survey Reports
- Research Institute
- Latest Research Reports
- Opinion Leaders
Secondary Research
- Annual Reports
- White Paper
- Latest Press Release
- Industry Association
- Paid Database
- Investor Presentations

Step 4 - Data Triangulation
Involves using different sources of information in order to increase the validity of a study
These sources are likely to be stakeholders in a program - participants, other researchers, program staff, other community members, and so on.
Then we put all data in single framework & apply various statistical tools to find out the dynamic on the market.
During the analysis stage, feedback from the stakeholder groups would be compared to determine areas of agreement as well as areas of divergence


