

Key Insights
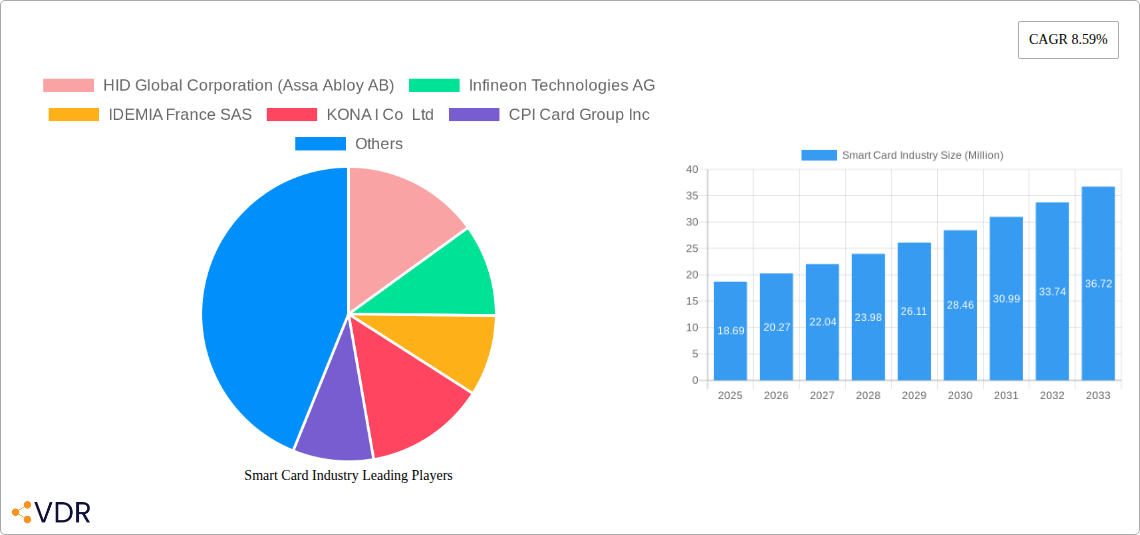
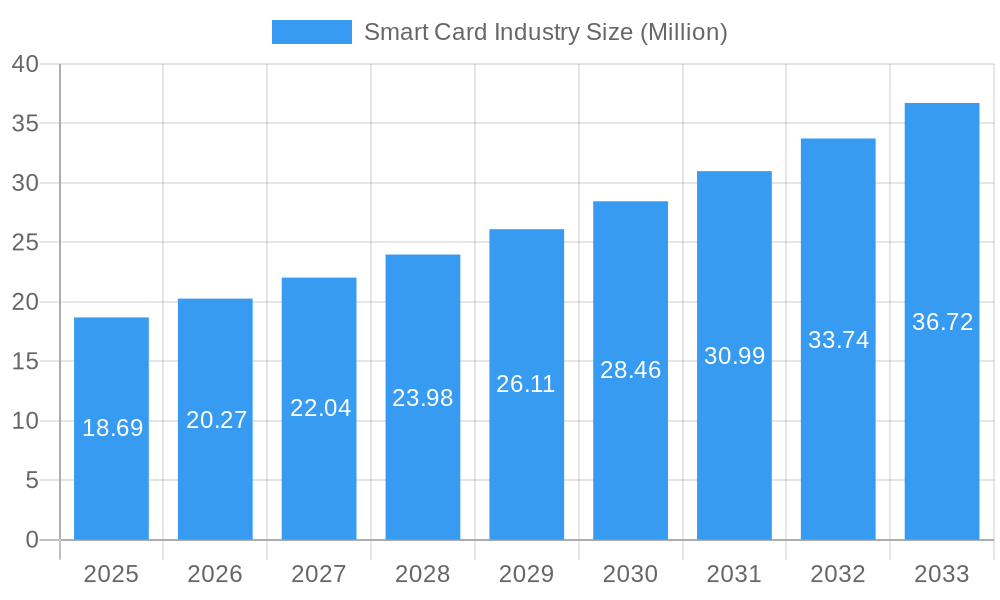
The global Smart Card Industry is poised for robust expansion, with an estimated market size of USD 18.69 million in the base year of 2025. This sector is projected to witness a healthy Compound Annual Growth Rate (CAGR) of 8.59% throughout the forecast period of 2025-2033, indicating sustained and significant market development. This growth is primarily fueled by the increasing demand for secure and convenient transaction and identification solutions across various end-user verticals. Key drivers include the escalating adoption of digital payment systems, the need for enhanced identity management in government and enterprise sectors, and the continuous innovation in contactless technologies that offer seamless user experiences. As more businesses and consumers prioritize security and efficiency, the smart card market will naturally benefit from this evolving landscape.
Smart Card Industry Market Size (In Million)
The market segmentation reveals a dynamic interplay between different types of smart card technologies and their adoption across diverse industries. Contact-based smart cards continue to hold their ground, particularly in legacy systems and applications requiring high levels of data security. However, the rapid advancement and widespread acceptance of contact-less smart cards are a significant trend, driven by their speed, convenience, and suitability for high-volume transactions, such as in public transportation and retail payments. Key end-user verticals like BFSI (Banking, Financial Services, and Insurance), IT & Telecommunication, and Government are leading the charge in smart card integration, leveraging these technologies for secure authentication, payment processing, and identity verification. Emerging applications within the Transportation sector further bolster market growth. While the market benefits from strong drivers, potential restraints could include the initial implementation costs of advanced smart card systems and evolving cybersecurity threats that necessitate continuous adaptation and investment in robust security protocols.
Smart Card Industry Company Market Share
Smart Card Industry Market Outlook 2025-2033: Revolutionizing Secure Transactions and Digital Identity
This comprehensive Smart Card Industry report provides an in-depth analysis of the global market, forecasting significant growth and evolution from 2019 to 2033. With a base year of 2025, the report leverages extensive data from the historical period (2019-2024) to deliver a robust outlook for the forecast period (2025-2033). We delve into market dynamics, growth trends, regional dominance, product landscape, key drivers, challenges, emerging opportunities, growth accelerators, and the strategic insights of key players. This report is indispensable for industry professionals seeking to understand market penetration, adoption rates, technological disruptions, and consumer behavior shifts in the rapidly expanding smart card ecosystem. Expect quantitative insights such as market share percentages and M&A deal volumes, alongside qualitative factors like innovation barriers, to guide strategic decision-making.
Smart Card Industry Market Dynamics & Structure
The global smart card market is characterized by a dynamic interplay of technological advancements, evolving regulatory landscapes, and shifting end-user demands. Market concentration is moderately fragmented, with key players investing heavily in research and development to maintain competitive advantages.
- Technological Innovation Drivers: The escalating need for enhanced security in digital transactions, the proliferation of contactless payment solutions, and the growing adoption of IoT devices are primary drivers of innovation. The integration of advanced cryptographic algorithms and the development of more sophisticated embedded secure elements are crucial.
- Regulatory Frameworks: Government initiatives promoting digital identity, secure e-government services, and data privacy regulations (e.g., GDPR, CCPA) significantly influence market development and product compliance.
- Competitive Product Substitutes: While smart cards offer superior security, they face competition from alternative solutions like mobile payment systems and biometric authentication methods. However, the inherent security and versatility of smart cards, especially in enterprise and government applications, ensure their continued relevance.
- End-User Demographics & M&A Trends: The increasing digital literacy across all age groups and the growing demand for convenience are expanding the end-user base. Mergers and acquisitions are a significant trend, with companies consolidating to gain market share, acquire new technologies, and expand their geographical reach. For instance, the acquisition of Gemalto by Thales Group underscored the strategic importance of secure identity solutions.
Smart Card Industry Growth Trends & Insights
The smart card industry is poised for substantial expansion, driven by an increasing demand for secure and convenient digital solutions across various sectors. Market size is projected to witness a healthy CAGR during the forecast period, fueled by widespread adoption in financial services, transportation, and government identity management. The shift towards contactless technology, accelerated by hygiene concerns and the desire for faster transactions, is a major adoption driver. Technological disruptions, such as the integration of AI and advanced biometrics into smart cards, are set to redefine their capabilities and open new application avenues. Consumer behavior is increasingly favoring secure, multi-functional cards that can streamline daily activities, from payments to access control and digital identity verification. The market penetration of smart cards is expected to deepen significantly as governments and enterprises prioritize secure digital transformation initiatives.
Dominant Regions, Countries, or Segments in Smart Card Industry
The global smart card industry’s growth is significantly influenced by regional economic policies, infrastructure development, and the adoption of advanced technologies. Asia Pacific, particularly countries like China and India, is emerging as a dominant region, driven by large populations, rapid digitalization, and government-backed initiatives promoting secure payment and identity solutions.
- Contact-Less Segment Dominance: The contact-less segment is experiencing the most rapid growth, driven by the convenience and speed it offers for transactions and access. This is particularly evident in the BFSI and Transportation verticals. The launch of the GoSmart National Common Mobility Card (NCMC) in India exemplifies this trend, facilitating seamless travel and payments across various services.
- BFSI Vertical as a Key Driver: The Banking, Financial Services, and Insurance (BFSI) sector remains a cornerstone of smart card adoption. Secure payment cards, EMV chip technology, and the increasing demand for contactless banking solutions contribute to its sustained dominance.
- Government Initiatives: Governments worldwide are leveraging smart cards for national ID programs, e-passports, and secure access to public services. This has made the Government vertical a significant growth engine, particularly in regions with robust digital identity frameworks.
- Transportation Sector Expansion: The integration of smart cards into public transportation systems, as seen with the NCMC initiative, is rapidly expanding the market. This segment benefits from the demand for integrated ticketing, fare collection, and mobility management solutions.
- IT & Telecommunication Growth: In the IT & Telecommunication sector, smart cards are crucial for SIM cards, secure network access, and identity authentication. The increasing number of connected devices and the need for robust security measures are driving growth in this segment.
Smart Card Industry Product Landscape
The smart card industry is characterized by continuous product innovation, focusing on enhanced security, increased functionality, and improved user experience. Products range from traditional contact-based cards to advanced contact-less solutions incorporating multi-application capabilities.
- Dual Interface Cards: These cards seamlessly support both contact and contact-less transactions, offering versatility for diverse payment and access scenarios.
- Embedded Secure Elements (eSE): Advancements in eSE technology enable richer functionalities, including secure storage of digital credentials, biometrics, and advanced cryptography, for applications like secure payments and digital identity.
- IoT-Enabled Smart Cards: The integration of smart card technology into IoT devices enhances their security and enables secure device authentication and data exchange.
- Biometric Smart Cards: The incorporation of fingerprint sensors or other biometric authentication features elevates security and user convenience for premium applications.
Key Drivers, Barriers & Challenges in Smart Card Industry
Key Drivers:
- Enhanced Security Demands: The pervasive threat of data breaches and fraud mandates the adoption of highly secure identification and transaction solutions, with smart cards at the forefront.
- Growth of Contactless Payments: The convenience, speed, and hygiene benefits of contactless transactions are accelerating the adoption of contact-less smart cards globally.
- Digital Identity Initiatives: Government-led initiatives for secure digital identities and e-government services are creating significant demand for smart card technology.
- IoT Expansion: The burgeoning Internet of Things ecosystem requires secure authentication and communication, a role well-suited for smart cards.
Barriers & Challenges:
- Interoperability and Standardization: Achieving seamless interoperability across different platforms and systems can be a challenge, requiring adherence to evolving global standards.
- Cost of Implementation: For some smaller businesses or specific applications, the initial cost of implementing smart card systems and infrastructure can be a barrier.
- Competition from Alternative Technologies: Mobile payment solutions and other digital authentication methods present ongoing competition, requiring smart card vendors to continually innovate.
- Supply Chain Disruptions: Geopolitical events and global manufacturing challenges can impact the availability of raw materials and components, affecting production and delivery timelines. The semiconductor shortage experienced in recent years is a prime example.
Emerging Opportunities in Smart Card Industry
The smart card industry is ripe with emerging opportunities driven by technological convergence and evolving consumer needs. The expansion of the Internet of Things (IoT) ecosystem presents a significant avenue for growth, with smart cards playing a crucial role in securing device authentication and data transmission. Furthermore, the increasing demand for advanced digital identity solutions in areas such as healthcare, education, and secure remote work presents untapped markets. The development of personalized and multi-functional smart cards that integrate loyalty programs, access control, and secure digital credentials is also a promising area, catering to the growing consumer preference for convenience and integrated solutions. The focus on sustainability, as highlighted by dzcard's new innovation center, also opens opportunities for eco-friendly card materials and production processes.
Growth Accelerators in the Smart Card Industry Industry
Several key catalysts are propelling the long-term growth of the smart card industry. Technological breakthroughs, such as advancements in embedded secure elements and the integration of advanced biometrics, are enhancing card capabilities and expanding their application scope. Strategic partnerships between technology providers, system integrators, and end-user industries are crucial for developing comprehensive solutions and accelerating market adoption. For example, collaborations between smart card manufacturers and mobile payment platforms can unlock new revenue streams. Market expansion strategies, particularly in emerging economies undergoing rapid digitalization, are also significant growth accelerators. The increasing focus on cybersecurity across all sectors globally will further bolster demand for the inherent security offered by smart cards.
Key Players Shaping the Smart Card Industry Market
- HID Global Corporation (Assa Abloy AB)
- Infineon Technologies AG
- IDEMIA France SAS
- KONA I Co Ltd
- CPI Card Group Inc
- Samsung Electronics Co Ltd
- Gemalto NV (Thales Group)
- Watchdata Technologies
- Secura Key
- Fingerprint Cards AB
- Alioth LLC
- CardLogix Corporation
- Giesecke & Devrient GmbH (MC Familiengesellschaft mbH)
- Bundesdruckerei GmbH
- IntelCav
Notable Milestones in Smart Card Industry Sector
- April 2023: The GoSmart National Common Mobility Card (NCMC) was launched for passengers using the Kanpur metro in India. This interchangeable transport card streamlines travel and payments for various services nationwide, enhancing convenience for travelers and saving them time and energy.
- January 2023: dzcard, a prominent secured smart card solution and digital security provider, inaugurated a new innovation center dedicated to next-generation card technologies with a focus on sustainability. This Bangkok-based lab will foster co-creation with clients and partners, emphasizing the development and evaluation of sustainable solutions.
In-Depth Smart Card Industry Market Outlook
The future of the smart card industry is characterized by significant potential for growth and strategic evolution. Key growth accelerators include the continued expansion of contactless payment infrastructure, the widespread implementation of secure digital identity programs by governments worldwide, and the increasing integration of smart card technology into the rapidly growing Internet of Things (IoT) ecosystem. The development of advanced functionalities, such as embedded biometrics and multi-application capabilities, will further enhance the value proposition of smart cards, driving adoption across a broader spectrum of industries. Strategic partnerships and ongoing technological innovation will be crucial in capitalizing on emerging opportunities and maintaining a competitive edge in this dynamic market.
Smart Card Industry Segmentation
-
1. Type
- 1.1. Contact-based
- 1.2. Contact-Less
-
2. End-user Vertical
- 2.1. BFSI
- 2.2. IT & Telecommunication
- 2.3. Government
- 2.4. Transportation
- 2.5. Other
Smart Card Industry Segmentation By Geography
-
1. North America
- 1.1. United States
- 1.2. Canada
-
2. Europe
- 2.1. United Kingdom
- 2.2. Germany
- 2.3. France
- 2.4. Rest of Europe
-
3. Asia Pacific
- 3.1. China
- 3.2. Japan
- 3.3. India
- 3.4. Rest of Asia Pacific
- 4. Rest of the World
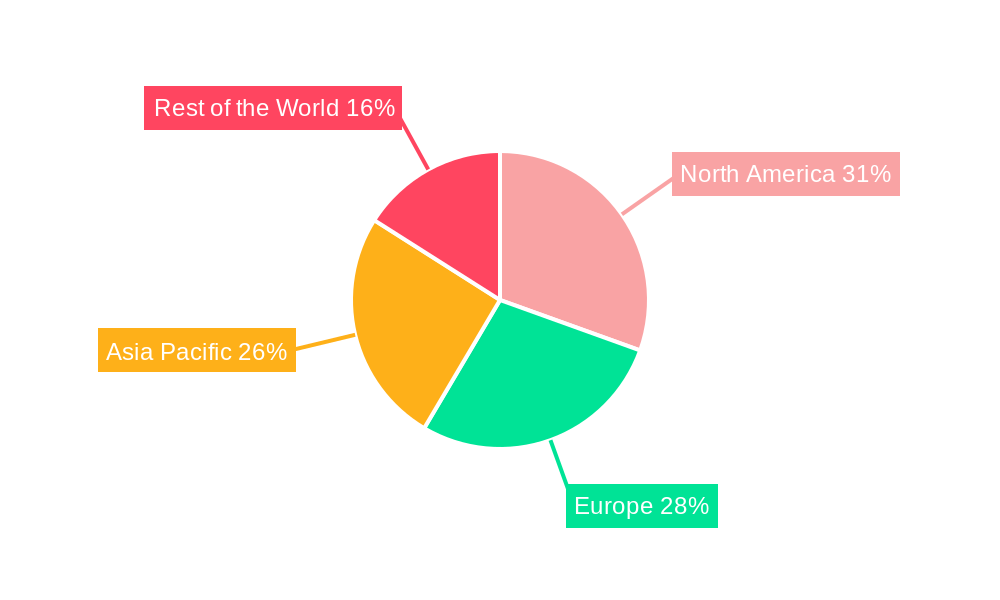
Smart Card Industry Regional Market Share
Geographic Coverage of Smart Card Industry
Smart Card Industry REPORT HIGHLIGHTS
| Aspects | Details |
|---|---|
| Study Period | 2020-2034 |
| Base Year | 2025 |
| Estimated Year | 2026 |
| Forecast Period | 2026-2034 |
| Historical Period | 2020-2025 |
| Growth Rate | CAGR of 8.59% from 2020-2034 |
| Segmentation |
|
Table of Contents
- 1. Introduction
- 1.1. Research Scope
- 1.2. Market Segmentation
- 1.3. Research Objective
- 1.4. Definitions and Assumptions
- 2. Executive Summary
- 2.1. Market Snapshot
- 3. Market Dynamics
- 3.1. Market Drivers
- 3.2. Market Restrains
- 3.3. Market Trends
- 3.4. Market Opportunities
- 4. Market Factor Analysis
- 4.1. Porters Five Forces
- 4.1.1. Bargaining Power of Suppliers
- 4.1.2. Bargaining Power of Buyers
- 4.1.3. Threat of New Entrants
- 4.1.4. Threat of Substitutes
- 4.1.5. Competitive Rivalry
- 4.2. PESTEL analysis
- 4.3. BCG Analysis
- 4.3.1. Stars (High Growth, High Market Share)
- 4.3.2. Cash Cows (Low Growth, High Market Share)
- 4.3.3. Question Mark (High Growth, Low Market Share)
- 4.3.4. Dogs (Low Growth, Low Market Share)
- 4.4. Ansoff Matrix Analysis
- 4.5. Supply Chain Analysis
- 4.6. Regulatory Landscape
- 4.7. Current Market Potential and Opportunity Assessment (TAM–SAM–SOM Framework)
- 4.8. VDR Analyst Note
- 4.1. Porters Five Forces
- 5. Market Analysis, Insights and Forecast 2021-2033
- 5.1. Market Analysis, Insights and Forecast - by Type
- 5.1.1. Contact-based
- 5.1.2. Contact-Less
- 5.2. Market Analysis, Insights and Forecast - by End-user Vertical
- 5.2.1. BFSI
- 5.2.2. IT & Telecommunication
- 5.2.3. Government
- 5.2.4. Transportation
- 5.2.5. Other
- 5.3. Market Analysis, Insights and Forecast - by Region
- 5.3.1. North America
- 5.3.2. Europe
- 5.3.3. Asia Pacific
- 5.3.4. Rest of the World
- 5.1. Market Analysis, Insights and Forecast - by Type
- 6. Global Smart Card Industry Analysis, Insights and Forecast, 2021-2033
- 6.1. Market Analysis, Insights and Forecast - by Type
- 6.1.1. Contact-based
- 6.1.2. Contact-Less
- 6.2. Market Analysis, Insights and Forecast - by End-user Vertical
- 6.2.1. BFSI
- 6.2.2. IT & Telecommunication
- 6.2.3. Government
- 6.2.4. Transportation
- 6.2.5. Other
- 6.1. Market Analysis, Insights and Forecast - by Type
- 7. North America Smart Card Industry Analysis, Insights and Forecast, 2021-2033
- 7.1. Market Analysis, Insights and Forecast - by Type
- 7.1.1. Contact-based
- 7.1.2. Contact-Less
- 7.2. Market Analysis, Insights and Forecast - by End-user Vertical
- 7.2.1. BFSI
- 7.2.2. IT & Telecommunication
- 7.2.3. Government
- 7.2.4. Transportation
- 7.2.5. Other
- 7.1. Market Analysis, Insights and Forecast - by Type
- 8. Europe Smart Card Industry Analysis, Insights and Forecast, 2021-2033
- 8.1. Market Analysis, Insights and Forecast - by Type
- 8.1.1. Contact-based
- 8.1.2. Contact-Less
- 8.2. Market Analysis, Insights and Forecast - by End-user Vertical
- 8.2.1. BFSI
- 8.2.2. IT & Telecommunication
- 8.2.3. Government
- 8.2.4. Transportation
- 8.2.5. Other
- 8.1. Market Analysis, Insights and Forecast - by Type
- 9. Asia Pacific Smart Card Industry Analysis, Insights and Forecast, 2021-2033
- 9.1. Market Analysis, Insights and Forecast - by Type
- 9.1.1. Contact-based
- 9.1.2. Contact-Less
- 9.2. Market Analysis, Insights and Forecast - by End-user Vertical
- 9.2.1. BFSI
- 9.2.2. IT & Telecommunication
- 9.2.3. Government
- 9.2.4. Transportation
- 9.2.5. Other
- 9.1. Market Analysis, Insights and Forecast - by Type
- 10. Rest of the World Smart Card Industry Analysis, Insights and Forecast, 2021-2033
- 10.1. Market Analysis, Insights and Forecast - by Type
- 10.1.1. Contact-based
- 10.1.2. Contact-Less
- 10.2. Market Analysis, Insights and Forecast - by End-user Vertical
- 10.2.1. BFSI
- 10.2.2. IT & Telecommunication
- 10.2.3. Government
- 10.2.4. Transportation
- 10.2.5. Other
- 10.1. Market Analysis, Insights and Forecast - by Type
- 11. Competitive Analysis
- 11.1. Company Profiles
- 11.1.1 HID Global Corporation (Assa Abloy AB)
- 11.1.1.1. Company Overview
- 11.1.1.2. Products
- 11.1.1.3. Company Financials
- 11.1.1.4. SWOT Analysis
- 11.1.2 Infineon Technologies AG
- 11.1.2.1. Company Overview
- 11.1.2.2. Products
- 11.1.2.3. Company Financials
- 11.1.2.4. SWOT Analysis
- 11.1.3 IDEMIA France SAS
- 11.1.3.1. Company Overview
- 11.1.3.2. Products
- 11.1.3.3. Company Financials
- 11.1.3.4. SWOT Analysis
- 11.1.4 KONA I Co Ltd
- 11.1.4.1. Company Overview
- 11.1.4.2. Products
- 11.1.4.3. Company Financials
- 11.1.4.4. SWOT Analysis
- 11.1.5 CPI Card Group Inc
- 11.1.5.1. Company Overview
- 11.1.5.2. Products
- 11.1.5.3. Company Financials
- 11.1.5.4. SWOT Analysis
- 11.1.6 Samsung Electronics Co Ltd
- 11.1.6.1. Company Overview
- 11.1.6.2. Products
- 11.1.6.3. Company Financials
- 11.1.6.4. SWOT Analysis
- 11.1.7 Gemalto NV (Thales Group)
- 11.1.7.1. Company Overview
- 11.1.7.2. Products
- 11.1.7.3. Company Financials
- 11.1.7.4. SWOT Analysis
- 11.1.8 Watchdata Technologies
- 11.1.8.1. Company Overview
- 11.1.8.2. Products
- 11.1.8.3. Company Financials
- 11.1.8.4. SWOT Analysis
- 11.1.9 Secura Key
- 11.1.9.1. Company Overview
- 11.1.9.2. Products
- 11.1.9.3. Company Financials
- 11.1.9.4. SWOT Analysis
- 11.1.10 Fingerprint Cards AB
- 11.1.10.1. Company Overview
- 11.1.10.2. Products
- 11.1.10.3. Company Financials
- 11.1.10.4. SWOT Analysis
- 11.1.11 Alioth LLC
- 11.1.11.1. Company Overview
- 11.1.11.2. Products
- 11.1.11.3. Company Financials
- 11.1.11.4. SWOT Analysis
- 11.1.12 CardLogix Corporation
- 11.1.12.1. Company Overview
- 11.1.12.2. Products
- 11.1.12.3. Company Financials
- 11.1.12.4. SWOT Analysis
- 11.1.13 Giesecke & Devrient GmbH (MC Familiengesellschaft mbH)
- 11.1.13.1. Company Overview
- 11.1.13.2. Products
- 11.1.13.3. Company Financials
- 11.1.13.4. SWOT Analysis
- 11.1.14 Bundesdruckerei GmbH
- 11.1.14.1. Company Overview
- 11.1.14.2. Products
- 11.1.14.3. Company Financials
- 11.1.14.4. SWOT Analysis
- 11.1.15 IntelCav
- 11.1.15.1. Company Overview
- 11.1.15.2. Products
- 11.1.15.3. Company Financials
- 11.1.15.4. SWOT Analysis
- 11.1.1 HID Global Corporation (Assa Abloy AB)
- 11.2. Market Entropy
- 11.2.1 Company's Key Areas Served
- 11.2.2 Recent Developments
- 11.3. Company Market Share Analysis 2025
- 11.3.1 Top 5 Companies Market Share Analysis
- 11.3.2 Top 3 Companies Market Share Analysis
- 11.4. List of Potential Customers
- 12. Research Methodology
List of Figures
- Figure 1: Global Smart Card Industry Revenue Breakdown (Million, %) by Region 2025 & 2033
- Figure 2: Global Smart Card Industry Volume Breakdown (K Unit, %) by Region 2025 & 2033
- Figure 3: North America Smart Card Industry Revenue (Million), by Type 2025 & 2033
- Figure 4: North America Smart Card Industry Volume (K Unit), by Type 2025 & 2033
- Figure 5: North America Smart Card Industry Revenue Share (%), by Type 2025 & 2033
- Figure 6: North America Smart Card Industry Volume Share (%), by Type 2025 & 2033
- Figure 7: North America Smart Card Industry Revenue (Million), by End-user Vertical 2025 & 2033
- Figure 8: North America Smart Card Industry Volume (K Unit), by End-user Vertical 2025 & 2033
- Figure 9: North America Smart Card Industry Revenue Share (%), by End-user Vertical 2025 & 2033
- Figure 10: North America Smart Card Industry Volume Share (%), by End-user Vertical 2025 & 2033
- Figure 11: North America Smart Card Industry Revenue (Million), by Country 2025 & 2033
- Figure 12: North America Smart Card Industry Volume (K Unit), by Country 2025 & 2033
- Figure 13: North America Smart Card Industry Revenue Share (%), by Country 2025 & 2033
- Figure 14: North America Smart Card Industry Volume Share (%), by Country 2025 & 2033
- Figure 15: Europe Smart Card Industry Revenue (Million), by Type 2025 & 2033
- Figure 16: Europe Smart Card Industry Volume (K Unit), by Type 2025 & 2033
- Figure 17: Europe Smart Card Industry Revenue Share (%), by Type 2025 & 2033
- Figure 18: Europe Smart Card Industry Volume Share (%), by Type 2025 & 2033
- Figure 19: Europe Smart Card Industry Revenue (Million), by End-user Vertical 2025 & 2033
- Figure 20: Europe Smart Card Industry Volume (K Unit), by End-user Vertical 2025 & 2033
- Figure 21: Europe Smart Card Industry Revenue Share (%), by End-user Vertical 2025 & 2033
- Figure 22: Europe Smart Card Industry Volume Share (%), by End-user Vertical 2025 & 2033
- Figure 23: Europe Smart Card Industry Revenue (Million), by Country 2025 & 2033
- Figure 24: Europe Smart Card Industry Volume (K Unit), by Country 2025 & 2033
- Figure 25: Europe Smart Card Industry Revenue Share (%), by Country 2025 & 2033
- Figure 26: Europe Smart Card Industry Volume Share (%), by Country 2025 & 2033
- Figure 27: Asia Pacific Smart Card Industry Revenue (Million), by Type 2025 & 2033
- Figure 28: Asia Pacific Smart Card Industry Volume (K Unit), by Type 2025 & 2033
- Figure 29: Asia Pacific Smart Card Industry Revenue Share (%), by Type 2025 & 2033
- Figure 30: Asia Pacific Smart Card Industry Volume Share (%), by Type 2025 & 2033
- Figure 31: Asia Pacific Smart Card Industry Revenue (Million), by End-user Vertical 2025 & 2033
- Figure 32: Asia Pacific Smart Card Industry Volume (K Unit), by End-user Vertical 2025 & 2033
- Figure 33: Asia Pacific Smart Card Industry Revenue Share (%), by End-user Vertical 2025 & 2033
- Figure 34: Asia Pacific Smart Card Industry Volume Share (%), by End-user Vertical 2025 & 2033
- Figure 35: Asia Pacific Smart Card Industry Revenue (Million), by Country 2025 & 2033
- Figure 36: Asia Pacific Smart Card Industry Volume (K Unit), by Country 2025 & 2033
- Figure 37: Asia Pacific Smart Card Industry Revenue Share (%), by Country 2025 & 2033
- Figure 38: Asia Pacific Smart Card Industry Volume Share (%), by Country 2025 & 2033
- Figure 39: Rest of the World Smart Card Industry Revenue (Million), by Type 2025 & 2033
- Figure 40: Rest of the World Smart Card Industry Volume (K Unit), by Type 2025 & 2033
- Figure 41: Rest of the World Smart Card Industry Revenue Share (%), by Type 2025 & 2033
- Figure 42: Rest of the World Smart Card Industry Volume Share (%), by Type 2025 & 2033
- Figure 43: Rest of the World Smart Card Industry Revenue (Million), by End-user Vertical 2025 & 2033
- Figure 44: Rest of the World Smart Card Industry Volume (K Unit), by End-user Vertical 2025 & 2033
- Figure 45: Rest of the World Smart Card Industry Revenue Share (%), by End-user Vertical 2025 & 2033
- Figure 46: Rest of the World Smart Card Industry Volume Share (%), by End-user Vertical 2025 & 2033
- Figure 47: Rest of the World Smart Card Industry Revenue (Million), by Country 2025 & 2033
- Figure 48: Rest of the World Smart Card Industry Volume (K Unit), by Country 2025 & 2033
- Figure 49: Rest of the World Smart Card Industry Revenue Share (%), by Country 2025 & 2033
- Figure 50: Rest of the World Smart Card Industry Volume Share (%), by Country 2025 & 2033
List of Tables
- Table 1: Global Smart Card Industry Revenue Million Forecast, by Type 2020 & 2033
- Table 2: Global Smart Card Industry Volume K Unit Forecast, by Type 2020 & 2033
- Table 3: Global Smart Card Industry Revenue Million Forecast, by End-user Vertical 2020 & 2033
- Table 4: Global Smart Card Industry Volume K Unit Forecast, by End-user Vertical 2020 & 2033
- Table 5: Global Smart Card Industry Revenue Million Forecast, by Region 2020 & 2033
- Table 6: Global Smart Card Industry Volume K Unit Forecast, by Region 2020 & 2033
- Table 7: Global Smart Card Industry Revenue Million Forecast, by Type 2020 & 2033
- Table 8: Global Smart Card Industry Volume K Unit Forecast, by Type 2020 & 2033
- Table 9: Global Smart Card Industry Revenue Million Forecast, by End-user Vertical 2020 & 2033
- Table 10: Global Smart Card Industry Volume K Unit Forecast, by End-user Vertical 2020 & 2033
- Table 11: Global Smart Card Industry Revenue Million Forecast, by Country 2020 & 2033
- Table 12: Global Smart Card Industry Volume K Unit Forecast, by Country 2020 & 2033
- Table 13: United States Smart Card Industry Revenue (Million) Forecast, by Application 2020 & 2033
- Table 14: United States Smart Card Industry Volume (K Unit) Forecast, by Application 2020 & 2033
- Table 15: Canada Smart Card Industry Revenue (Million) Forecast, by Application 2020 & 2033
- Table 16: Canada Smart Card Industry Volume (K Unit) Forecast, by Application 2020 & 2033
- Table 17: Global Smart Card Industry Revenue Million Forecast, by Type 2020 & 2033
- Table 18: Global Smart Card Industry Volume K Unit Forecast, by Type 2020 & 2033
- Table 19: Global Smart Card Industry Revenue Million Forecast, by End-user Vertical 2020 & 2033
- Table 20: Global Smart Card Industry Volume K Unit Forecast, by End-user Vertical 2020 & 2033
- Table 21: Global Smart Card Industry Revenue Million Forecast, by Country 2020 & 2033
- Table 22: Global Smart Card Industry Volume K Unit Forecast, by Country 2020 & 2033
- Table 23: United Kingdom Smart Card Industry Revenue (Million) Forecast, by Application 2020 & 2033
- Table 24: United Kingdom Smart Card Industry Volume (K Unit) Forecast, by Application 2020 & 2033
- Table 25: Germany Smart Card Industry Revenue (Million) Forecast, by Application 2020 & 2033
- Table 26: Germany Smart Card Industry Volume (K Unit) Forecast, by Application 2020 & 2033
- Table 27: France Smart Card Industry Revenue (Million) Forecast, by Application 2020 & 2033
- Table 28: France Smart Card Industry Volume (K Unit) Forecast, by Application 2020 & 2033
- Table 29: Rest of Europe Smart Card Industry Revenue (Million) Forecast, by Application 2020 & 2033
- Table 30: Rest of Europe Smart Card Industry Volume (K Unit) Forecast, by Application 2020 & 2033
- Table 31: Global Smart Card Industry Revenue Million Forecast, by Type 2020 & 2033
- Table 32: Global Smart Card Industry Volume K Unit Forecast, by Type 2020 & 2033
- Table 33: Global Smart Card Industry Revenue Million Forecast, by End-user Vertical 2020 & 2033
- Table 34: Global Smart Card Industry Volume K Unit Forecast, by End-user Vertical 2020 & 2033
- Table 35: Global Smart Card Industry Revenue Million Forecast, by Country 2020 & 2033
- Table 36: Global Smart Card Industry Volume K Unit Forecast, by Country 2020 & 2033
- Table 37: China Smart Card Industry Revenue (Million) Forecast, by Application 2020 & 2033
- Table 38: China Smart Card Industry Volume (K Unit) Forecast, by Application 2020 & 2033
- Table 39: Japan Smart Card Industry Revenue (Million) Forecast, by Application 2020 & 2033
- Table 40: Japan Smart Card Industry Volume (K Unit) Forecast, by Application 2020 & 2033
- Table 41: India Smart Card Industry Revenue (Million) Forecast, by Application 2020 & 2033
- Table 42: India Smart Card Industry Volume (K Unit) Forecast, by Application 2020 & 2033
- Table 43: Rest of Asia Pacific Smart Card Industry Revenue (Million) Forecast, by Application 2020 & 2033
- Table 44: Rest of Asia Pacific Smart Card Industry Volume (K Unit) Forecast, by Application 2020 & 2033
- Table 45: Global Smart Card Industry Revenue Million Forecast, by Type 2020 & 2033
- Table 46: Global Smart Card Industry Volume K Unit Forecast, by Type 2020 & 2033
- Table 47: Global Smart Card Industry Revenue Million Forecast, by End-user Vertical 2020 & 2033
- Table 48: Global Smart Card Industry Volume K Unit Forecast, by End-user Vertical 2020 & 2033
- Table 49: Global Smart Card Industry Revenue Million Forecast, by Country 2020 & 2033
- Table 50: Global Smart Card Industry Volume K Unit Forecast, by Country 2020 & 2033
Frequently Asked Questions
1. What is the projected Compound Annual Growth Rate (CAGR) of the Smart Card Industry?
The projected CAGR is approximately 8.59%.
2. Which companies are prominent players in the Smart Card Industry?
Key companies in the market include HID Global Corporation (Assa Abloy AB), Infineon Technologies AG, IDEMIA France SAS, KONA I Co Ltd, CPI Card Group Inc, Samsung Electronics Co Ltd, Gemalto NV (Thales Group), Watchdata Technologies, Secura Key, Fingerprint Cards AB, Alioth LLC, CardLogix Corporation, Giesecke & Devrient GmbH (MC Familiengesellschaft mbH), Bundesdruckerei GmbH, IntelCav.
3. What are the main segments of the Smart Card Industry?
The market segments include Type, End-user Vertical.
4. Can you provide details about the market size?
The market size is estimated to be USD 18.69 Million as of 2022.
5. What are some drivers contributing to market growth?
Growing Deployment in Personal Identification and Access Control Applications; Extensive Use in Travel Identity and Transportation; Growing Demand for Contactless Payments.
6. What are the notable trends driving market growth?
Growing Deployment in Personal Identification and Access Control Applications to Drive the Market Growth.
7. Are there any restraints impacting market growth?
Privacy and Security Issues and Standardization concerns.
8. Can you provide examples of recent developments in the market?
April 2023: The GoSmart National Common Mobility Card was launched for passengers using the Kanpur metro in India. The NCMC card was initially introduced in Uttar Pradesh by the Kanpur Metro. The primary advantage of this card is that it is an interchangeable transport card, meaning that it may be used for other NCMC-compliant retail, parking, metro, bus, and other transportation services throughout the nation. Travelers can easily traverse the entire nation with the NCMC card. Along with facilitating smooth mobility, this also helps travelers save time and energy.
9. What pricing options are available for accessing the report?
Pricing options include single-user, multi-user, and enterprise licenses priced at USD 4750, USD 5250, and USD 8750 respectively.
10. Is the market size provided in terms of value or volume?
The market size is provided in terms of value, measured in Million and volume, measured in K Unit.
11. Are there any specific market keywords associated with the report?
Yes, the market keyword associated with the report is "Smart Card Industry," which aids in identifying and referencing the specific market segment covered.
12. How do I determine which pricing option suits my needs best?
The pricing options vary based on user requirements and access needs. Individual users may opt for single-user licenses, while businesses requiring broader access may choose multi-user or enterprise licenses for cost-effective access to the report.
13. Are there any additional resources or data provided in the Smart Card Industry report?
While the report offers comprehensive insights, it's advisable to review the specific contents or supplementary materials provided to ascertain if additional resources or data are available.
14. How can I stay updated on further developments or reports in the Smart Card Industry?
To stay informed about further developments, trends, and reports in the Smart Card Industry, consider subscribing to industry newsletters, following relevant companies and organizations, or regularly checking reputable industry news sources and publications.
Methodology
Step 1 - Identification of Relevant Samples Size from Population Database


Step 2 - Approaches for Defining Global Market Size (Value, Volume* & Price*)

Note*: In applicable scenarios
Step 3 - Data Sources
Primary Research
- Web Analytics
- Survey Reports
- Research Institute
- Latest Research Reports
- Opinion Leaders
Secondary Research
- Annual Reports
- White Paper
- Latest Press Release
- Industry Association
- Paid Database
- Investor Presentations

Step 4 - Data Triangulation
Involves using different sources of information in order to increase the validity of a study
These sources are likely to be stakeholders in a program - participants, other researchers, program staff, other community members, and so on.
Then we put all data in single framework & apply various statistical tools to find out the dynamic on the market.
During the analysis stage, feedback from the stakeholder groups would be compared to determine areas of agreement as well as areas of divergence