

Key Insights
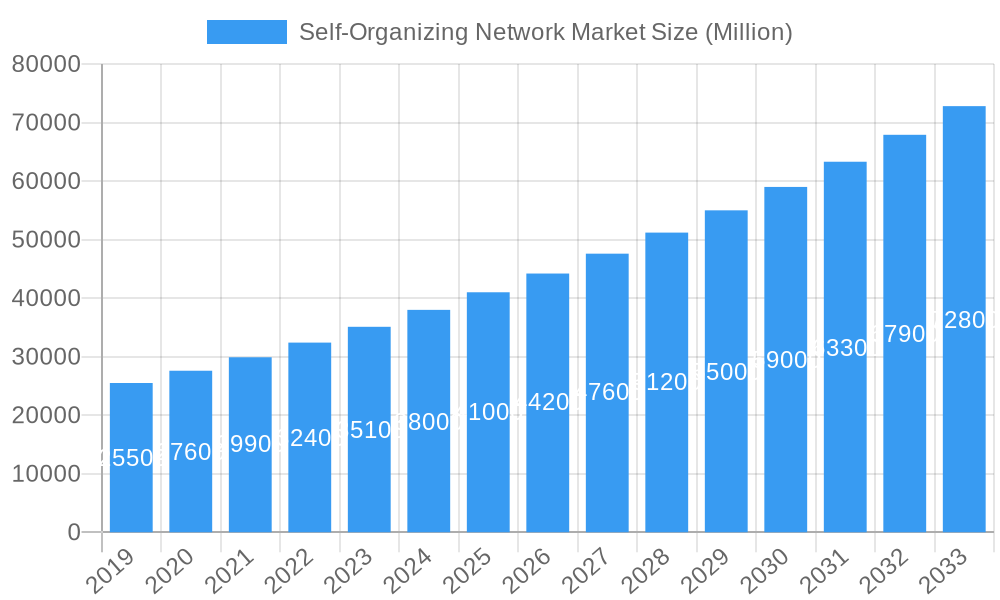
The Self-Organizing Network (SON) market is projected for substantial growth, reaching a market size of $6.55 billion by 2025, with a Compound Annual Growth Rate (CAGR) of 11.2%. This expansion is driven by the increasing complexity of modern wireless networks, especially the widespread adoption of 5G technology, which demands advanced automation and optimization. Key growth factors include the need for enhanced network efficiency, improved user experience, and reduced operational expenditures (OPEX). As mobile operators manage escalating data traffic and ensure seamless connectivity across 2G/3G, 4G/LTE, and 5G networks, SON solutions are becoming indispensable. Market segmentation shows balanced growth in both Software and Services, highlighting the importance of integrated solutions for SON implementation. Centralized (C-SON), Decentralized (D-SON), and Hybrid (H-SON) architectures contribute to this dynamic landscape, offering distinct advantages for various network deployments. Leading players such as Huawei Technologies, Ericsson, and Cisco Systems are investing in research and development to advance SON capabilities.
Self-Organizing Network Market Market Size (In Billion)
The market is anticipated to experience continued and accelerated growth through 2033. Emerging trends like AI and machine learning integration in SON platforms are revolutionizing network management, enabling predictive maintenance, dynamic resource allocation, and real-time anomaly detection. The rise of smart devices and the Internet of Things (IoT) further underscore the demand for highly optimized and self-healing networks. However, initial deployment costs for advanced SON solutions and the requirement for skilled personnel pose market restraints. Data security and privacy concerns, particularly with centralized data processing, also present challenges. Despite these obstacles, the significant benefits of improved network performance, reduced manual intervention, and the ability to manage complex heterogeneous networks are expected to drive substantial market value. The Asia Pacific region, led by China and India, is poised to be a primary growth engine, alongside established North American and European markets, due to rapid 5G infrastructure development and increasing data consumption.
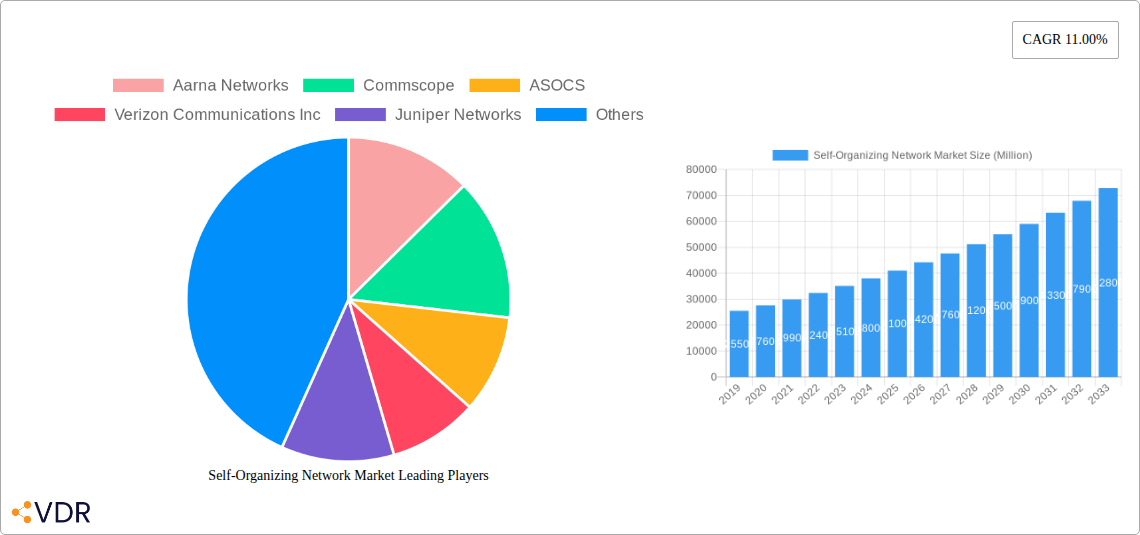
Self-Organizing Network Market Company Market Share
Self-Organizing Network (SON) Market Report: Driving Future Connectivity
Gain unparalleled insights into the rapidly expanding Self-Organizing Network (SON) market. This comprehensive report, meticulously crafted for industry professionals, offers an in-depth analysis of market dynamics, growth trajectories, regional dominance, product innovation, and key strategic initiatives. With a focus on high-traffic keywords such as "5G SON," "network automation," "software-defined networking," and "telco cloud," this report ensures maximum visibility and engagement within the telecommunications ecosystem. Explore parent and child market trends, understand the impact of emerging technologies, and identify lucrative opportunities within this critical sector.
Self-Organizing Network Market Market Dynamics & Structure
The Self-Organizing Network (SON) market is characterized by a moderately concentrated structure, with a few key players like Ericsson, Huawei Technologies, and Cisco Systems holding significant market share. However, the landscape is increasingly dynamic due to intense technological innovation, driving the evolution from Centralized SON (C-SON) and Distributed SON (D-SON) towards more sophisticated Hybrid SON (H-SON) architectures. Regulatory frameworks, particularly those pertaining to network efficiency, security, and spectrum management, play a crucial role in shaping deployment strategies. The proliferation of 5G networks and the demand for enhanced mobile broadband (eMBB), ultra-reliable low-latency communications (URLLC), and massive machine-type communications (mMTC) are primary drivers of SON adoption. Competitive product substitutes, primarily manual network management solutions, are rapidly being displaced by the inherent advantages of SON, including reduced operational expenditure (OPEX) and improved network performance. End-user demographics are shifting towards enterprises and industries demanding robust and reliable private networks, fueling growth in sectors like manufacturing, logistics, and healthcare. Mergers and acquisitions (M&A) activity, while not overtly high, indicates strategic consolidation and partnerships aimed at bolstering technological capabilities and market reach. For instance, strategic alliances between network equipment providers and cloud service providers are becoming more prevalent to address the growing demand for telco cloud integration with SON solutions. The barriers to innovation are primarily associated with the complexity of integrating SON solutions with legacy infrastructure and the need for skilled personnel to manage advanced AI/ML-driven SON capabilities.
Self-Organizing Network Market Growth Trends & Insights
The Self-Organizing Network (SON) market is poised for substantial growth, driven by the imperative for enhanced network efficiency, reduced operational costs, and the accelerated deployment of 5G services. The market is expected to witness a remarkable Compound Annual Growth Rate (CAGR) of approximately 20-25% during the forecast period (2025–2033). This robust expansion is fueled by the increasing complexity of mobile networks, especially with the advent of 5G, which necessitates automated management and optimization to ensure seamless connectivity and superior user experience. The adoption rates of SON solutions are escalating across various industry verticals, including telecommunications, manufacturing, transportation, and public safety, as organizations recognize the tangible benefits of intelligent network self-optimization. Technological disruptions, such as the integration of Artificial Intelligence (AI) and Machine Learning (ML) into SON platforms, are revolutionizing network performance and predictive maintenance capabilities. These advancements enable SON systems to learn from network behavior, anticipate potential issues, and proactively resolve them, thereby minimizing downtime and maximizing resource utilization. Furthermore, the growing demand for improved Quality of Service (QoS) and Quality of Experience (QoE) among end-users is a significant catalyst for SON market penetration. As consumers and businesses rely more heavily on mobile connectivity for critical applications and services, the need for highly resilient and efficient networks becomes paramount. Consumer behavior shifts towards increased data consumption and the adoption of bandwidth-intensive applications like augmented reality (AR) and virtual reality (VR) further amplify the need for sophisticated network management tools that SON provides. The evolution of network architectures, from traditional macro networks to heterogeneous networks (HetNets) incorporating small cells and IoT devices, also presents a compelling case for SON’s automated deployment and optimization capabilities. The market size is projected to reach USD 15,000 million by 2033, up from an estimated USD 4,000 million in 2025. The increasing deployment of private 5G networks for industrial automation and enterprise use cases is also a key growth driver, with SON playing a pivotal role in ensuring the reliability and performance of these dedicated networks.
Dominant Regions, Countries, or Segments in Self-Organizing Network Market
The Asia Pacific region currently dominates the Self-Organizing Network (SON) market, driven by aggressive 5G rollout strategies, substantial investments in telecommunications infrastructure, and a large, tech-savvy population. Countries like China and South Korea are at the forefront, leading in 5G deployment and the adoption of advanced network automation solutions. The region's dominance is further bolstered by supportive government policies promoting digital transformation and smart city initiatives.
Within the Offering segment, Software solutions are emerging as the primary growth engine, accounting for a significant market share. This is attributed to the increasing demand for intelligent algorithms, AI/ML capabilities, and cloud-native SON platforms that can be deployed flexibly and scaled dynamically. Services, including integration, maintenance, and consulting, also hold substantial value, ensuring seamless implementation and optimal performance of SON solutions.
In terms of Architecture, Hybrid SON (H-SON) is rapidly gaining traction. While C-SON and D-SON have laid the groundwork, H-SON offers a more comprehensive approach by combining the benefits of both centralized and distributed intelligence, enabling granular control and efficient optimization across complex network environments. The integration of AI/ML in H-SON architectures is a key differentiator, allowing for predictive analysis and proactive network adjustments.
Regarding Network Technology, 5G is the most significant growth driver for the SON market. The inherent complexity of 5G networks, with their diverse service requirements and new radio technologies, necessitates advanced SON capabilities for efficient management and optimization. While 4G/LTE networks continue to benefit from SON for performance enhancement and OPEX reduction, the transformative potential of 5G is propelling the demand for next-generation SON solutions. The market share for 5G-related SON solutions is expected to outpace that of 2G/3G and 4G/LTE significantly in the coming years. Key drivers for dominance in the Asia Pacific include substantial government investments in 5G infrastructure, the presence of leading telecommunications operators actively deploying advanced technologies, and a robust ecosystem of technology providers. For example, China's commitment to building the world's largest 5G network has directly translated into a massive demand for SON solutions. The region's manufacturing sector's increasing adoption of Industry 4.0 principles, which rely heavily on reliable and efficient wireless connectivity, further amplifies the demand for SON. The market share in Asia Pacific is estimated to be around 35-40% of the global SON market, with a projected growth rate exceeding the global average.
Self-Organizing Network Market Product Landscape
The SON market is characterized by a vibrant landscape of product innovations focused on enhancing network automation, performance, and efficiency. Leading companies are continually developing advanced software solutions that integrate Artificial Intelligence (AI) and Machine Learning (ML) to enable self-optimization, self-healing, and self-configuration of complex networks. These innovations include intelligent traffic management algorithms that dynamically allocate resources to meet fluctuating demands, predictive analytics for proactive fault detection and resolution, and advanced analytics dashboards for comprehensive network visibility. Specific product advancements are seen in areas like interference management, coverage optimization, and energy efficiency, particularly for 5G networks. The emphasis is on creating modular and scalable SON platforms that can be deployed across different network architectures, including C-SON, D-SON, and H-SON. Unique selling propositions revolve around reducing OPEX by automating routine tasks, improving network reliability and uptime, and accelerating the deployment of new services. Technological advancements are also focusing on the integration of SON with cloud-native architectures and virtual network functions (VNFs) to enhance flexibility and agility.
Key Drivers, Barriers & Challenges in Self-Organizing Network Market
Key Drivers:
The Self-Organizing Network (SON) market is propelled by several key drivers. The escalating complexity of mobile networks, particularly with the widespread adoption of 5G, necessitates automated management to ensure optimal performance and user experience. The urgent need for operational cost reduction among telecommunication operators is a significant catalyst, as SON automates tasks that would otherwise require extensive manual intervention. Furthermore, the increasing demand for enhanced mobile broadband, ultra-reliable low-latency communications, and massive IoT deployments is driving the requirement for more sophisticated and self-optimizing network infrastructure. Government initiatives and spectrum refarming also play a crucial role, encouraging the efficient utilization of network resources.
Barriers & Challenges:
Despite the strong growth potential, the SON market faces several barriers and challenges. Integrating SON solutions with existing legacy network infrastructure can be complex and costly, posing a significant hurdle for some operators. The interoperability between different vendor solutions also remains a concern, potentially leading to vendor lock-in. Furthermore, the development and deployment of advanced AI/ML algorithms require specialized skills and expertise, leading to a talent gap in the industry. Security concerns related to automated network management and data privacy also need to be addressed effectively. Competitive pressures from alternative network management solutions and the high initial investment required for comprehensive SON deployments can also act as restraints. Supply chain disruptions for critical hardware components, though less prevalent now, can still impact deployment timelines.
Emerging Opportunities in Self-Organizing Network Market
Emerging opportunities in the Self-Organizing Network (SON) market are abundant, particularly in the realm of private 5G networks for enterprises. Industries such as manufacturing, logistics, and healthcare are increasingly looking to deploy dedicated 5G networks for enhanced operational efficiency, automation, and real-time data processing. SON solutions are crucial for the seamless deployment, management, and optimization of these private networks. Another significant opportunity lies in the evolution towards AI-driven SON. The integration of advanced AI and ML algorithms promises to unlock new levels of network intelligence, enabling predictive maintenance, proactive issue resolution, and dynamic resource allocation for highly complex and dynamic network environments. The growing demand for edge computing and the proliferation of IoT devices also present lucrative opportunities, as SON can play a vital role in optimizing connectivity and resource management at the network edge. Furthermore, the development of SON solutions specifically tailored for network slicing in 5G environments offers immense potential for enabling customized and guaranteed service levels for various applications.
Growth Accelerators in the Self-Organizing Network Market Industry
Several key catalysts are accelerating the growth of the Self-Organizing Network (SON) market. The rapid global rollout of 5G networks is a primary growth accelerator, as the inherent complexity and diverse service requirements of 5G demand sophisticated automation capabilities that SON provides. Strategic partnerships and collaborations between telecommunication operators, network equipment vendors, and cloud providers are fostering innovation and accelerating the integration of SON into broader digital ecosystems, including telco cloud infrastructures. The increasing adoption of AI and Machine Learning in SON platforms is a significant growth accelerator, enabling more intelligent and predictive network management, leading to improved efficiency and reduced operational costs. Furthermore, the expanding application of SON in enterprise private networks and the growing demand for robust IoT connectivity are opening up new market segments and driving substantial growth. Market expansion strategies by key players, including acquisitions and the development of new market-ready solutions, are also contributing to the industry's accelerated growth trajectory.
Key Players Shaping the Self-Organizing Network Market Market
- Aarna Networks
- Commscope
- ASOCS
- Verizon Communications Inc
- Juniper Networks
- Gemtek Technology
- Cisco Systems
- D-Link Corporation
- Cohere Technologies
- Airhop Communications
- Huawei Technologies
- Ericsson
Notable Milestones in Self-Organizing Network Market Sector
- November 2022 - Cisco AppDynamics launched new AppDynamics Cloud capabilities that allow organizations to achieve observability over cloud-native applications correlated to business context across the entire IT estate.
- October 2022 - Ericsson launched a commercial Ericsson Private 5G rollout in Sweden with X Shore. Using Ericsson Private 5G, X Shore will gain more efficient and flexible production operations while supporting its environmental mission.
- October 2022 - CommScope signed an agreement with Mediacom Communications to power its network migration to a Distributed Access Architecture (DAA).
In-Depth Self-Organizing Network Market Market Outlook
The future outlook for the Self-Organizing Network (SON) market is exceptionally bright, driven by sustained technological advancements and the ever-increasing demand for robust, efficient, and automated network infrastructures. 5G network expansion and the burgeoning adoption of private 5G networks will continue to be the primary growth engines, creating a significant need for intelligent network management. The increasing integration of AI and Machine Learning into SON solutions will unlock unprecedented levels of network intelligence, enabling predictive maintenance, self-healing capabilities, and highly optimized resource allocation, thereby drastically reducing operational expenditures for telecommunication providers. Strategic partnerships and mergers among key industry players are anticipated to further consolidate the market and accelerate innovation. The growing emphasis on network slicing and edge computing in 5G architectures will also create new avenues for SON deployment, ensuring tailored and efficient connectivity for diverse applications. Overall, the SON market is poised for continued expansion, offering significant opportunities for innovation and market penetration as it underpins the evolution of global connectivity.
Self-Organizing Network Market Segmentation
-
1. Offering
- 1.1. Software
- 1.2. Services
-
2. Architecture
- 2.1. C-SON
- 2.2. D-SON
- 2.3. H-SON
-
3. Network Technology
- 3.1. 2G/3G
- 3.2. 4G/LTE
- 3.3. 5G
Self-Organizing Network Market Segmentation By Geography
-
1. North America
- 1.1. United States
- 1.2. Canada
- 1.3. Mexico
-
2. South America
- 2.1. Brazil
- 2.2. Argentina
- 2.3. Rest of South America
-
3. Europe
- 3.1. United Kingdom
- 3.2. Germany
- 3.3. France
- 3.4. Italy
- 3.5. Spain
- 3.6. Russia
- 3.7. Benelux
- 3.8. Nordics
- 3.9. Rest of Europe
-
4. Middle East & Africa
- 4.1. Turkey
- 4.2. Israel
- 4.3. GCC
- 4.4. North Africa
- 4.5. South Africa
- 4.6. Rest of Middle East & Africa
-
5. Asia Pacific
- 5.1. China
- 5.2. India
- 5.3. Japan
- 5.4. South Korea
- 5.5. ASEAN
- 5.6. Oceania
- 5.7. Rest of Asia Pacific
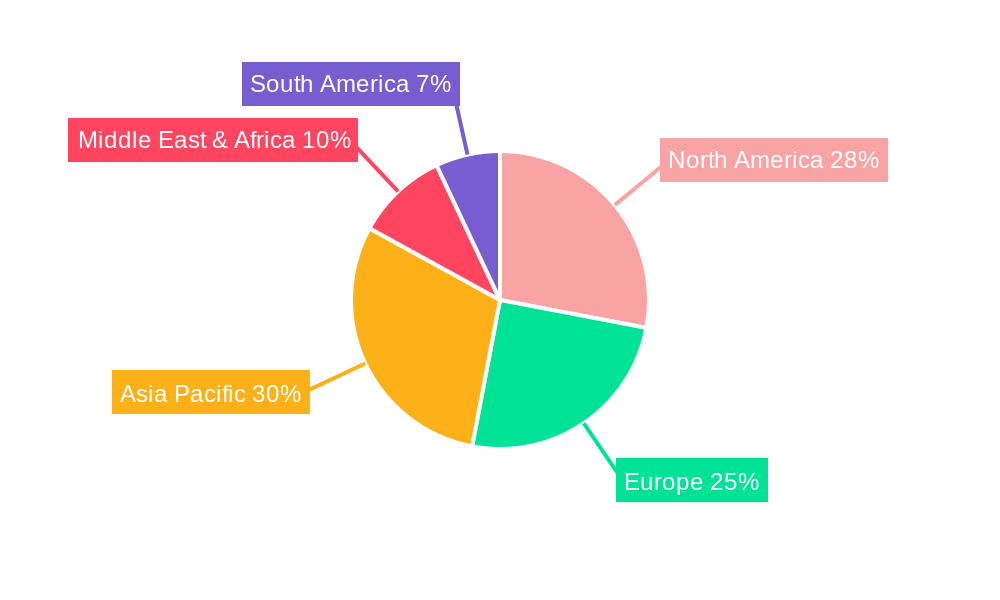
Self-Organizing Network Market Regional Market Share
Geographic Coverage of Self-Organizing Network Market
Self-Organizing Network Market REPORT HIGHLIGHTS
| Aspects | Details |
|---|---|
| Study Period | 2020-2034 |
| Base Year | 2025 |
| Estimated Year | 2026 |
| Forecast Period | 2026-2034 |
| Historical Period | 2020-2025 |
| Growth Rate | CAGR of 11.2% from 2020-2034 |
| Segmentation |
|
Table of Contents
- 1. Introduction
- 1.1. Research Scope
- 1.2. Market Segmentation
- 1.3. Research Objective
- 1.4. Definitions and Assumptions
- 2. Executive Summary
- 2.1. Market Snapshot
- 3. Market Dynamics
- 3.1. Market Drivers
- 3.2. Market Restrains
- 3.3. Market Trends
- 3.4. Market Opportunities
- 4. Market Factor Analysis
- 4.1. Porters Five Forces
- 4.1.1. Bargaining Power of Suppliers
- 4.1.2. Bargaining Power of Buyers
- 4.1.3. Threat of New Entrants
- 4.1.4. Threat of Substitutes
- 4.1.5. Competitive Rivalry
- 4.2. PESTEL analysis
- 4.3. BCG Analysis
- 4.3.1. Stars (High Growth, High Market Share)
- 4.3.2. Cash Cows (Low Growth, High Market Share)
- 4.3.3. Question Mark (High Growth, Low Market Share)
- 4.3.4. Dogs (Low Growth, Low Market Share)
- 4.4. Ansoff Matrix Analysis
- 4.5. Supply Chain Analysis
- 4.6. Regulatory Landscape
- 4.7. Current Market Potential and Opportunity Assessment (TAM–SAM–SOM Framework)
- 4.8. VDR Analyst Note
- 4.1. Porters Five Forces
- 5. Market Analysis, Insights and Forecast 2021-2033
- 5.1. Market Analysis, Insights and Forecast - by Offering
- 5.1.1. Software
- 5.1.2. Services
- 5.2. Market Analysis, Insights and Forecast - by Architecture
- 5.2.1. C-SON
- 5.2.2. D-SON
- 5.2.3. H-SON
- 5.3. Market Analysis, Insights and Forecast - by Network Technology
- 5.3.1. 2G/3G
- 5.3.2. 4G/LTE
- 5.3.3. 5G
- 5.4. Market Analysis, Insights and Forecast - by Region
- 5.4.1. North America
- 5.4.2. South America
- 5.4.3. Europe
- 5.4.4. Middle East & Africa
- 5.4.5. Asia Pacific
- 5.1. Market Analysis, Insights and Forecast - by Offering
- 6. Global Self-Organizing Network Market Analysis, Insights and Forecast, 2021-2033
- 6.1. Market Analysis, Insights and Forecast - by Offering
- 6.1.1. Software
- 6.1.2. Services
- 6.2. Market Analysis, Insights and Forecast - by Architecture
- 6.2.1. C-SON
- 6.2.2. D-SON
- 6.2.3. H-SON
- 6.3. Market Analysis, Insights and Forecast - by Network Technology
- 6.3.1. 2G/3G
- 6.3.2. 4G/LTE
- 6.3.3. 5G
- 6.1. Market Analysis, Insights and Forecast - by Offering
- 7. North America Self-Organizing Network Market Analysis, Insights and Forecast, 2021-2033
- 7.1. Market Analysis, Insights and Forecast - by Offering
- 7.1.1. Software
- 7.1.2. Services
- 7.2. Market Analysis, Insights and Forecast - by Architecture
- 7.2.1. C-SON
- 7.2.2. D-SON
- 7.2.3. H-SON
- 7.3. Market Analysis, Insights and Forecast - by Network Technology
- 7.3.1. 2G/3G
- 7.3.2. 4G/LTE
- 7.3.3. 5G
- 7.1. Market Analysis, Insights and Forecast - by Offering
- 8. South America Self-Organizing Network Market Analysis, Insights and Forecast, 2021-2033
- 8.1. Market Analysis, Insights and Forecast - by Offering
- 8.1.1. Software
- 8.1.2. Services
- 8.2. Market Analysis, Insights and Forecast - by Architecture
- 8.2.1. C-SON
- 8.2.2. D-SON
- 8.2.3. H-SON
- 8.3. Market Analysis, Insights and Forecast - by Network Technology
- 8.3.1. 2G/3G
- 8.3.2. 4G/LTE
- 8.3.3. 5G
- 8.1. Market Analysis, Insights and Forecast - by Offering
- 9. Europe Self-Organizing Network Market Analysis, Insights and Forecast, 2021-2033
- 9.1. Market Analysis, Insights and Forecast - by Offering
- 9.1.1. Software
- 9.1.2. Services
- 9.2. Market Analysis, Insights and Forecast - by Architecture
- 9.2.1. C-SON
- 9.2.2. D-SON
- 9.2.3. H-SON
- 9.3. Market Analysis, Insights and Forecast - by Network Technology
- 9.3.1. 2G/3G
- 9.3.2. 4G/LTE
- 9.3.3. 5G
- 9.1. Market Analysis, Insights and Forecast - by Offering
- 10. Middle East & Africa Self-Organizing Network Market Analysis, Insights and Forecast, 2021-2033
- 10.1. Market Analysis, Insights and Forecast - by Offering
- 10.1.1. Software
- 10.1.2. Services
- 10.2. Market Analysis, Insights and Forecast - by Architecture
- 10.2.1. C-SON
- 10.2.2. D-SON
- 10.2.3. H-SON
- 10.3. Market Analysis, Insights and Forecast - by Network Technology
- 10.3.1. 2G/3G
- 10.3.2. 4G/LTE
- 10.3.3. 5G
- 10.1. Market Analysis, Insights and Forecast - by Offering
- 11. Asia Pacific Self-Organizing Network Market Analysis, Insights and Forecast, 2021-2033
- 11.1. Market Analysis, Insights and Forecast - by Offering
- 11.1.1. Software
- 11.1.2. Services
- 11.2. Market Analysis, Insights and Forecast - by Architecture
- 11.2.1. C-SON
- 11.2.2. D-SON
- 11.2.3. H-SON
- 11.3. Market Analysis, Insights and Forecast - by Network Technology
- 11.3.1. 2G/3G
- 11.3.2. 4G/LTE
- 11.3.3. 5G
- 11.1. Market Analysis, Insights and Forecast - by Offering
- 12. Competitive Analysis
- 12.1. Company Profiles
- 12.1.1 Aarna Networks
- 12.1.1.1. Company Overview
- 12.1.1.2. Products
- 12.1.1.3. Company Financials
- 12.1.1.4. SWOT Analysis
- 12.1.2 Commscope
- 12.1.2.1. Company Overview
- 12.1.2.2. Products
- 12.1.2.3. Company Financials
- 12.1.2.4. SWOT Analysis
- 12.1.3 ASOCS
- 12.1.3.1. Company Overview
- 12.1.3.2. Products
- 12.1.3.3. Company Financials
- 12.1.3.4. SWOT Analysis
- 12.1.4 Verizon Communications Inc
- 12.1.4.1. Company Overview
- 12.1.4.2. Products
- 12.1.4.3. Company Financials
- 12.1.4.4. SWOT Analysis
- 12.1.5 Juniper Networks
- 12.1.5.1. Company Overview
- 12.1.5.2. Products
- 12.1.5.3. Company Financials
- 12.1.5.4. SWOT Analysis
- 12.1.6 Gemtek Technology
- 12.1.6.1. Company Overview
- 12.1.6.2. Products
- 12.1.6.3. Company Financials
- 12.1.6.4. SWOT Analysis
- 12.1.7 Cisco Systems
- 12.1.7.1. Company Overview
- 12.1.7.2. Products
- 12.1.7.3. Company Financials
- 12.1.7.4. SWOT Analysis
- 12.1.8 D-Link Corporation
- 12.1.8.1. Company Overview
- 12.1.8.2. Products
- 12.1.8.3. Company Financials
- 12.1.8.4. SWOT Analysis
- 12.1.9 Cohere Technologies
- 12.1.9.1. Company Overview
- 12.1.9.2. Products
- 12.1.9.3. Company Financials
- 12.1.9.4. SWOT Analysis
- 12.1.10 Airhop Communications
- 12.1.10.1. Company Overview
- 12.1.10.2. Products
- 12.1.10.3. Company Financials
- 12.1.10.4. SWOT Analysis
- 12.1.11 Huawei Technologies
- 12.1.11.1. Company Overview
- 12.1.11.2. Products
- 12.1.11.3. Company Financials
- 12.1.11.4. SWOT Analysis
- 12.1.12 Ericsson
- 12.1.12.1. Company Overview
- 12.1.12.2. Products
- 12.1.12.3. Company Financials
- 12.1.12.4. SWOT Analysis
- 12.1.1 Aarna Networks
- 12.2. Market Entropy
- 12.2.1 Company's Key Areas Served
- 12.2.2 Recent Developments
- 12.3. Company Market Share Analysis 2025
- 12.3.1 Top 5 Companies Market Share Analysis
- 12.3.2 Top 3 Companies Market Share Analysis
- 12.4. List of Potential Customers
- 13. Research Methodology
List of Figures
- Figure 1: Global Self-Organizing Network Market Revenue Breakdown (billion, %) by Region 2025 & 2033
- Figure 2: North America Self-Organizing Network Market Revenue (billion), by Offering 2025 & 2033
- Figure 3: North America Self-Organizing Network Market Revenue Share (%), by Offering 2025 & 2033
- Figure 4: North America Self-Organizing Network Market Revenue (billion), by Architecture 2025 & 2033
- Figure 5: North America Self-Organizing Network Market Revenue Share (%), by Architecture 2025 & 2033
- Figure 6: North America Self-Organizing Network Market Revenue (billion), by Network Technology 2025 & 2033
- Figure 7: North America Self-Organizing Network Market Revenue Share (%), by Network Technology 2025 & 2033
- Figure 8: North America Self-Organizing Network Market Revenue (billion), by Country 2025 & 2033
- Figure 9: North America Self-Organizing Network Market Revenue Share (%), by Country 2025 & 2033
- Figure 10: South America Self-Organizing Network Market Revenue (billion), by Offering 2025 & 2033
- Figure 11: South America Self-Organizing Network Market Revenue Share (%), by Offering 2025 & 2033
- Figure 12: South America Self-Organizing Network Market Revenue (billion), by Architecture 2025 & 2033
- Figure 13: South America Self-Organizing Network Market Revenue Share (%), by Architecture 2025 & 2033
- Figure 14: South America Self-Organizing Network Market Revenue (billion), by Network Technology 2025 & 2033
- Figure 15: South America Self-Organizing Network Market Revenue Share (%), by Network Technology 2025 & 2033
- Figure 16: South America Self-Organizing Network Market Revenue (billion), by Country 2025 & 2033
- Figure 17: South America Self-Organizing Network Market Revenue Share (%), by Country 2025 & 2033
- Figure 18: Europe Self-Organizing Network Market Revenue (billion), by Offering 2025 & 2033
- Figure 19: Europe Self-Organizing Network Market Revenue Share (%), by Offering 2025 & 2033
- Figure 20: Europe Self-Organizing Network Market Revenue (billion), by Architecture 2025 & 2033
- Figure 21: Europe Self-Organizing Network Market Revenue Share (%), by Architecture 2025 & 2033
- Figure 22: Europe Self-Organizing Network Market Revenue (billion), by Network Technology 2025 & 2033
- Figure 23: Europe Self-Organizing Network Market Revenue Share (%), by Network Technology 2025 & 2033
- Figure 24: Europe Self-Organizing Network Market Revenue (billion), by Country 2025 & 2033
- Figure 25: Europe Self-Organizing Network Market Revenue Share (%), by Country 2025 & 2033
- Figure 26: Middle East & Africa Self-Organizing Network Market Revenue (billion), by Offering 2025 & 2033
- Figure 27: Middle East & Africa Self-Organizing Network Market Revenue Share (%), by Offering 2025 & 2033
- Figure 28: Middle East & Africa Self-Organizing Network Market Revenue (billion), by Architecture 2025 & 2033
- Figure 29: Middle East & Africa Self-Organizing Network Market Revenue Share (%), by Architecture 2025 & 2033
- Figure 30: Middle East & Africa Self-Organizing Network Market Revenue (billion), by Network Technology 2025 & 2033
- Figure 31: Middle East & Africa Self-Organizing Network Market Revenue Share (%), by Network Technology 2025 & 2033
- Figure 32: Middle East & Africa Self-Organizing Network Market Revenue (billion), by Country 2025 & 2033
- Figure 33: Middle East & Africa Self-Organizing Network Market Revenue Share (%), by Country 2025 & 2033
- Figure 34: Asia Pacific Self-Organizing Network Market Revenue (billion), by Offering 2025 & 2033
- Figure 35: Asia Pacific Self-Organizing Network Market Revenue Share (%), by Offering 2025 & 2033
- Figure 36: Asia Pacific Self-Organizing Network Market Revenue (billion), by Architecture 2025 & 2033
- Figure 37: Asia Pacific Self-Organizing Network Market Revenue Share (%), by Architecture 2025 & 2033
- Figure 38: Asia Pacific Self-Organizing Network Market Revenue (billion), by Network Technology 2025 & 2033
- Figure 39: Asia Pacific Self-Organizing Network Market Revenue Share (%), by Network Technology 2025 & 2033
- Figure 40: Asia Pacific Self-Organizing Network Market Revenue (billion), by Country 2025 & 2033
- Figure 41: Asia Pacific Self-Organizing Network Market Revenue Share (%), by Country 2025 & 2033
List of Tables
- Table 1: Global Self-Organizing Network Market Revenue billion Forecast, by Offering 2020 & 2033
- Table 2: Global Self-Organizing Network Market Revenue billion Forecast, by Architecture 2020 & 2033
- Table 3: Global Self-Organizing Network Market Revenue billion Forecast, by Network Technology 2020 & 2033
- Table 4: Global Self-Organizing Network Market Revenue billion Forecast, by Region 2020 & 2033
- Table 5: Global Self-Organizing Network Market Revenue billion Forecast, by Offering 2020 & 2033
- Table 6: Global Self-Organizing Network Market Revenue billion Forecast, by Architecture 2020 & 2033
- Table 7: Global Self-Organizing Network Market Revenue billion Forecast, by Network Technology 2020 & 2033
- Table 8: Global Self-Organizing Network Market Revenue billion Forecast, by Country 2020 & 2033
- Table 9: United States Self-Organizing Network Market Revenue (billion) Forecast, by Application 2020 & 2033
- Table 10: Canada Self-Organizing Network Market Revenue (billion) Forecast, by Application 2020 & 2033
- Table 11: Mexico Self-Organizing Network Market Revenue (billion) Forecast, by Application 2020 & 2033
- Table 12: Global Self-Organizing Network Market Revenue billion Forecast, by Offering 2020 & 2033
- Table 13: Global Self-Organizing Network Market Revenue billion Forecast, by Architecture 2020 & 2033
- Table 14: Global Self-Organizing Network Market Revenue billion Forecast, by Network Technology 2020 & 2033
- Table 15: Global Self-Organizing Network Market Revenue billion Forecast, by Country 2020 & 2033
- Table 16: Brazil Self-Organizing Network Market Revenue (billion) Forecast, by Application 2020 & 2033
- Table 17: Argentina Self-Organizing Network Market Revenue (billion) Forecast, by Application 2020 & 2033
- Table 18: Rest of South America Self-Organizing Network Market Revenue (billion) Forecast, by Application 2020 & 2033
- Table 19: Global Self-Organizing Network Market Revenue billion Forecast, by Offering 2020 & 2033
- Table 20: Global Self-Organizing Network Market Revenue billion Forecast, by Architecture 2020 & 2033
- Table 21: Global Self-Organizing Network Market Revenue billion Forecast, by Network Technology 2020 & 2033
- Table 22: Global Self-Organizing Network Market Revenue billion Forecast, by Country 2020 & 2033
- Table 23: United Kingdom Self-Organizing Network Market Revenue (billion) Forecast, by Application 2020 & 2033
- Table 24: Germany Self-Organizing Network Market Revenue (billion) Forecast, by Application 2020 & 2033
- Table 25: France Self-Organizing Network Market Revenue (billion) Forecast, by Application 2020 & 2033
- Table 26: Italy Self-Organizing Network Market Revenue (billion) Forecast, by Application 2020 & 2033
- Table 27: Spain Self-Organizing Network Market Revenue (billion) Forecast, by Application 2020 & 2033
- Table 28: Russia Self-Organizing Network Market Revenue (billion) Forecast, by Application 2020 & 2033
- Table 29: Benelux Self-Organizing Network Market Revenue (billion) Forecast, by Application 2020 & 2033
- Table 30: Nordics Self-Organizing Network Market Revenue (billion) Forecast, by Application 2020 & 2033
- Table 31: Rest of Europe Self-Organizing Network Market Revenue (billion) Forecast, by Application 2020 & 2033
- Table 32: Global Self-Organizing Network Market Revenue billion Forecast, by Offering 2020 & 2033
- Table 33: Global Self-Organizing Network Market Revenue billion Forecast, by Architecture 2020 & 2033
- Table 34: Global Self-Organizing Network Market Revenue billion Forecast, by Network Technology 2020 & 2033
- Table 35: Global Self-Organizing Network Market Revenue billion Forecast, by Country 2020 & 2033
- Table 36: Turkey Self-Organizing Network Market Revenue (billion) Forecast, by Application 2020 & 2033
- Table 37: Israel Self-Organizing Network Market Revenue (billion) Forecast, by Application 2020 & 2033
- Table 38: GCC Self-Organizing Network Market Revenue (billion) Forecast, by Application 2020 & 2033
- Table 39: North Africa Self-Organizing Network Market Revenue (billion) Forecast, by Application 2020 & 2033
- Table 40: South Africa Self-Organizing Network Market Revenue (billion) Forecast, by Application 2020 & 2033
- Table 41: Rest of Middle East & Africa Self-Organizing Network Market Revenue (billion) Forecast, by Application 2020 & 2033
- Table 42: Global Self-Organizing Network Market Revenue billion Forecast, by Offering 2020 & 2033
- Table 43: Global Self-Organizing Network Market Revenue billion Forecast, by Architecture 2020 & 2033
- Table 44: Global Self-Organizing Network Market Revenue billion Forecast, by Network Technology 2020 & 2033
- Table 45: Global Self-Organizing Network Market Revenue billion Forecast, by Country 2020 & 2033
- Table 46: China Self-Organizing Network Market Revenue (billion) Forecast, by Application 2020 & 2033
- Table 47: India Self-Organizing Network Market Revenue (billion) Forecast, by Application 2020 & 2033
- Table 48: Japan Self-Organizing Network Market Revenue (billion) Forecast, by Application 2020 & 2033
- Table 49: South Korea Self-Organizing Network Market Revenue (billion) Forecast, by Application 2020 & 2033
- Table 50: ASEAN Self-Organizing Network Market Revenue (billion) Forecast, by Application 2020 & 2033
- Table 51: Oceania Self-Organizing Network Market Revenue (billion) Forecast, by Application 2020 & 2033
- Table 52: Rest of Asia Pacific Self-Organizing Network Market Revenue (billion) Forecast, by Application 2020 & 2033
Frequently Asked Questions
1. What is the projected Compound Annual Growth Rate (CAGR) of the Self-Organizing Network Market?
The projected CAGR is approximately 11.2%.
2. Which companies are prominent players in the Self-Organizing Network Market?
Key companies in the market include Aarna Networks, Commscope, ASOCS, Verizon Communications Inc, Juniper Networks, Gemtek Technology, Cisco Systems, D-Link Corporation, Cohere Technologies, Airhop Communications, Huawei Technologies, Ericsson.
3. What are the main segments of the Self-Organizing Network Market?
The market segments include Offering , Architecture, Network Technology.
4. Can you provide details about the market size?
The market size is estimated to be USD 6.55 billion as of 2022.
5. What are some drivers contributing to market growth?
High demad for Wireless connectivity; Increasing demand for 4G and 5G Networks.
6. What are the notable trends driving market growth?
Increasing demand for 5G Networks.
7. Are there any restraints impacting market growth?
High Implementation Cost.
8. Can you provide examples of recent developments in the market?
November 2022 - Cisco AppDynamics launched new AppDynamics Cloud capabilities that allow organizations to achieve observability over cloud-native applications correlated to business context across the entire IT estate.
9. What pricing options are available for accessing the report?
Pricing options include single-user, multi-user, and enterprise licenses priced at USD 4750, USD 5250, and USD 8750 respectively.
10. Is the market size provided in terms of value or volume?
The market size is provided in terms of value, measured in billion.
11. Are there any specific market keywords associated with the report?
Yes, the market keyword associated with the report is "Self-Organizing Network Market," which aids in identifying and referencing the specific market segment covered.
12. How do I determine which pricing option suits my needs best?
The pricing options vary based on user requirements and access needs. Individual users may opt for single-user licenses, while businesses requiring broader access may choose multi-user or enterprise licenses for cost-effective access to the report.
13. Are there any additional resources or data provided in the Self-Organizing Network Market report?
While the report offers comprehensive insights, it's advisable to review the specific contents or supplementary materials provided to ascertain if additional resources or data are available.
14. How can I stay updated on further developments or reports in the Self-Organizing Network Market?
To stay informed about further developments, trends, and reports in the Self-Organizing Network Market, consider subscribing to industry newsletters, following relevant companies and organizations, or regularly checking reputable industry news sources and publications.
Methodology
Step 1 - Identification of Relevant Samples Size from Population Database


Step 2 - Approaches for Defining Global Market Size (Value, Volume* & Price*)

Note*: In applicable scenarios
Step 3 - Data Sources
Primary Research
- Web Analytics
- Survey Reports
- Research Institute
- Latest Research Reports
- Opinion Leaders
Secondary Research
- Annual Reports
- White Paper
- Latest Press Release
- Industry Association
- Paid Database
- Investor Presentations

Step 4 - Data Triangulation
Involves using different sources of information in order to increase the validity of a study
These sources are likely to be stakeholders in a program - participants, other researchers, program staff, other community members, and so on.
Then we put all data in single framework & apply various statistical tools to find out the dynamic on the market.
During the analysis stage, feedback from the stakeholder groups would be compared to determine areas of agreement as well as areas of divergence