

Key Insights
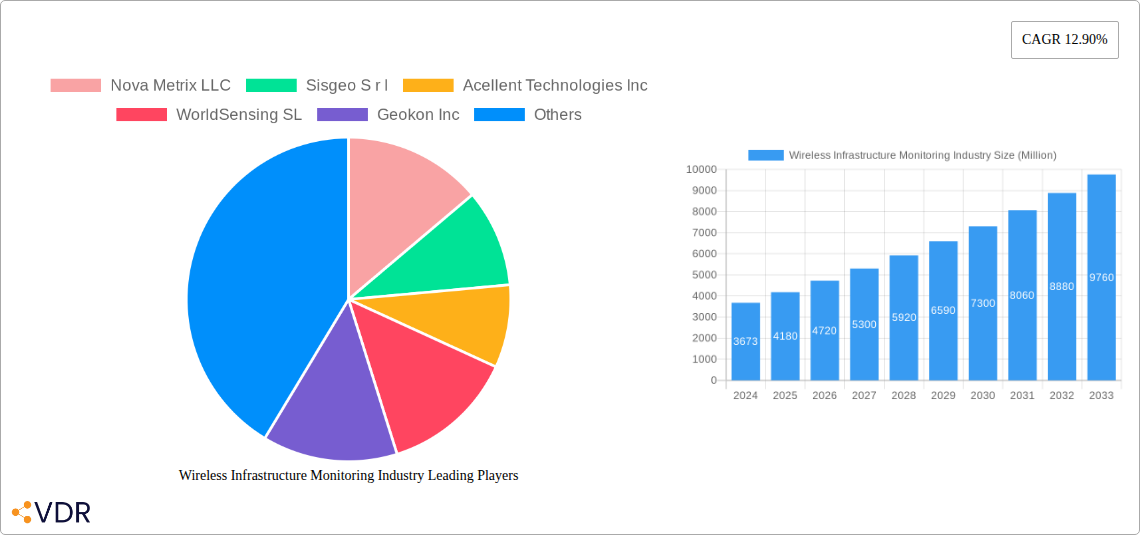
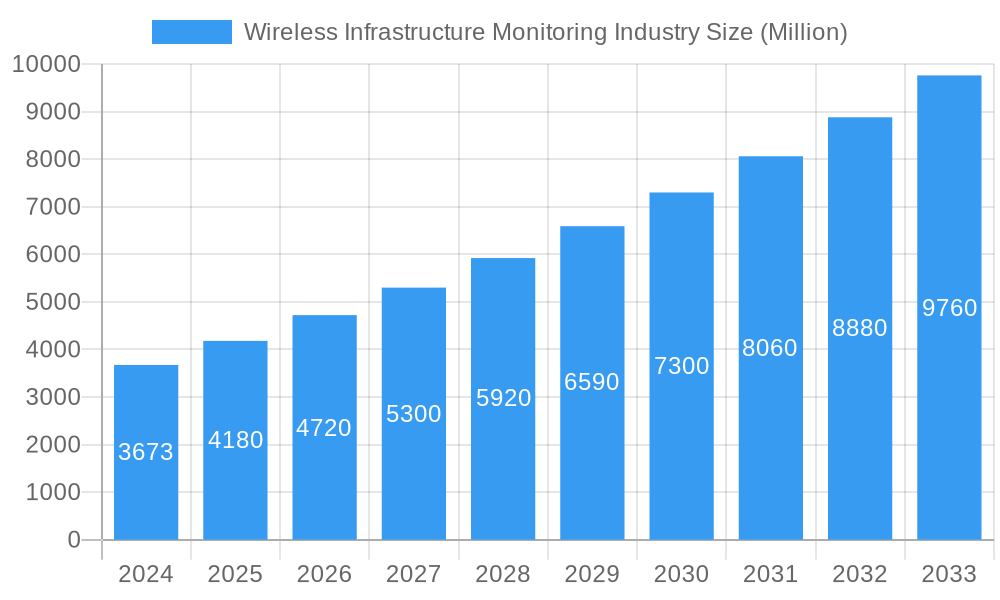
The Wireless Infrastructure Monitoring market is poised for substantial growth, projected to reach a market size of approximately $4.18 billion by 2025, with an impressive Compound Annual Growth Rate (CAGR) of 12.90% anticipated over the forecast period extending to 2033. This robust expansion is primarily fueled by an increasing global emphasis on the safety and longevity of critical infrastructure, including civil structures, transportation networks, and energy facilities. Key drivers for this surge include the rising adoption of IoT technologies, advancements in sensor technology enabling more accurate and real-time data collection, and the growing awareness of the economic and human costs associated with infrastructure failures. The demand for early detection of potential issues, predictive maintenance, and enhanced operational efficiency across various sectors is a significant impetus. The software and services segment, in particular, is expected to witness accelerated growth as organizations increasingly seek integrated solutions for data analysis, reporting, and remote management, moving beyond just hardware deployment.
Wireless Infrastructure Monitoring Industry Market Size (In Billion)
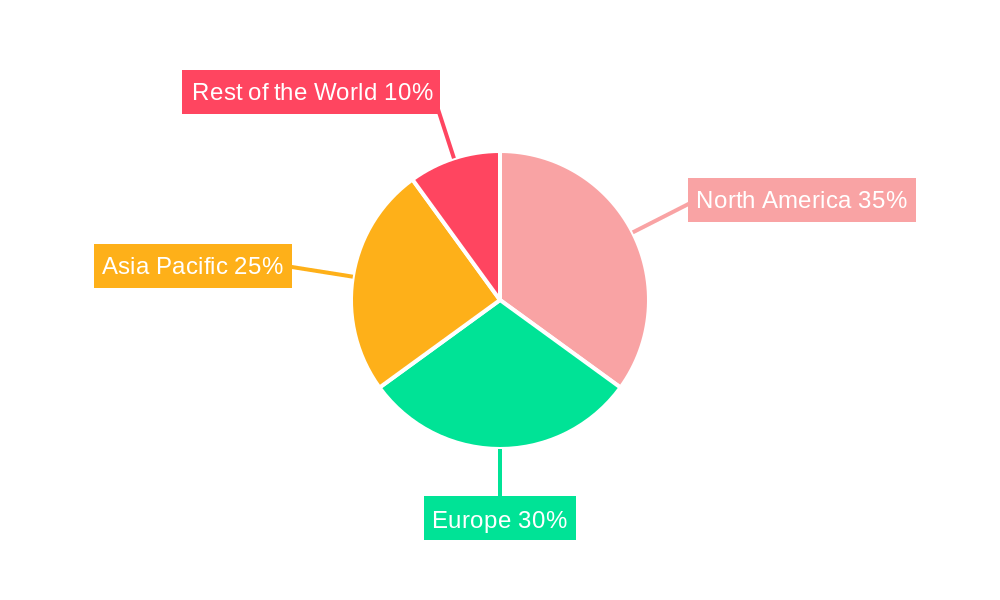
The market segmentation reveals diverse application areas, with Structural Monitoring and Geotechnical Monitoring emerging as dominant segments due to their critical role in ensuring the stability and integrity of buildings, bridges, tunnels, and dams. Environmental Monitoring is also gaining traction, driven by regulations and the need to track pollution and natural resource changes. While the Civil Infrastructure sector represents a substantial end-user industry, segments like Transportation, Oil & Refineries, and Mining are also demonstrating strong adoption rates, leveraging wireless monitoring for safety, efficiency, and regulatory compliance. Geographically, North America and Europe are anticipated to lead the market in terms of adoption and innovation, driven by established infrastructure and stringent safety standards. However, the Asia Pacific region is expected to exhibit the fastest growth, fueled by rapid infrastructure development and increasing investments in smart city initiatives. Restraints, such as initial implementation costs and data security concerns, are being progressively addressed through technological advancements and evolving regulatory frameworks, further solidifying the positive outlook for this dynamic market.
Wireless Infrastructure Monitoring Industry Company Market Share
This in-depth report offers a comprehensive analysis of the global Wireless Infrastructure Monitoring industry, providing critical insights into market dynamics, growth trends, key players, and future opportunities. Covering the historical period from 2019 to 2024 and projecting growth through 2033, with a base and estimated year of 2025, this report is an indispensable resource for industry stakeholders seeking to understand and capitalize on this rapidly evolving sector. We dissect the market by segment, application, and end-user industry, presenting all values in Million units for clarity and ease of comparison.
Wireless Infrastructure Monitoring Industry Market Dynamics & Structure
The global Wireless Infrastructure Monitoring industry is characterized by a moderately concentrated market, driven by continuous technological innovation and increasing adoption across critical infrastructure sectors. Key drivers include the growing demand for real-time data, enhanced safety protocols, and predictive maintenance capabilities to mitigate risks associated with aging infrastructure. Regulatory frameworks, particularly concerning structural integrity and environmental compliance, are also playing a significant role in market expansion. While established players hold substantial market share, the landscape is dynamic, with emerging technologies like IoT and AI-powered analytics fostering innovation. Competitive product substitutes exist, primarily in wired monitoring solutions, but wireless offers distinct advantages in deployment flexibility and scalability, particularly for remote or challenging environments. End-user demographics are expanding from traditional civil infrastructure to encompass transportation networks, oil and gas facilities, and mining operations, reflecting the ubiquitous need for reliable monitoring. Merger and acquisition (M&A) trends are evident as companies seek to consolidate offerings, expand technological capabilities, and gain market reach. The market exhibits an increasing trend towards integrated solutions that combine hardware, software, and services for a holistic monitoring approach.
- Market Concentration: Moderately concentrated with a few key players dominating specific segments.
- Technological Innovation Drivers: IoT, AI, cloud computing, advanced sensor technology, and miniaturization of hardware.
- Regulatory Frameworks: Stringent safety standards for critical infrastructure, environmental protection mandates, and data security regulations.
- Competitive Product Substitutes: Wired monitoring systems, manual inspections, and less sophisticated data acquisition methods.
- End-User Demographics: Growing adoption across civil infrastructure, transportation, oil and gas, mining, and renewable energy sectors.
- M&A Trends: Consolidation for enhanced service offerings, technology acquisition, and market penetration.
Wireless Infrastructure Monitoring Industry Growth Trends & Insights
The Wireless Infrastructure Monitoring market is poised for substantial growth, fueled by a confluence of factors that are reshaping how infrastructure is managed and maintained globally. From 2019 to 2033, the market is expected to witness a robust Compound Annual Growth Rate (CAGR) of XX%, driven by increasing investments in smart city initiatives and the imperative to ensure the longevity and safety of vital infrastructure assets. The adoption rates for wireless monitoring solutions are accelerating rapidly, particularly within civil engineering projects and the transportation sector, where real-time data on structural health can prevent catastrophic failures and minimize downtime. Technological disruptions, such as the proliferation of 5G networks, are enabling more robust and efficient data transmission for remote sensors, further enhancing the capabilities of wireless monitoring systems. Consumer behavior shifts are also contributing, with infrastructure operators and government agencies prioritizing data-driven decision-making and proactive maintenance over reactive repairs. Market penetration is deepening as the cost-effectiveness and ease of deployment of wireless solutions become more apparent compared to traditional methods. The integration of AI and machine learning algorithms into software platforms is transforming raw sensor data into actionable insights, enabling predictive analytics and anomaly detection. This evolution is not only improving operational efficiency but also significantly enhancing safety standards across a broad spectrum of industries. The demand for specialized solutions tailored to specific applications, such as geotechnical monitoring for bridges and dams, and structural monitoring for high-rise buildings, is also a key growth catalyst. Furthermore, the increasing focus on environmental monitoring, driven by climate change concerns and regulatory pressures, is opening up new avenues for wireless infrastructure monitoring technologies. The shift towards a more sustainable and resilient infrastructure requires continuous and reliable data, which wireless monitoring systems are ideally positioned to provide. The overall market trajectory indicates a sustained upward trend, supported by ongoing technological advancements and a growing awareness of the critical role of monitoring in modern infrastructure management.
Dominant Regions, Countries, or Segments in Wireless Infrastructure Monitoring Industry
North America currently stands as the dominant region in the Wireless Infrastructure Monitoring industry, primarily driven by substantial investments in upgrading aging civil infrastructure and transportation networks. The United States, in particular, exhibits high market penetration due to stringent safety regulations, advanced technological adoption, and a robust economy that supports significant infrastructure spending. Government initiatives promoting smart city development and the modernization of critical assets further bolster demand. The Civil Infrastructure end-user industry segment is a major growth driver within this region, encompassing bridges, dams, tunnels, and buildings, all requiring continuous monitoring for structural integrity.
Key Drivers in North America:
- Economic Policies: Favorable government policies and funding for infrastructure development and modernization.
- Infrastructure: Extensive network of aging infrastructure requiring proactive monitoring and maintenance.
- Technological Advigance: High adoption rate of cutting-edge technologies like IoT, cloud computing, and AI in monitoring solutions.
- Regulatory Frameworks: Strict safety and environmental regulations that mandate continuous monitoring.
Within the Type segment, Hardware remains a significant contributor, comprising the sensors, data loggers, and communication modules. However, the Services segment, encompassing installation, maintenance, data analysis, and consulting, is experiencing the most rapid growth, indicating a shift towards integrated solutions. For Applications, Structural Monitoring and Geotechnical Monitoring are leading segments, driven by the need to assess the stability and performance of critical structures and earthworks. The Transportation and Civil Infrastructure end-user industries are the primary beneficiaries of these applications. The forecast period is expected to see continued dominance of these segments, with increasing integration of Software solutions for advanced data analytics and predictive modeling, further solidifying North America's leadership. The market share within the region is substantial, with projections indicating continued expansion as more sophisticated wireless monitoring systems are deployed across the continent. The growth potential is further amplified by the ongoing construction of new infrastructure projects and the continuous need to ensure the safety and reliability of existing ones.
Wireless Infrastructure Monitoring Industry Product Landscape
The product landscape in the Wireless Infrastructure Monitoring industry is marked by continuous innovation, focusing on enhanced accuracy, reduced power consumption, and improved data transmission capabilities. Advanced sensor technologies are being developed for precise measurement of parameters like strain, vibration, tilt, temperature, and corrosion. Miniaturized and ruggedized hardware components ensure durability in harsh environmental conditions. Software platforms are evolving to offer sophisticated data visualization, real-time alerting, and AI-driven predictive analytics. Unique selling propositions often lie in the seamless integration of hardware, software, and cloud services, providing end-to-end monitoring solutions. Technological advancements are enabling the deployment of low-power, long-range communication protocols, expanding the reach of monitoring networks.
Key Drivers, Barriers & Challenges in Wireless Infrastructure Monitoring Industry
Key Drivers:
- Aging Infrastructure: The global necessity to monitor and maintain deteriorating infrastructure is a primary market driver.
- Safety and Risk Mitigation: Increasing awareness of the risks associated with infrastructure failure drives demand for real-time monitoring.
- Technological Advancements: Innovations in IoT, AI, and wireless communication enhance the efficiency and affordability of monitoring solutions.
- Regulatory Compliance: Strict government regulations for safety and environmental standards necessitate robust monitoring systems.
- Cost-Effectiveness: Wireless solutions often offer lower installation and maintenance costs compared to wired alternatives.
Barriers & Challenges:
- Initial Investment Costs: While overall cost-effective, the upfront investment for comprehensive wireless monitoring systems can be a barrier for some organizations.
- Data Security and Privacy: Ensuring the secure transmission and storage of sensitive infrastructure data is a significant concern.
- Interoperability Issues: Lack of standardized protocols can lead to challenges in integrating systems from different vendors.
- Skilled Workforce Shortage: A lack of trained personnel to install, maintain, and interpret data from advanced monitoring systems.
- Environmental Factors: Harsh environmental conditions can impact the performance and lifespan of wireless sensors.
- Supply Chain Disruptions: Global supply chain volatility can affect the availability and cost of hardware components.
Emerging Opportunities in Wireless Infrastructure Monitoring Industry
Emerging opportunities within the Wireless Infrastructure Monitoring industry are diverse and rapidly expanding. The growing emphasis on smart cities presents a significant avenue, with integrated wireless monitoring systems becoming integral to urban planning for traffic management, utilities, and public safety. The renewable energy sector, particularly for wind turbines and solar farms, offers untapped potential for remote performance and structural monitoring. Furthermore, the development of predictive maintenance-as-a-service (PMAAS) models, leveraging AI and cloud computing, creates opportunities for recurring revenue streams and a more proactive approach to infrastructure management. The increasing demand for environmental monitoring solutions, such as those for detecting water contamination or air quality, also represents a significant growth area.
Growth Accelerators in the Wireless Infrastructure Monitoring Industry Industry
Several factors are accelerating growth in the Wireless Infrastructure Monitoring industry. Technological breakthroughs in sensor miniaturization and power efficiency are making deployments more cost-effective and versatile. The widespread adoption of IoT platforms and cloud connectivity enables scalable data collection and analysis. Strategic partnerships between hardware manufacturers, software developers, and service providers are leading to the development of comprehensive, end-to-end solutions. Market expansion is being driven by increased governmental investment in infrastructure upgrades and resilience programs across developed and developing economies. The growing realization of the benefits of predictive maintenance over reactive repairs is also a significant accelerator.
Key Players Shaping the Wireless Infrastructure Monitoring Industry Market
- Nova Metrix LLC
- Sisgeo S r l
- Acellent Technologies Inc
- WorldSensing SL
- Geokon Inc
- COWI A/S
- RST Instruments Ltd (Vance Street Capital)
- Ackcio Pte Ltd
- Geocomp Corporation
- Campbell Scientific Inc
Notable Milestones in Wireless Infrastructure Monitoring Industry Sector
- 2019: Increased adoption of AI and machine learning in data analytics platforms, enabling predictive maintenance.
- 2020: Significant product launches focusing on low-power, long-range wireless communication technologies (e.g., LoRaWAN) for remote monitoring.
- 2021: Strategic acquisitions and partnerships aimed at integrating hardware, software, and cloud-based service offerings.
- 2022: Growing demand for solutions addressing critical infrastructure resilience in the face of extreme weather events.
- 2023: Advancements in sensor accuracy and durability for deployment in more challenging environmental conditions.
- 2024: Increased focus on cybersecurity measures for wireless monitoring networks to protect sensitive infrastructure data.
In-Depth Wireless Infrastructure Monitoring Industry Market Outlook
The future outlook for the Wireless Infrastructure Monitoring industry is exceptionally promising, driven by the persistent global need for robust, safe, and resilient infrastructure. Growth accelerators such as ongoing advancements in IoT technology, the expansion of 5G networks for enhanced data transmission, and the increasing integration of AI for predictive analytics will continue to propel market expansion. Strategic collaborations and an ongoing trend towards consolidation will foster the development of more comprehensive and integrated solutions. The increasing awareness of the benefits of proactive maintenance and the growing regulatory focus on safety and environmental compliance will further solidify the demand for wireless monitoring systems. Opportunities in emerging sectors like renewable energy and smart cities, alongside the continuous need to monitor and maintain aging civil infrastructure, assure sustained market growth and technological innovation for the foreseeable future.
Wireless Infrastructure Monitoring Industry Segmentation
-
1. Type
- 1.1. Hardware
- 1.2. Software and Services
-
2. Application
- 2.1. Geotechnical Monitoring
- 2.2. Structural Monitoring
- 2.3. Environmental Monitoring
- 2.4. Other Ap
-
3. End-user Industry
- 3.1. Civil Infrastructure
- 3.2. Oil and Refineries
- 3.3. Transportation
- 3.4. Mining
- 3.5. Others
Wireless Infrastructure Monitoring Industry Segmentation By Geography
- 1. North America
- 2. Europe
- 3. Asia Pacific
- 4. Rest of the World
Wireless Infrastructure Monitoring Industry Regional Market Share
Geographic Coverage of Wireless Infrastructure Monitoring Industry
Wireless Infrastructure Monitoring Industry REPORT HIGHLIGHTS
| Aspects | Details |
|---|---|
| Study Period | 2020-2034 |
| Base Year | 2025 |
| Estimated Year | 2026 |
| Forecast Period | 2026-2034 |
| Historical Period | 2020-2025 |
| Growth Rate | CAGR of 12.90% from 2020-2034 |
| Segmentation |
|
Table of Contents
- 1. Introduction
- 1.1. Research Scope
- 1.2. Market Segmentation
- 1.3. Research Objective
- 1.4. Definitions and Assumptions
- 2. Executive Summary
- 2.1. Market Snapshot
- 3. Market Dynamics
- 3.1. Market Drivers
- 3.2. Market Restrains
- 3.3. Market Trends
- 3.4. Market Opportunities
- 4. Market Factor Analysis
- 4.1. Porters Five Forces
- 4.1.1. Bargaining Power of Suppliers
- 4.1.2. Bargaining Power of Buyers
- 4.1.3. Threat of New Entrants
- 4.1.4. Threat of Substitutes
- 4.1.5. Competitive Rivalry
- 4.2. PESTEL analysis
- 4.3. BCG Analysis
- 4.3.1. Stars (High Growth, High Market Share)
- 4.3.2. Cash Cows (Low Growth, High Market Share)
- 4.3.3. Question Mark (High Growth, Low Market Share)
- 4.3.4. Dogs (Low Growth, Low Market Share)
- 4.4. Ansoff Matrix Analysis
- 4.5. Supply Chain Analysis
- 4.6. Regulatory Landscape
- 4.7. Current Market Potential and Opportunity Assessment (TAM–SAM–SOM Framework)
- 4.8. VDR Analyst Note
- 4.1. Porters Five Forces
- 5. Market Analysis, Insights and Forecast 2021-2033
- 5.1. Market Analysis, Insights and Forecast - by Type
- 5.1.1. Hardware
- 5.1.2. Software and Services
- 5.2. Market Analysis, Insights and Forecast - by Application
- 5.2.1. Geotechnical Monitoring
- 5.2.2. Structural Monitoring
- 5.2.3. Environmental Monitoring
- 5.2.4. Other Ap
- 5.3. Market Analysis, Insights and Forecast - by End-user Industry
- 5.3.1. Civil Infrastructure
- 5.3.2. Oil and Refineries
- 5.3.3. Transportation
- 5.3.4. Mining
- 5.3.5. Others
- 5.4. Market Analysis, Insights and Forecast - by Region
- 5.4.1. North America
- 5.4.2. Europe
- 5.4.3. Asia Pacific
- 5.4.4. Rest of the World
- 5.1. Market Analysis, Insights and Forecast - by Type
- 6. Global Wireless Infrastructure Monitoring Industry Analysis, Insights and Forecast, 2021-2033
- 6.1. Market Analysis, Insights and Forecast - by Type
- 6.1.1. Hardware
- 6.1.2. Software and Services
- 6.2. Market Analysis, Insights and Forecast - by Application
- 6.2.1. Geotechnical Monitoring
- 6.2.2. Structural Monitoring
- 6.2.3. Environmental Monitoring
- 6.2.4. Other Ap
- 6.3. Market Analysis, Insights and Forecast - by End-user Industry
- 6.3.1. Civil Infrastructure
- 6.3.2. Oil and Refineries
- 6.3.3. Transportation
- 6.3.4. Mining
- 6.3.5. Others
- 6.1. Market Analysis, Insights and Forecast - by Type
- 7. North America Wireless Infrastructure Monitoring Industry Analysis, Insights and Forecast, 2021-2033
- 7.1. Market Analysis, Insights and Forecast - by Type
- 7.1.1. Hardware
- 7.1.2. Software and Services
- 7.2. Market Analysis, Insights and Forecast - by Application
- 7.2.1. Geotechnical Monitoring
- 7.2.2. Structural Monitoring
- 7.2.3. Environmental Monitoring
- 7.2.4. Other Ap
- 7.3. Market Analysis, Insights and Forecast - by End-user Industry
- 7.3.1. Civil Infrastructure
- 7.3.2. Oil and Refineries
- 7.3.3. Transportation
- 7.3.4. Mining
- 7.3.5. Others
- 7.1. Market Analysis, Insights and Forecast - by Type
- 8. Europe Wireless Infrastructure Monitoring Industry Analysis, Insights and Forecast, 2021-2033
- 8.1. Market Analysis, Insights and Forecast - by Type
- 8.1.1. Hardware
- 8.1.2. Software and Services
- 8.2. Market Analysis, Insights and Forecast - by Application
- 8.2.1. Geotechnical Monitoring
- 8.2.2. Structural Monitoring
- 8.2.3. Environmental Monitoring
- 8.2.4. Other Ap
- 8.3. Market Analysis, Insights and Forecast - by End-user Industry
- 8.3.1. Civil Infrastructure
- 8.3.2. Oil and Refineries
- 8.3.3. Transportation
- 8.3.4. Mining
- 8.3.5. Others
- 8.1. Market Analysis, Insights and Forecast - by Type
- 9. Asia Pacific Wireless Infrastructure Monitoring Industry Analysis, Insights and Forecast, 2021-2033
- 9.1. Market Analysis, Insights and Forecast - by Type
- 9.1.1. Hardware
- 9.1.2. Software and Services
- 9.2. Market Analysis, Insights and Forecast - by Application
- 9.2.1. Geotechnical Monitoring
- 9.2.2. Structural Monitoring
- 9.2.3. Environmental Monitoring
- 9.2.4. Other Ap
- 9.3. Market Analysis, Insights and Forecast - by End-user Industry
- 9.3.1. Civil Infrastructure
- 9.3.2. Oil and Refineries
- 9.3.3. Transportation
- 9.3.4. Mining
- 9.3.5. Others
- 9.1. Market Analysis, Insights and Forecast - by Type
- 10. Rest of the World Wireless Infrastructure Monitoring Industry Analysis, Insights and Forecast, 2021-2033
- 10.1. Market Analysis, Insights and Forecast - by Type
- 10.1.1. Hardware
- 10.1.2. Software and Services
- 10.2. Market Analysis, Insights and Forecast - by Application
- 10.2.1. Geotechnical Monitoring
- 10.2.2. Structural Monitoring
- 10.2.3. Environmental Monitoring
- 10.2.4. Other Ap
- 10.3. Market Analysis, Insights and Forecast - by End-user Industry
- 10.3.1. Civil Infrastructure
- 10.3.2. Oil and Refineries
- 10.3.3. Transportation
- 10.3.4. Mining
- 10.3.5. Others
- 10.1. Market Analysis, Insights and Forecast - by Type
- 11. Competitive Analysis
- 11.1. Company Profiles
- 11.1.1 Nova Metrix LLC
- 11.1.1.1. Company Overview
- 11.1.1.2. Products
- 11.1.1.3. Company Financials
- 11.1.1.4. SWOT Analysis
- 11.1.2 Sisgeo S r l
- 11.1.2.1. Company Overview
- 11.1.2.2. Products
- 11.1.2.3. Company Financials
- 11.1.2.4. SWOT Analysis
- 11.1.3 Acellent Technologies Inc
- 11.1.3.1. Company Overview
- 11.1.3.2. Products
- 11.1.3.3. Company Financials
- 11.1.3.4. SWOT Analysis
- 11.1.4 WorldSensing SL
- 11.1.4.1. Company Overview
- 11.1.4.2. Products
- 11.1.4.3. Company Financials
- 11.1.4.4. SWOT Analysis
- 11.1.5 Geokon Inc
- 11.1.5.1. Company Overview
- 11.1.5.2. Products
- 11.1.5.3. Company Financials
- 11.1.5.4. SWOT Analysis
- 11.1.6 COWI A/S
- 11.1.6.1. Company Overview
- 11.1.6.2. Products
- 11.1.6.3. Company Financials
- 11.1.6.4. SWOT Analysis
- 11.1.7 RST Instruments Ltd (Vance Street Capital)
- 11.1.7.1. Company Overview
- 11.1.7.2. Products
- 11.1.7.3. Company Financials
- 11.1.7.4. SWOT Analysis
- 11.1.8 Ackcio Pte Ltd
- 11.1.8.1. Company Overview
- 11.1.8.2. Products
- 11.1.8.3. Company Financials
- 11.1.8.4. SWOT Analysis
- 11.1.9 Geocomp Corporation
- 11.1.9.1. Company Overview
- 11.1.9.2. Products
- 11.1.9.3. Company Financials
- 11.1.9.4. SWOT Analysis
- 11.1.10 Campbell Scientific Inc
- 11.1.10.1. Company Overview
- 11.1.10.2. Products
- 11.1.10.3. Company Financials
- 11.1.10.4. SWOT Analysis
- 11.1.1 Nova Metrix LLC
- 11.2. Market Entropy
- 11.2.1 Company's Key Areas Served
- 11.2.2 Recent Developments
- 11.3. Company Market Share Analysis 2025
- 11.3.1 Top 5 Companies Market Share Analysis
- 11.3.2 Top 3 Companies Market Share Analysis
- 11.4. List of Potential Customers
- 12. Research Methodology
List of Figures
- Figure 1: Global Wireless Infrastructure Monitoring Industry Revenue Breakdown (Million, %) by Region 2025 & 2033
- Figure 2: Global Wireless Infrastructure Monitoring Industry Volume Breakdown (K Unit, %) by Region 2025 & 2033
- Figure 3: North America Wireless Infrastructure Monitoring Industry Revenue (Million), by Type 2025 & 2033
- Figure 4: North America Wireless Infrastructure Monitoring Industry Volume (K Unit), by Type 2025 & 2033
- Figure 5: North America Wireless Infrastructure Monitoring Industry Revenue Share (%), by Type 2025 & 2033
- Figure 6: North America Wireless Infrastructure Monitoring Industry Volume Share (%), by Type 2025 & 2033
- Figure 7: North America Wireless Infrastructure Monitoring Industry Revenue (Million), by Application 2025 & 2033
- Figure 8: North America Wireless Infrastructure Monitoring Industry Volume (K Unit), by Application 2025 & 2033
- Figure 9: North America Wireless Infrastructure Monitoring Industry Revenue Share (%), by Application 2025 & 2033
- Figure 10: North America Wireless Infrastructure Monitoring Industry Volume Share (%), by Application 2025 & 2033
- Figure 11: North America Wireless Infrastructure Monitoring Industry Revenue (Million), by End-user Industry 2025 & 2033
- Figure 12: North America Wireless Infrastructure Monitoring Industry Volume (K Unit), by End-user Industry 2025 & 2033
- Figure 13: North America Wireless Infrastructure Monitoring Industry Revenue Share (%), by End-user Industry 2025 & 2033
- Figure 14: North America Wireless Infrastructure Monitoring Industry Volume Share (%), by End-user Industry 2025 & 2033
- Figure 15: North America Wireless Infrastructure Monitoring Industry Revenue (Million), by Country 2025 & 2033
- Figure 16: North America Wireless Infrastructure Monitoring Industry Volume (K Unit), by Country 2025 & 2033
- Figure 17: North America Wireless Infrastructure Monitoring Industry Revenue Share (%), by Country 2025 & 2033
- Figure 18: North America Wireless Infrastructure Monitoring Industry Volume Share (%), by Country 2025 & 2033
- Figure 19: Europe Wireless Infrastructure Monitoring Industry Revenue (Million), by Type 2025 & 2033
- Figure 20: Europe Wireless Infrastructure Monitoring Industry Volume (K Unit), by Type 2025 & 2033
- Figure 21: Europe Wireless Infrastructure Monitoring Industry Revenue Share (%), by Type 2025 & 2033
- Figure 22: Europe Wireless Infrastructure Monitoring Industry Volume Share (%), by Type 2025 & 2033
- Figure 23: Europe Wireless Infrastructure Monitoring Industry Revenue (Million), by Application 2025 & 2033
- Figure 24: Europe Wireless Infrastructure Monitoring Industry Volume (K Unit), by Application 2025 & 2033
- Figure 25: Europe Wireless Infrastructure Monitoring Industry Revenue Share (%), by Application 2025 & 2033
- Figure 26: Europe Wireless Infrastructure Monitoring Industry Volume Share (%), by Application 2025 & 2033
- Figure 27: Europe Wireless Infrastructure Monitoring Industry Revenue (Million), by End-user Industry 2025 & 2033
- Figure 28: Europe Wireless Infrastructure Monitoring Industry Volume (K Unit), by End-user Industry 2025 & 2033
- Figure 29: Europe Wireless Infrastructure Monitoring Industry Revenue Share (%), by End-user Industry 2025 & 2033
- Figure 30: Europe Wireless Infrastructure Monitoring Industry Volume Share (%), by End-user Industry 2025 & 2033
- Figure 31: Europe Wireless Infrastructure Monitoring Industry Revenue (Million), by Country 2025 & 2033
- Figure 32: Europe Wireless Infrastructure Monitoring Industry Volume (K Unit), by Country 2025 & 2033
- Figure 33: Europe Wireless Infrastructure Monitoring Industry Revenue Share (%), by Country 2025 & 2033
- Figure 34: Europe Wireless Infrastructure Monitoring Industry Volume Share (%), by Country 2025 & 2033
- Figure 35: Asia Pacific Wireless Infrastructure Monitoring Industry Revenue (Million), by Type 2025 & 2033
- Figure 36: Asia Pacific Wireless Infrastructure Monitoring Industry Volume (K Unit), by Type 2025 & 2033
- Figure 37: Asia Pacific Wireless Infrastructure Monitoring Industry Revenue Share (%), by Type 2025 & 2033
- Figure 38: Asia Pacific Wireless Infrastructure Monitoring Industry Volume Share (%), by Type 2025 & 2033
- Figure 39: Asia Pacific Wireless Infrastructure Monitoring Industry Revenue (Million), by Application 2025 & 2033
- Figure 40: Asia Pacific Wireless Infrastructure Monitoring Industry Volume (K Unit), by Application 2025 & 2033
- Figure 41: Asia Pacific Wireless Infrastructure Monitoring Industry Revenue Share (%), by Application 2025 & 2033
- Figure 42: Asia Pacific Wireless Infrastructure Monitoring Industry Volume Share (%), by Application 2025 & 2033
- Figure 43: Asia Pacific Wireless Infrastructure Monitoring Industry Revenue (Million), by End-user Industry 2025 & 2033
- Figure 44: Asia Pacific Wireless Infrastructure Monitoring Industry Volume (K Unit), by End-user Industry 2025 & 2033
- Figure 45: Asia Pacific Wireless Infrastructure Monitoring Industry Revenue Share (%), by End-user Industry 2025 & 2033
- Figure 46: Asia Pacific Wireless Infrastructure Monitoring Industry Volume Share (%), by End-user Industry 2025 & 2033
- Figure 47: Asia Pacific Wireless Infrastructure Monitoring Industry Revenue (Million), by Country 2025 & 2033
- Figure 48: Asia Pacific Wireless Infrastructure Monitoring Industry Volume (K Unit), by Country 2025 & 2033
- Figure 49: Asia Pacific Wireless Infrastructure Monitoring Industry Revenue Share (%), by Country 2025 & 2033
- Figure 50: Asia Pacific Wireless Infrastructure Monitoring Industry Volume Share (%), by Country 2025 & 2033
- Figure 51: Rest of the World Wireless Infrastructure Monitoring Industry Revenue (Million), by Type 2025 & 2033
- Figure 52: Rest of the World Wireless Infrastructure Monitoring Industry Volume (K Unit), by Type 2025 & 2033
- Figure 53: Rest of the World Wireless Infrastructure Monitoring Industry Revenue Share (%), by Type 2025 & 2033
- Figure 54: Rest of the World Wireless Infrastructure Monitoring Industry Volume Share (%), by Type 2025 & 2033
- Figure 55: Rest of the World Wireless Infrastructure Monitoring Industry Revenue (Million), by Application 2025 & 2033
- Figure 56: Rest of the World Wireless Infrastructure Monitoring Industry Volume (K Unit), by Application 2025 & 2033
- Figure 57: Rest of the World Wireless Infrastructure Monitoring Industry Revenue Share (%), by Application 2025 & 2033
- Figure 58: Rest of the World Wireless Infrastructure Monitoring Industry Volume Share (%), by Application 2025 & 2033
- Figure 59: Rest of the World Wireless Infrastructure Monitoring Industry Revenue (Million), by End-user Industry 2025 & 2033
- Figure 60: Rest of the World Wireless Infrastructure Monitoring Industry Volume (K Unit), by End-user Industry 2025 & 2033
- Figure 61: Rest of the World Wireless Infrastructure Monitoring Industry Revenue Share (%), by End-user Industry 2025 & 2033
- Figure 62: Rest of the World Wireless Infrastructure Monitoring Industry Volume Share (%), by End-user Industry 2025 & 2033
- Figure 63: Rest of the World Wireless Infrastructure Monitoring Industry Revenue (Million), by Country 2025 & 2033
- Figure 64: Rest of the World Wireless Infrastructure Monitoring Industry Volume (K Unit), by Country 2025 & 2033
- Figure 65: Rest of the World Wireless Infrastructure Monitoring Industry Revenue Share (%), by Country 2025 & 2033
- Figure 66: Rest of the World Wireless Infrastructure Monitoring Industry Volume Share (%), by Country 2025 & 2033
List of Tables
- Table 1: Global Wireless Infrastructure Monitoring Industry Revenue Million Forecast, by Type 2020 & 2033
- Table 2: Global Wireless Infrastructure Monitoring Industry Volume K Unit Forecast, by Type 2020 & 2033
- Table 3: Global Wireless Infrastructure Monitoring Industry Revenue Million Forecast, by Application 2020 & 2033
- Table 4: Global Wireless Infrastructure Monitoring Industry Volume K Unit Forecast, by Application 2020 & 2033
- Table 5: Global Wireless Infrastructure Monitoring Industry Revenue Million Forecast, by End-user Industry 2020 & 2033
- Table 6: Global Wireless Infrastructure Monitoring Industry Volume K Unit Forecast, by End-user Industry 2020 & 2033
- Table 7: Global Wireless Infrastructure Monitoring Industry Revenue Million Forecast, by Region 2020 & 2033
- Table 8: Global Wireless Infrastructure Monitoring Industry Volume K Unit Forecast, by Region 2020 & 2033
- Table 9: Global Wireless Infrastructure Monitoring Industry Revenue Million Forecast, by Type 2020 & 2033
- Table 10: Global Wireless Infrastructure Monitoring Industry Volume K Unit Forecast, by Type 2020 & 2033
- Table 11: Global Wireless Infrastructure Monitoring Industry Revenue Million Forecast, by Application 2020 & 2033
- Table 12: Global Wireless Infrastructure Monitoring Industry Volume K Unit Forecast, by Application 2020 & 2033
- Table 13: Global Wireless Infrastructure Monitoring Industry Revenue Million Forecast, by End-user Industry 2020 & 2033
- Table 14: Global Wireless Infrastructure Monitoring Industry Volume K Unit Forecast, by End-user Industry 2020 & 2033
- Table 15: Global Wireless Infrastructure Monitoring Industry Revenue Million Forecast, by Country 2020 & 2033
- Table 16: Global Wireless Infrastructure Monitoring Industry Volume K Unit Forecast, by Country 2020 & 2033
- Table 17: Global Wireless Infrastructure Monitoring Industry Revenue Million Forecast, by Type 2020 & 2033
- Table 18: Global Wireless Infrastructure Monitoring Industry Volume K Unit Forecast, by Type 2020 & 2033
- Table 19: Global Wireless Infrastructure Monitoring Industry Revenue Million Forecast, by Application 2020 & 2033
- Table 20: Global Wireless Infrastructure Monitoring Industry Volume K Unit Forecast, by Application 2020 & 2033
- Table 21: Global Wireless Infrastructure Monitoring Industry Revenue Million Forecast, by End-user Industry 2020 & 2033
- Table 22: Global Wireless Infrastructure Monitoring Industry Volume K Unit Forecast, by End-user Industry 2020 & 2033
- Table 23: Global Wireless Infrastructure Monitoring Industry Revenue Million Forecast, by Country 2020 & 2033
- Table 24: Global Wireless Infrastructure Monitoring Industry Volume K Unit Forecast, by Country 2020 & 2033
- Table 25: Global Wireless Infrastructure Monitoring Industry Revenue Million Forecast, by Type 2020 & 2033
- Table 26: Global Wireless Infrastructure Monitoring Industry Volume K Unit Forecast, by Type 2020 & 2033
- Table 27: Global Wireless Infrastructure Monitoring Industry Revenue Million Forecast, by Application 2020 & 2033
- Table 28: Global Wireless Infrastructure Monitoring Industry Volume K Unit Forecast, by Application 2020 & 2033
- Table 29: Global Wireless Infrastructure Monitoring Industry Revenue Million Forecast, by End-user Industry 2020 & 2033
- Table 30: Global Wireless Infrastructure Monitoring Industry Volume K Unit Forecast, by End-user Industry 2020 & 2033
- Table 31: Global Wireless Infrastructure Monitoring Industry Revenue Million Forecast, by Country 2020 & 2033
- Table 32: Global Wireless Infrastructure Monitoring Industry Volume K Unit Forecast, by Country 2020 & 2033
- Table 33: Global Wireless Infrastructure Monitoring Industry Revenue Million Forecast, by Type 2020 & 2033
- Table 34: Global Wireless Infrastructure Monitoring Industry Volume K Unit Forecast, by Type 2020 & 2033
- Table 35: Global Wireless Infrastructure Monitoring Industry Revenue Million Forecast, by Application 2020 & 2033
- Table 36: Global Wireless Infrastructure Monitoring Industry Volume K Unit Forecast, by Application 2020 & 2033
- Table 37: Global Wireless Infrastructure Monitoring Industry Revenue Million Forecast, by End-user Industry 2020 & 2033
- Table 38: Global Wireless Infrastructure Monitoring Industry Volume K Unit Forecast, by End-user Industry 2020 & 2033
- Table 39: Global Wireless Infrastructure Monitoring Industry Revenue Million Forecast, by Country 2020 & 2033
- Table 40: Global Wireless Infrastructure Monitoring Industry Volume K Unit Forecast, by Country 2020 & 2033
Frequently Asked Questions
1. What is the projected Compound Annual Growth Rate (CAGR) of the Wireless Infrastructure Monitoring Industry?
The projected CAGR is approximately 12.90%.
2. Which companies are prominent players in the Wireless Infrastructure Monitoring Industry?
Key companies in the market include Nova Metrix LLC, Sisgeo S r l, Acellent Technologies Inc, WorldSensing SL, Geokon Inc, COWI A/S, RST Instruments Ltd (Vance Street Capital), Ackcio Pte Ltd, Geocomp Corporation, Campbell Scientific Inc.
3. What are the main segments of the Wireless Infrastructure Monitoring Industry?
The market segments include Type, Application, End-user Industry.
4. Can you provide details about the market size?
The market size is estimated to be USD 4.18 Million as of 2022.
5. What are some drivers contributing to market growth?
; Stringent Government Regulations Pertaining to Sustainability of Structures; Cost-effective and Flexible Nature for Information Acquisition and Improving Maintenance Efficiency and Safety.
6. What are the notable trends driving market growth?
Structural Monitoring Segment is Expected To Grow Significantly.
7. Are there any restraints impacting market growth?
Lack of Good Infrastructure for the Efficient Functioning of Irrigation Automation Systems; High Costs Associated with the Installation and Lack of Technical Knowledge.
8. Can you provide examples of recent developments in the market?
N/A
9. What pricing options are available for accessing the report?
Pricing options include single-user, multi-user, and enterprise licenses priced at USD 4750, USD 5250, and USD 8750 respectively.
10. Is the market size provided in terms of value or volume?
The market size is provided in terms of value, measured in Million and volume, measured in K Unit.
11. Are there any specific market keywords associated with the report?
Yes, the market keyword associated with the report is "Wireless Infrastructure Monitoring Industry," which aids in identifying and referencing the specific market segment covered.
12. How do I determine which pricing option suits my needs best?
The pricing options vary based on user requirements and access needs. Individual users may opt for single-user licenses, while businesses requiring broader access may choose multi-user or enterprise licenses for cost-effective access to the report.
13. Are there any additional resources or data provided in the Wireless Infrastructure Monitoring Industry report?
While the report offers comprehensive insights, it's advisable to review the specific contents or supplementary materials provided to ascertain if additional resources or data are available.
14. How can I stay updated on further developments or reports in the Wireless Infrastructure Monitoring Industry?
To stay informed about further developments, trends, and reports in the Wireless Infrastructure Monitoring Industry, consider subscribing to industry newsletters, following relevant companies and organizations, or regularly checking reputable industry news sources and publications.
Methodology
Step 1 - Identification of Relevant Samples Size from Population Database


Step 2 - Approaches for Defining Global Market Size (Value, Volume* & Price*)

Note*: In applicable scenarios
Step 3 - Data Sources
Primary Research
- Web Analytics
- Survey Reports
- Research Institute
- Latest Research Reports
- Opinion Leaders
Secondary Research
- Annual Reports
- White Paper
- Latest Press Release
- Industry Association
- Paid Database
- Investor Presentations

Step 4 - Data Triangulation
Involves using different sources of information in order to increase the validity of a study
These sources are likely to be stakeholders in a program - participants, other researchers, program staff, other community members, and so on.
Then we put all data in single framework & apply various statistical tools to find out the dynamic on the market.
During the analysis stage, feedback from the stakeholder groups would be compared to determine areas of agreement as well as areas of divergence