


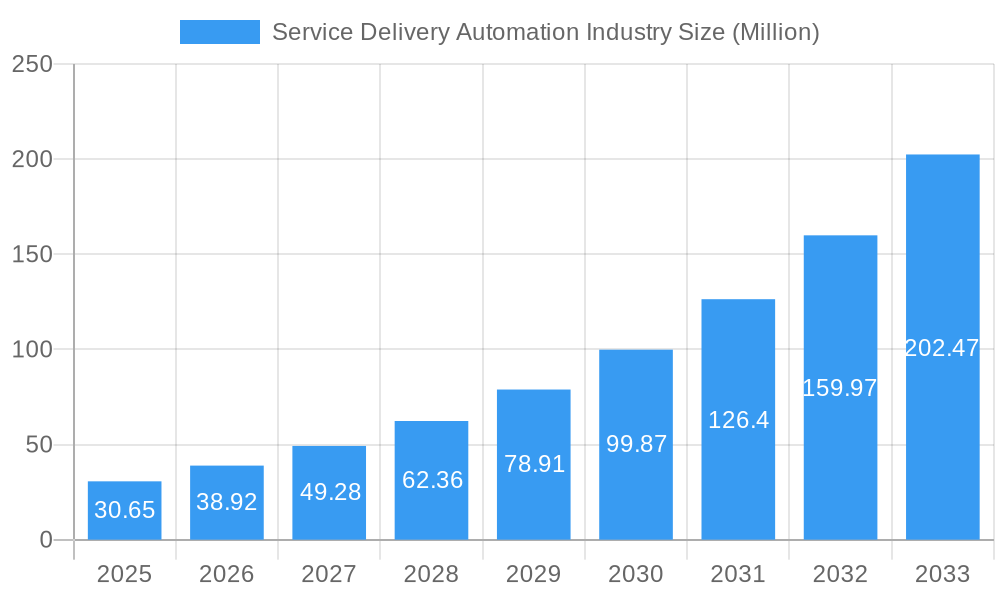
Key Insights
The Service Delivery Automation (SDA) market is poised for remarkable expansion, with a current market size estimated at a substantial $30.65 million. This robust growth is driven by an exceptional Compound Annual Growth Rate (CAGR) of 27.25%, signaling a dynamic and rapidly evolving industry. A primary catalyst for this surge is the increasing demand for enhanced operational efficiency and cost reduction across various business functions. Organizations are actively seeking solutions that can automate repetitive tasks, streamline workflows, and improve the overall quality of service delivery. The integration of Artificial Intelligence (AI) and Machine Learning (ML) into SDA platforms is a significant trend, enabling more intelligent automation and predictive capabilities. Furthermore, the growing adoption of cloud-based SDA solutions is democratizing access to these technologies, making them more scalable and affordable for businesses of all sizes. The rising need for improved customer experiences and faster response times in a competitive landscape also fuels the market's upward trajectory.

Service Delivery Automation Industry Market Size (In Million)

The SDA market is segmented into IT Process Automation and Business Process Automation, catering to a broad spectrum of organizational needs. Large Enterprises and Small & Medium Enterprises (SMEs) alike are recognizing the strategic imperative of SDA to maintain competitiveness. Key end-user industries, including BFSI, IT, Telecommunication and Media, Healthcare and Pharmaceuticals, and Manufacturing and Logistics, are leading the adoption due to the significant operational benefits SDA offers. Emerging economies, particularly in the Asia Pacific region, are expected to witness accelerated growth due to increasing digital transformation initiatives and a burgeoning IT sector. While the market presents immense opportunities, potential restraints such as the initial investment costs, the need for skilled talent to manage and implement these solutions, and concerns around data security and privacy could pose challenges. However, the continuous innovation in SDA technologies, coupled with the clear return on investment, is expected to largely outweigh these limitations, solidifying SDA's position as a critical component of modern business operations.
Service Delivery Automation Industry Company Market Share
Service Delivery Automation Industry: Comprehensive Market Analysis and Future Outlook (2019-2033)
This in-depth report provides a strategic overview of the global Service Delivery Automation (SDA) market, analyzing its current landscape and projecting its trajectory through 2033. Leveraging high-traffic keywords such as Robotic Process Automation (RPA), Business Process Automation (BPA), IT Process Automation (ITPA), Artificial Intelligence (AI), and Intelligent Automation, this research is designed to equip industry professionals, investors, and decision-makers with actionable insights. The report meticulously examines market dynamics, growth trends, regional dominance, key players, and emerging opportunities within both parent and child market segments, offering a holistic understanding of this rapidly evolving sector.
Service Delivery Automation Industry Market Dynamics & Structure
The Service Delivery Automation (SDA) market is characterized by a dynamic interplay of technological innovation, evolving end-user demands, and a competitive landscape. Market concentration is observed with leading players dominating specific niches, yet the rapid pace of innovation fosters opportunities for new entrants. Technological advancements, particularly in Artificial Intelligence (AI) and Machine Learning (ML), are the primary drivers of innovation, enabling more sophisticated automation capabilities that extend beyond simple task execution. Robotic Process Automation (RPA) and Intelligent Automation platforms are continuously evolving to handle complex workflows and unstructured data, blurring the lines between IT process automation and business process automation.
- Market Concentration: While a few major vendors hold significant market share, the landscape is fragmenting with the emergence of specialized solutions catering to specific industry needs.
- Technological Innovation Drivers: The integration of AI/ML, natural language processing (NLP), and intelligent document processing (IDP) is expanding the scope and intelligence of SDA solutions. The demand for end-to-end automation from Large Enterprises and Small & Medium Enterprises (SMEs) fuels this innovation.
- Regulatory Frameworks: While the SDA market is largely self-regulated by industry best practices, evolving data privacy regulations (e.g., GDPR, CCPA) influence the design and deployment of automation solutions, particularly in sensitive sectors like BFSI and Healthcare.
- Competitive Product Substitutes: Emerging low-code/no-code platforms, advanced workflow management tools, and internal IT development initiatives can act as partial substitutes, pushing SDA vendors to offer more comprehensive and integrated solutions.
- End-User Demographics: The demand for SDA spans across numerous end-user industries, including BFSI, IT, Telecommunication and Media, Retail and Consumer Goods, Healthcare and Pharmaceuticals, and Manufacturing and Logistics. Each sector presents unique automation requirements and adoption curves.
- M&A Trends: Mergers and acquisitions are prevalent as larger players seek to consolidate market share, acquire innovative technologies, and expand their service portfolios. This trend is particularly evident in the IT Process Automation and Business Process Automation segments.
Service Delivery Automation Industry Growth Trends & Insights
The global Service Delivery Automation (SDA) market is poised for substantial growth, driven by the relentless pursuit of operational efficiency, cost reduction, and enhanced customer experiences across all business sectors. The market size is projected to experience a significant uplift, with an estimated CAGR of XX% during the forecast period of 2025–2033. This robust growth trajectory is underpinned by an accelerating adoption rate of automation technologies by organizations of all sizes, from Large Enterprises seeking to optimize complex operations to Small & Medium Enterprises (SMEs) aiming to level the playing field with larger competitors.
The fundamental shift in consumer behavior, characterized by an increasing demand for instant gratification and seamless digital interactions, compels businesses to adopt SDA to meet these elevated expectations. IT Process Automation is a mature segment, but its evolution continues with the integration of AI for predictive maintenance and self-healing systems. Simultaneously, Business Process Automation is witnessing a surge in adoption as organizations aim to streamline customer onboarding, claims processing, supply chain management, and human resources functions. The "work from anywhere" paradigm has further amplified the need for robust, scalable, and secure automation solutions that can manage distributed workforces and complex service delivery chains.
Technological disruptions, such as advancements in Intelligent Document Processing (IDP) and the growing maturity of Conversational AI, are expanding the application of SDA beyond repetitive tasks. These technologies enable automation of processes involving unstructured data and complex decision-making, thereby unlocking new use cases and driving deeper market penetration. The integration of SDA with other enterprise systems, including CRM, ERP, and core banking platforms, is becoming increasingly seamless, fostering a more interconnected and automated operational ecosystem. The economic imperative to do more with less, coupled with the competitive advantage gained by early adopters, ensures that SDA will remain a critical component of business strategy for the foreseeable future. The Telecommunication and Media sector, in particular, is a significant adopter, leveraging automation for customer service, network management, and content delivery. Similarly, the BFSI sector is rapidly integrating SDA for fraud detection, regulatory compliance, and personalized financial services. The increasing digital transformation initiatives across industries are directly translating into higher market penetration for SDA solutions, making it a critical investment for organizations looking to thrive in the digital economy.
Dominant Regions, Countries, or Segments in Service Delivery Automation Industry
The global Service Delivery Automation (SDA) market exhibits distinct regional and segment-specific growth patterns, with North America currently leading in terms of market share and adoption velocity. This dominance is attributed to a mature technological infrastructure, a strong presence of innovative technology companies, and a proactive business environment that encourages the early adoption of advanced automation solutions. The United States, in particular, stands out as a key country driving this growth, fueled by substantial investments in Robotic Process Automation (RPA), Intelligent Automation, and Artificial Intelligence (AI) across various sectors.
Within the United States, the BFSI and IT sectors are the primary beneficiaries and adopters of SDA. These industries leverage automation for critical functions such as fraud detection, risk management, customer onboarding, IT service management, and software development lifecycle optimization. The stringent regulatory requirements in the BFSI sector necessitate robust and efficient processes, making SDA an indispensable tool for compliance and operational excellence. Similarly, the fast-paced nature of the IT industry demands continuous innovation and rapid deployment, which is significantly enhanced by IT Process Automation and Business Process Automation.
- Dominant Segment (Type): Business Process Automation (BPA) is emerging as a dominant force, evolving beyond traditional IT Process Automation to encompass end-to-end business workflows. This segment's growth is driven by its ability to address complex operational challenges and deliver tangible business outcomes across diverse industries.
- Dominant Segment (Organization Size): Large Enterprises are the largest consumers of SDA solutions due to their complex operational structures, higher budget allocations for technology investments, and the significant potential for cost savings and efficiency gains. However, the growth in the Small & Medium Enterprises (SMEs) segment is rapidly accelerating as cloud-based, scalable, and more affordable SDA solutions become available.
- Dominant End-User Industry: The BFSI sector continues to be a leading adopter, driven by the need for enhanced security, regulatory compliance, and improved customer experience. Significant growth is also observed in IT and Telecommunication and Media, where automation is crucial for managing vast customer bases, complex network infrastructures, and dynamic content delivery. The Healthcare and Pharmaceuticals sector is also a rapidly growing segment, with SDA playing a crucial role in streamlining patient care, drug discovery processes, and administrative tasks.
- Key Drivers in North America:
- Technological Advancement: The concentration of leading SDA vendors and research institutions in the region fosters continuous innovation.
- Economic Policies: Supportive government initiatives and a favorable business climate encourage technology adoption.
- High Adoption of Digital Transformation: Businesses are actively investing in digital transformation, with SDA being a core component.
- Presence of Key Players: Major SDA providers have a strong presence and customer base in North America.
- Growth Potential in Other Regions: While North America leads, Asia Pacific and Europe are demonstrating robust growth. Asia Pacific, particularly countries like India and China, is witnessing rapid adoption due to a large talent pool, growing IT infrastructure, and increasing government support for digital initiatives. Europe's mature economies are focusing on advanced automation for compliance and operational efficiency, especially in the BFSI and manufacturing sectors.
Service Delivery Automation Industry Product Landscape
The Service Delivery Automation (SDA) product landscape is characterized by continuous innovation, focusing on enhanced intelligence, user-friendliness, and seamless integration. Vendors are increasingly embedding Artificial Intelligence (AI) and Machine Learning (ML) capabilities into their platforms, enabling Intelligent Automation that can handle unstructured data, make informed decisions, and learn from past interactions. Robotic Process Automation (RPA) solutions are evolving to offer more advanced features like attended and unattended automation, process mining for identifying automation opportunities, and robust analytics for monitoring performance.
Unique selling propositions often lie in the platform's ability to offer end-to-end automation solutions, from process discovery and design to deployment and ongoing management. IT Process Automation tools are integrating predictive analytics for proactive issue resolution, while Business Process Automation platforms are focusing on enhancing customer experience through intelligent chatbots and personalized service delivery. Technological advancements in areas like Natural Language Processing (NLP) are enabling SDA to understand and process human language, opening up new avenues for automating customer service and communication-intensive tasks.
Key Drivers, Barriers & Challenges in Service Delivery Automation Industry
The Service Delivery Automation (SDA) market is propelled by several key drivers, primarily the relentless pursuit of operational efficiency and cost reduction. Organizations are increasingly recognizing automation as a strategic imperative to remain competitive in a rapidly evolving business landscape.
Key Drivers:
- Increased Demand for Operational Efficiency: Businesses across all sectors are seeking to streamline workflows, reduce manual effort, and minimize errors, leading to significant cost savings.
- Digital Transformation Initiatives: The widespread adoption of digital transformation strategies positions SDA as a foundational technology for achieving business goals.
- Enhanced Customer Experience: Automation enables faster, more personalized, and consistent service delivery, leading to improved customer satisfaction and loyalty.
- Technological Advancements: Continuous innovation in AI, ML, and RPA capabilities is expanding the scope and intelligence of SDA solutions.
- Scalability and Flexibility: SDA solutions offer the ability to scale operations up or down quickly in response to changing business demands.
However, the market also faces significant barriers and challenges that can impede adoption and growth.
Barriers & Challenges:
- High Initial Investment Costs: Implementing comprehensive SDA solutions can require substantial upfront investment in software, hardware, and skilled personnel.
- Integration Complexities: Integrating SDA platforms with existing legacy systems can be challenging and time-consuming, especially for organizations with complex IT infrastructures.
- Lack of Skilled Workforce: A shortage of skilled professionals capable of designing, implementing, and managing automation solutions can hinder adoption.
- Resistance to Change: Employee concerns about job security and the need for organizational change management can create resistance to automation initiatives.
- Data Security and Privacy Concerns: Ensuring the security and privacy of sensitive data processed by automation tools is paramount and requires robust governance.
- Regulatory Hurdles: Adhering to evolving data privacy regulations and industry-specific compliance requirements can add complexity to automation deployments.
Emerging Opportunities in Service Delivery Automation Industry
The Service Delivery Automation (SDA) market presents a fertile ground for emerging opportunities, driven by the increasing sophistication of AI and the growing demand for hyper-automation. One significant opportunity lies in the expansion of Intelligent Automation capabilities, moving beyond simple task automation to encompass complex decision-making processes. This includes leveraging AI-powered analytics for predictive maintenance, proactive issue resolution, and personalized customer engagement.
The untapped potential in Small & Medium Enterprises (SMEs) represents another key opportunity. As cloud-based and subscription-based SDA models become more accessible and affordable, SMEs can now leverage automation to enhance their competitiveness without significant capital outlay. Furthermore, the convergence of SDA with other emerging technologies such as the Internet of Things (IoT) and blockchain is creating new use cases in areas like supply chain optimization, smart manufacturing, and secure data management. The growing demand for end-to-end automation solutions that can address the entire business process lifecycle, from discovery to ongoing optimization, also presents a substantial opportunity for vendors to offer integrated platforms.
Growth Accelerators in the Service Delivery Automation Industry Industry
Several critical catalysts are accelerating the growth of the Service Delivery Automation (SDA) industry. The relentless drive for digital transformation across all sectors remains a primary growth accelerator, pushing organizations to adopt automation as a cornerstone of their modernization efforts. Technological breakthroughs in Artificial Intelligence (AI), particularly in areas like Natural Language Processing (NLP), Machine Learning (ML), and Computer Vision, are continuously expanding the capabilities and applications of SDA, making it more intelligent and versatile.
Strategic partnerships between SDA vendors and technology providers, as well as consultancies, are instrumental in expanding market reach and offering integrated solutions to a wider customer base. Market expansion strategies, including geographical diversification into emerging economies and the development of industry-specific automation solutions, are also significant growth drivers. Furthermore, the increasing awareness among businesses regarding the tangible ROI and competitive advantages offered by SDA is fueling demand and encouraging greater investment in automation initiatives. The growing adoption of AI-powered analytics for process mining and optimization is also a key accelerator, enabling organizations to identify new automation opportunities and improve the effectiveness of existing deployments.
Key Players Shaping the Service Delivery Automation Industry Market
The Service Delivery Automation (SDA) industry is shaped by a dynamic ecosystem of innovative companies. Key players driving advancements and market adoption include:
- Arago GmbH
- NICE Systems Ltd
- AutomationEdge Technologies Inc
- Xerox Corporation
- Celaton Limited
- Automation Anywhere Inc
- UiPath SRL
- IPsoft Inc
- Blue Prism
- Accenture Inc
Notable Milestones in Service Delivery Automation Industry Sector
- March 2023: UiPath announced that data science teams who use Amazon SageMaker, an end-to-end machine learning (ML) service, can now integrate new machine learning models into business processes seamlessly and quickly with UiPath without intricate coding or manual labor. By automating deployment pipelines, data scientists, ML engineers, and business analysts can decrease the cost of experimentation and speed up innovation.
- January 2023: A partnership between NICE and Cognizant opened up growth opportunities in CX, WFM, and digital transformation. This partnership offers a comprehensive approach to bridging the gap between today's consumer expectations and organizations' delivery of extraordinary experiences. It is a significant step towards transforming customer and agent experiences with a unified CCaaS suite that includes omnichannel routing, AI, Analytics, WFO, and Digital Self-Service offerings, redefining how organizations engage and interact with customers.
In-Depth Service Delivery Automation Industry Market Outlook
The Service Delivery Automation (SDA) market is set for an impressive expansion in the coming years, fueled by a confluence of technological advancements and evolving business needs. The continuous maturation of Artificial Intelligence (AI) and Machine Learning (ML) capabilities will unlock new levels of intelligent automation, enabling solutions to handle increasingly complex tasks and decision-making processes. This will further drive the adoption of Intelligent Process Automation across sectors like BFSI, Healthcare, and Manufacturing. The growing emphasis on enhancing customer experience and optimizing operational efficiency will continue to be a significant market driver. Emerging economies, with their rapidly developing digital infrastructure and a strong appetite for technological adoption, present substantial untapped potential for market growth. Strategic collaborations and the development of comprehensive, end-to-end automation platforms will be key to capturing market share. The future outlook for SDA is exceptionally bright, positioning it as an indispensable component of modern business strategy and a critical enabler of digital transformation.
Service Delivery Automation Industry Segmentation
-
1. Type
- 1.1. IT Process Automation
- 1.2. Business Process Automation
-
2. Organization Size
- 2.1. Large Enterprises
- 2.2. Small & Medium Enterprises (SMEs)
-
3. End-user Industry
- 3.1. BFSI
- 3.2. IT
- 3.3. Telecommunication and Media
- 3.4. Hospitality and Transportation
- 3.5. Retail and Consumer Goods
- 3.6. Healthcare and Pharmaceuticals
- 3.7. Manufacturing and Logistics
- 3.8. Other End-User Industries
Service Delivery Automation Industry Segmentation By Geography
- 1. North America
- 2. Europe
- 3. Asia Pacific
- 4. Latin America
- 5. Middle East and Africa

Service Delivery Automation Industry Regional Market Share
Geographic Coverage of Service Delivery Automation Industry
Service Delivery Automation Industry REPORT HIGHLIGHTS
| Aspects | Details |
|---|---|
| Study Period | 2020-2034 |
| Base Year | 2025 |
| Estimated Year | 2026 |
| Forecast Period | 2026-2034 |
| Historical Period | 2020-2025 |
| Growth Rate | CAGR of 27.25% from 2020-2034 |
| Segmentation |
|
Table of Contents
- 1. Introduction
- 1.1. Research Scope
- 1.2. Market Segmentation
- 1.3. Research Methodology
- 1.4. Definitions and Assumptions
- 2. Executive Summary
- 2.1. Introduction
- 3. Market Dynamics
- 3.1. Introduction
- 3.2. Market Drivers
- 3.2.1. Need for Operational Efficiency; Cost-cutting Across Industries
- 3.3. Market Restrains
- 3.3.1. Lack of Skilled Personnel
- 3.4. Market Trends
- 3.4.1. Retail and Consumer Goods to Dominate the Market
- 4. Market Factor Analysis
- 4.1. Porters Five Forces
- 4.2. Supply/Value Chain
- 4.3. PESTEL analysis
- 4.4. Market Entropy
- 4.5. Patent/Trademark Analysis
- 5. Global Service Delivery Automation Industry Analysis, Insights and Forecast, 2020-2032
- 5.1. Market Analysis, Insights and Forecast - by Type
- 5.1.1. IT Process Automation
- 5.1.2. Business Process Automation
- 5.2. Market Analysis, Insights and Forecast - by Organization Size
- 5.2.1. Large Enterprises
- 5.2.2. Small & Medium Enterprises (SMEs)
- 5.3. Market Analysis, Insights and Forecast - by End-user Industry
- 5.3.1. BFSI
- 5.3.2. IT
- 5.3.3. Telecommunication and Media
- 5.3.4. Hospitality and Transportation
- 5.3.5. Retail and Consumer Goods
- 5.3.6. Healthcare and Pharmaceuticals
- 5.3.7. Manufacturing and Logistics
- 5.3.8. Other End-User Industries
- 5.4. Market Analysis, Insights and Forecast - by Region
- 5.4.1. North America
- 5.4.2. Europe
- 5.4.3. Asia Pacific
- 5.4.4. Latin America
- 5.4.5. Middle East and Africa
- 5.1. Market Analysis, Insights and Forecast - by Type
- 6. North America Service Delivery Automation Industry Analysis, Insights and Forecast, 2020-2032
- 6.1. Market Analysis, Insights and Forecast - by Type
- 6.1.1. IT Process Automation
- 6.1.2. Business Process Automation
- 6.2. Market Analysis, Insights and Forecast - by Organization Size
- 6.2.1. Large Enterprises
- 6.2.2. Small & Medium Enterprises (SMEs)
- 6.3. Market Analysis, Insights and Forecast - by End-user Industry
- 6.3.1. BFSI
- 6.3.2. IT
- 6.3.3. Telecommunication and Media
- 6.3.4. Hospitality and Transportation
- 6.3.5. Retail and Consumer Goods
- 6.3.6. Healthcare and Pharmaceuticals
- 6.3.7. Manufacturing and Logistics
- 6.3.8. Other End-User Industries
- 6.1. Market Analysis, Insights and Forecast - by Type
- 7. Europe Service Delivery Automation Industry Analysis, Insights and Forecast, 2020-2032
- 7.1. Market Analysis, Insights and Forecast - by Type
- 7.1.1. IT Process Automation
- 7.1.2. Business Process Automation
- 7.2. Market Analysis, Insights and Forecast - by Organization Size
- 7.2.1. Large Enterprises
- 7.2.2. Small & Medium Enterprises (SMEs)
- 7.3. Market Analysis, Insights and Forecast - by End-user Industry
- 7.3.1. BFSI
- 7.3.2. IT
- 7.3.3. Telecommunication and Media
- 7.3.4. Hospitality and Transportation
- 7.3.5. Retail and Consumer Goods
- 7.3.6. Healthcare and Pharmaceuticals
- 7.3.7. Manufacturing and Logistics
- 7.3.8. Other End-User Industries
- 7.1. Market Analysis, Insights and Forecast - by Type
- 8. Asia Pacific Service Delivery Automation Industry Analysis, Insights and Forecast, 2020-2032
- 8.1. Market Analysis, Insights and Forecast - by Type
- 8.1.1. IT Process Automation
- 8.1.2. Business Process Automation
- 8.2. Market Analysis, Insights and Forecast - by Organization Size
- 8.2.1. Large Enterprises
- 8.2.2. Small & Medium Enterprises (SMEs)
- 8.3. Market Analysis, Insights and Forecast - by End-user Industry
- 8.3.1. BFSI
- 8.3.2. IT
- 8.3.3. Telecommunication and Media
- 8.3.4. Hospitality and Transportation
- 8.3.5. Retail and Consumer Goods
- 8.3.6. Healthcare and Pharmaceuticals
- 8.3.7. Manufacturing and Logistics
- 8.3.8. Other End-User Industries
- 8.1. Market Analysis, Insights and Forecast - by Type
- 9. Latin America Service Delivery Automation Industry Analysis, Insights and Forecast, 2020-2032
- 9.1. Market Analysis, Insights and Forecast - by Type
- 9.1.1. IT Process Automation
- 9.1.2. Business Process Automation
- 9.2. Market Analysis, Insights and Forecast - by Organization Size
- 9.2.1. Large Enterprises
- 9.2.2. Small & Medium Enterprises (SMEs)
- 9.3. Market Analysis, Insights and Forecast - by End-user Industry
- 9.3.1. BFSI
- 9.3.2. IT
- 9.3.3. Telecommunication and Media
- 9.3.4. Hospitality and Transportation
- 9.3.5. Retail and Consumer Goods
- 9.3.6. Healthcare and Pharmaceuticals
- 9.3.7. Manufacturing and Logistics
- 9.3.8. Other End-User Industries
- 9.1. Market Analysis, Insights and Forecast - by Type
- 10. Middle East and Africa Service Delivery Automation Industry Analysis, Insights and Forecast, 2020-2032
- 10.1. Market Analysis, Insights and Forecast - by Type
- 10.1.1. IT Process Automation
- 10.1.2. Business Process Automation
- 10.2. Market Analysis, Insights and Forecast - by Organization Size
- 10.2.1. Large Enterprises
- 10.2.2. Small & Medium Enterprises (SMEs)
- 10.3. Market Analysis, Insights and Forecast - by End-user Industry
- 10.3.1. BFSI
- 10.3.2. IT
- 10.3.3. Telecommunication and Media
- 10.3.4. Hospitality and Transportation
- 10.3.5. Retail and Consumer Goods
- 10.3.6. Healthcare and Pharmaceuticals
- 10.3.7. Manufacturing and Logistics
- 10.3.8. Other End-User Industries
- 10.1. Market Analysis, Insights and Forecast - by Type
- 11. Competitive Analysis
- 11.1. Global Market Share Analysis 2025
- 11.2. Company Profiles
- 11.2.1 Arago GmbH
- 11.2.1.1. Overview
- 11.2.1.2. Products
- 11.2.1.3. SWOT Analysis
- 11.2.1.4. Recent Developments
- 11.2.1.5. Financials (Based on Availability)
- 11.2.2 NICE Systems Ltd
- 11.2.2.1. Overview
- 11.2.2.2. Products
- 11.2.2.3. SWOT Analysis
- 11.2.2.4. Recent Developments
- 11.2.2.5. Financials (Based on Availability)
- 11.2.3 AutomationEdge Technologies Inc
- 11.2.3.1. Overview
- 11.2.3.2. Products
- 11.2.3.3. SWOT Analysis
- 11.2.3.4. Recent Developments
- 11.2.3.5. Financials (Based on Availability)
- 11.2.4 Xerox Corporation
- 11.2.4.1. Overview
- 11.2.4.2. Products
- 11.2.4.3. SWOT Analysis
- 11.2.4.4. Recent Developments
- 11.2.4.5. Financials (Based on Availability)
- 11.2.5 Celaton Limited
- 11.2.5.1. Overview
- 11.2.5.2. Products
- 11.2.5.3. SWOT Analysis
- 11.2.5.4. Recent Developments
- 11.2.5.5. Financials (Based on Availability)
- 11.2.6 Automation Anywhere Inc
- 11.2.6.1. Overview
- 11.2.6.2. Products
- 11.2.6.3. SWOT Analysis
- 11.2.6.4. Recent Developments
- 11.2.6.5. Financials (Based on Availability)
- 11.2.7 Uipath SRL
- 11.2.7.1. Overview
- 11.2.7.2. Products
- 11.2.7.3. SWOT Analysis
- 11.2.7.4. Recent Developments
- 11.2.7.5. Financials (Based on Availability)
- 11.2.8 IPsoft Inc
- 11.2.8.1. Overview
- 11.2.8.2. Products
- 11.2.8.3. SWOT Analysis
- 11.2.8.4. Recent Developments
- 11.2.8.5. Financials (Based on Availability)
- 11.2.9 Blue Prism
- 11.2.9.1. Overview
- 11.2.9.2. Products
- 11.2.9.3. SWOT Analysis
- 11.2.9.4. Recent Developments
- 11.2.9.5. Financials (Based on Availability)
- 11.2.10 Accenture Inc
- 11.2.10.1. Overview
- 11.2.10.2. Products
- 11.2.10.3. SWOT Analysis
- 11.2.10.4. Recent Developments
- 11.2.10.5. Financials (Based on Availability)
- 11.2.1 Arago GmbH
List of Figures
- Figure 1: Global Service Delivery Automation Industry Revenue Breakdown (Million, %) by Region 2025 & 2033
- Figure 2: Global Service Delivery Automation Industry Volume Breakdown (K Unit, %) by Region 2025 & 2033
- Figure 3: North America Service Delivery Automation Industry Revenue (Million), by Type 2025 & 2033
- Figure 4: North America Service Delivery Automation Industry Volume (K Unit), by Type 2025 & 2033
- Figure 5: North America Service Delivery Automation Industry Revenue Share (%), by Type 2025 & 2033
- Figure 6: North America Service Delivery Automation Industry Volume Share (%), by Type 2025 & 2033
- Figure 7: North America Service Delivery Automation Industry Revenue (Million), by Organization Size 2025 & 2033
- Figure 8: North America Service Delivery Automation Industry Volume (K Unit), by Organization Size 2025 & 2033
- Figure 9: North America Service Delivery Automation Industry Revenue Share (%), by Organization Size 2025 & 2033
- Figure 10: North America Service Delivery Automation Industry Volume Share (%), by Organization Size 2025 & 2033
- Figure 11: North America Service Delivery Automation Industry Revenue (Million), by End-user Industry 2025 & 2033
- Figure 12: North America Service Delivery Automation Industry Volume (K Unit), by End-user Industry 2025 & 2033
- Figure 13: North America Service Delivery Automation Industry Revenue Share (%), by End-user Industry 2025 & 2033
- Figure 14: North America Service Delivery Automation Industry Volume Share (%), by End-user Industry 2025 & 2033
- Figure 15: North America Service Delivery Automation Industry Revenue (Million), by Country 2025 & 2033
- Figure 16: North America Service Delivery Automation Industry Volume (K Unit), by Country 2025 & 2033
- Figure 17: North America Service Delivery Automation Industry Revenue Share (%), by Country 2025 & 2033
- Figure 18: North America Service Delivery Automation Industry Volume Share (%), by Country 2025 & 2033
- Figure 19: Europe Service Delivery Automation Industry Revenue (Million), by Type 2025 & 2033
- Figure 20: Europe Service Delivery Automation Industry Volume (K Unit), by Type 2025 & 2033
- Figure 21: Europe Service Delivery Automation Industry Revenue Share (%), by Type 2025 & 2033
- Figure 22: Europe Service Delivery Automation Industry Volume Share (%), by Type 2025 & 2033
- Figure 23: Europe Service Delivery Automation Industry Revenue (Million), by Organization Size 2025 & 2033
- Figure 24: Europe Service Delivery Automation Industry Volume (K Unit), by Organization Size 2025 & 2033
- Figure 25: Europe Service Delivery Automation Industry Revenue Share (%), by Organization Size 2025 & 2033
- Figure 26: Europe Service Delivery Automation Industry Volume Share (%), by Organization Size 2025 & 2033
- Figure 27: Europe Service Delivery Automation Industry Revenue (Million), by End-user Industry 2025 & 2033
- Figure 28: Europe Service Delivery Automation Industry Volume (K Unit), by End-user Industry 2025 & 2033
- Figure 29: Europe Service Delivery Automation Industry Revenue Share (%), by End-user Industry 2025 & 2033
- Figure 30: Europe Service Delivery Automation Industry Volume Share (%), by End-user Industry 2025 & 2033
- Figure 31: Europe Service Delivery Automation Industry Revenue (Million), by Country 2025 & 2033
- Figure 32: Europe Service Delivery Automation Industry Volume (K Unit), by Country 2025 & 2033
- Figure 33: Europe Service Delivery Automation Industry Revenue Share (%), by Country 2025 & 2033
- Figure 34: Europe Service Delivery Automation Industry Volume Share (%), by Country 2025 & 2033
- Figure 35: Asia Pacific Service Delivery Automation Industry Revenue (Million), by Type 2025 & 2033
- Figure 36: Asia Pacific Service Delivery Automation Industry Volume (K Unit), by Type 2025 & 2033
- Figure 37: Asia Pacific Service Delivery Automation Industry Revenue Share (%), by Type 2025 & 2033
- Figure 38: Asia Pacific Service Delivery Automation Industry Volume Share (%), by Type 2025 & 2033
- Figure 39: Asia Pacific Service Delivery Automation Industry Revenue (Million), by Organization Size 2025 & 2033
- Figure 40: Asia Pacific Service Delivery Automation Industry Volume (K Unit), by Organization Size 2025 & 2033
- Figure 41: Asia Pacific Service Delivery Automation Industry Revenue Share (%), by Organization Size 2025 & 2033
- Figure 42: Asia Pacific Service Delivery Automation Industry Volume Share (%), by Organization Size 2025 & 2033
- Figure 43: Asia Pacific Service Delivery Automation Industry Revenue (Million), by End-user Industry 2025 & 2033
- Figure 44: Asia Pacific Service Delivery Automation Industry Volume (K Unit), by End-user Industry 2025 & 2033
- Figure 45: Asia Pacific Service Delivery Automation Industry Revenue Share (%), by End-user Industry 2025 & 2033
- Figure 46: Asia Pacific Service Delivery Automation Industry Volume Share (%), by End-user Industry 2025 & 2033
- Figure 47: Asia Pacific Service Delivery Automation Industry Revenue (Million), by Country 2025 & 2033
- Figure 48: Asia Pacific Service Delivery Automation Industry Volume (K Unit), by Country 2025 & 2033
- Figure 49: Asia Pacific Service Delivery Automation Industry Revenue Share (%), by Country 2025 & 2033
- Figure 50: Asia Pacific Service Delivery Automation Industry Volume Share (%), by Country 2025 & 2033
- Figure 51: Latin America Service Delivery Automation Industry Revenue (Million), by Type 2025 & 2033
- Figure 52: Latin America Service Delivery Automation Industry Volume (K Unit), by Type 2025 & 2033
- Figure 53: Latin America Service Delivery Automation Industry Revenue Share (%), by Type 2025 & 2033
- Figure 54: Latin America Service Delivery Automation Industry Volume Share (%), by Type 2025 & 2033
- Figure 55: Latin America Service Delivery Automation Industry Revenue (Million), by Organization Size 2025 & 2033
- Figure 56: Latin America Service Delivery Automation Industry Volume (K Unit), by Organization Size 2025 & 2033
- Figure 57: Latin America Service Delivery Automation Industry Revenue Share (%), by Organization Size 2025 & 2033
- Figure 58: Latin America Service Delivery Automation Industry Volume Share (%), by Organization Size 2025 & 2033
- Figure 59: Latin America Service Delivery Automation Industry Revenue (Million), by End-user Industry 2025 & 2033
- Figure 60: Latin America Service Delivery Automation Industry Volume (K Unit), by End-user Industry 2025 & 2033
- Figure 61: Latin America Service Delivery Automation Industry Revenue Share (%), by End-user Industry 2025 & 2033
- Figure 62: Latin America Service Delivery Automation Industry Volume Share (%), by End-user Industry 2025 & 2033
- Figure 63: Latin America Service Delivery Automation Industry Revenue (Million), by Country 2025 & 2033
- Figure 64: Latin America Service Delivery Automation Industry Volume (K Unit), by Country 2025 & 2033
- Figure 65: Latin America Service Delivery Automation Industry Revenue Share (%), by Country 2025 & 2033
- Figure 66: Latin America Service Delivery Automation Industry Volume Share (%), by Country 2025 & 2033
- Figure 67: Middle East and Africa Service Delivery Automation Industry Revenue (Million), by Type 2025 & 2033
- Figure 68: Middle East and Africa Service Delivery Automation Industry Volume (K Unit), by Type 2025 & 2033
- Figure 69: Middle East and Africa Service Delivery Automation Industry Revenue Share (%), by Type 2025 & 2033
- Figure 70: Middle East and Africa Service Delivery Automation Industry Volume Share (%), by Type 2025 & 2033
- Figure 71: Middle East and Africa Service Delivery Automation Industry Revenue (Million), by Organization Size 2025 & 2033
- Figure 72: Middle East and Africa Service Delivery Automation Industry Volume (K Unit), by Organization Size 2025 & 2033
- Figure 73: Middle East and Africa Service Delivery Automation Industry Revenue Share (%), by Organization Size 2025 & 2033
- Figure 74: Middle East and Africa Service Delivery Automation Industry Volume Share (%), by Organization Size 2025 & 2033
- Figure 75: Middle East and Africa Service Delivery Automation Industry Revenue (Million), by End-user Industry 2025 & 2033
- Figure 76: Middle East and Africa Service Delivery Automation Industry Volume (K Unit), by End-user Industry 2025 & 2033
- Figure 77: Middle East and Africa Service Delivery Automation Industry Revenue Share (%), by End-user Industry 2025 & 2033
- Figure 78: Middle East and Africa Service Delivery Automation Industry Volume Share (%), by End-user Industry 2025 & 2033
- Figure 79: Middle East and Africa Service Delivery Automation Industry Revenue (Million), by Country 2025 & 2033
- Figure 80: Middle East and Africa Service Delivery Automation Industry Volume (K Unit), by Country 2025 & 2033
- Figure 81: Middle East and Africa Service Delivery Automation Industry Revenue Share (%), by Country 2025 & 2033
- Figure 82: Middle East and Africa Service Delivery Automation Industry Volume Share (%), by Country 2025 & 2033
List of Tables
- Table 1: Global Service Delivery Automation Industry Revenue Million Forecast, by Type 2020 & 2033
- Table 2: Global Service Delivery Automation Industry Volume K Unit Forecast, by Type 2020 & 2033
- Table 3: Global Service Delivery Automation Industry Revenue Million Forecast, by Organization Size 2020 & 2033
- Table 4: Global Service Delivery Automation Industry Volume K Unit Forecast, by Organization Size 2020 & 2033
- Table 5: Global Service Delivery Automation Industry Revenue Million Forecast, by End-user Industry 2020 & 2033
- Table 6: Global Service Delivery Automation Industry Volume K Unit Forecast, by End-user Industry 2020 & 2033
- Table 7: Global Service Delivery Automation Industry Revenue Million Forecast, by Region 2020 & 2033
- Table 8: Global Service Delivery Automation Industry Volume K Unit Forecast, by Region 2020 & 2033
- Table 9: Global Service Delivery Automation Industry Revenue Million Forecast, by Type 2020 & 2033
- Table 10: Global Service Delivery Automation Industry Volume K Unit Forecast, by Type 2020 & 2033
- Table 11: Global Service Delivery Automation Industry Revenue Million Forecast, by Organization Size 2020 & 2033
- Table 12: Global Service Delivery Automation Industry Volume K Unit Forecast, by Organization Size 2020 & 2033
- Table 13: Global Service Delivery Automation Industry Revenue Million Forecast, by End-user Industry 2020 & 2033
- Table 14: Global Service Delivery Automation Industry Volume K Unit Forecast, by End-user Industry 2020 & 2033
- Table 15: Global Service Delivery Automation Industry Revenue Million Forecast, by Country 2020 & 2033
- Table 16: Global Service Delivery Automation Industry Volume K Unit Forecast, by Country 2020 & 2033
- Table 17: Global Service Delivery Automation Industry Revenue Million Forecast, by Type 2020 & 2033
- Table 18: Global Service Delivery Automation Industry Volume K Unit Forecast, by Type 2020 & 2033
- Table 19: Global Service Delivery Automation Industry Revenue Million Forecast, by Organization Size 2020 & 2033
- Table 20: Global Service Delivery Automation Industry Volume K Unit Forecast, by Organization Size 2020 & 2033
- Table 21: Global Service Delivery Automation Industry Revenue Million Forecast, by End-user Industry 2020 & 2033
- Table 22: Global Service Delivery Automation Industry Volume K Unit Forecast, by End-user Industry 2020 & 2033
- Table 23: Global Service Delivery Automation Industry Revenue Million Forecast, by Country 2020 & 2033
- Table 24: Global Service Delivery Automation Industry Volume K Unit Forecast, by Country 2020 & 2033
- Table 25: Global Service Delivery Automation Industry Revenue Million Forecast, by Type 2020 & 2033
- Table 26: Global Service Delivery Automation Industry Volume K Unit Forecast, by Type 2020 & 2033
- Table 27: Global Service Delivery Automation Industry Revenue Million Forecast, by Organization Size 2020 & 2033
- Table 28: Global Service Delivery Automation Industry Volume K Unit Forecast, by Organization Size 2020 & 2033
- Table 29: Global Service Delivery Automation Industry Revenue Million Forecast, by End-user Industry 2020 & 2033
- Table 30: Global Service Delivery Automation Industry Volume K Unit Forecast, by End-user Industry 2020 & 2033
- Table 31: Global Service Delivery Automation Industry Revenue Million Forecast, by Country 2020 & 2033
- Table 32: Global Service Delivery Automation Industry Volume K Unit Forecast, by Country 2020 & 2033
- Table 33: Global Service Delivery Automation Industry Revenue Million Forecast, by Type 2020 & 2033
- Table 34: Global Service Delivery Automation Industry Volume K Unit Forecast, by Type 2020 & 2033
- Table 35: Global Service Delivery Automation Industry Revenue Million Forecast, by Organization Size 2020 & 2033
- Table 36: Global Service Delivery Automation Industry Volume K Unit Forecast, by Organization Size 2020 & 2033
- Table 37: Global Service Delivery Automation Industry Revenue Million Forecast, by End-user Industry 2020 & 2033
- Table 38: Global Service Delivery Automation Industry Volume K Unit Forecast, by End-user Industry 2020 & 2033
- Table 39: Global Service Delivery Automation Industry Revenue Million Forecast, by Country 2020 & 2033
- Table 40: Global Service Delivery Automation Industry Volume K Unit Forecast, by Country 2020 & 2033
- Table 41: Global Service Delivery Automation Industry Revenue Million Forecast, by Type 2020 & 2033
- Table 42: Global Service Delivery Automation Industry Volume K Unit Forecast, by Type 2020 & 2033
- Table 43: Global Service Delivery Automation Industry Revenue Million Forecast, by Organization Size 2020 & 2033
- Table 44: Global Service Delivery Automation Industry Volume K Unit Forecast, by Organization Size 2020 & 2033
- Table 45: Global Service Delivery Automation Industry Revenue Million Forecast, by End-user Industry 2020 & 2033
- Table 46: Global Service Delivery Automation Industry Volume K Unit Forecast, by End-user Industry 2020 & 2033
- Table 47: Global Service Delivery Automation Industry Revenue Million Forecast, by Country 2020 & 2033
- Table 48: Global Service Delivery Automation Industry Volume K Unit Forecast, by Country 2020 & 2033
Frequently Asked Questions
1. What is the projected Compound Annual Growth Rate (CAGR) of the Service Delivery Automation Industry?
The projected CAGR is approximately 27.25%.
2. Which companies are prominent players in the Service Delivery Automation Industry?
Key companies in the market include Arago GmbH, NICE Systems Ltd, AutomationEdge Technologies Inc, Xerox Corporation, Celaton Limited, Automation Anywhere Inc, Uipath SRL, IPsoft Inc, Blue Prism, Accenture Inc.
3. What are the main segments of the Service Delivery Automation Industry?
The market segments include Type, Organization Size, End-user Industry.
4. Can you provide details about the market size?
The market size is estimated to be USD 30.65 Million as of 2022.
5. What are some drivers contributing to market growth?
Need for Operational Efficiency; Cost-cutting Across Industries.
6. What are the notable trends driving market growth?
Retail and Consumer Goods to Dominate the Market.
7. Are there any restraints impacting market growth?
Lack of Skilled Personnel.
8. Can you provide examples of recent developments in the market?
March 2023: UiPath announced that data science teams who use Amazon SageMaker, an end-to-end machine learning (ML) service, can now integrate new machine learning models into business processes seamlessly and quickly with UiPath without intricate coding or manual labor. By automating deployment pipelines, data scientists, ML engineers, and business analysts can decrease the cost of experimentation and speed up innovation.
9. What pricing options are available for accessing the report?
Pricing options include single-user, multi-user, and enterprise licenses priced at USD 4750, USD 5250, and USD 8750 respectively.
10. Is the market size provided in terms of value or volume?
The market size is provided in terms of value, measured in Million and volume, measured in K Unit.
11. Are there any specific market keywords associated with the report?
Yes, the market keyword associated with the report is "Service Delivery Automation Industry," which aids in identifying and referencing the specific market segment covered.
12. How do I determine which pricing option suits my needs best?
The pricing options vary based on user requirements and access needs. Individual users may opt for single-user licenses, while businesses requiring broader access may choose multi-user or enterprise licenses for cost-effective access to the report.
13. Are there any additional resources or data provided in the Service Delivery Automation Industry report?
While the report offers comprehensive insights, it's advisable to review the specific contents or supplementary materials provided to ascertain if additional resources or data are available.
14. How can I stay updated on further developments or reports in the Service Delivery Automation Industry?
To stay informed about further developments, trends, and reports in the Service Delivery Automation Industry, consider subscribing to industry newsletters, following relevant companies and organizations, or regularly checking reputable industry news sources and publications.
Methodology
Step 1 - Identification of Relevant Samples Size from Population Database


Step 2 - Approaches for Defining Global Market Size (Value, Volume* & Price*)

Note*: In applicable scenarios
Step 3 - Data Sources
Primary Research
- Web Analytics
- Survey Reports
- Research Institute
- Latest Research Reports
- Opinion Leaders
Secondary Research
- Annual Reports
- White Paper
- Latest Press Release
- Industry Association
- Paid Database
- Investor Presentations

Step 4 - Data Triangulation
Involves using different sources of information in order to increase the validity of a study
These sources are likely to be stakeholders in a program - participants, other researchers, program staff, other community members, and so on.
Then we put all data in single framework & apply various statistical tools to find out the dynamic on the market.
During the analysis stage, feedback from the stakeholder groups would be compared to determine areas of agreement as well as areas of divergence