

Key Insights
The US Hazardous Location LED Lighting market is poised for significant expansion, driven by increasing industrialization and stringent safety regulations. With a projected market size of approximately $1.5 billion in 2025 and a Compound Annual Growth Rate (CAGR) of 9.10% through 2033, the demand for advanced, explosion-proof LED lighting solutions is robust. Key growth drivers include the escalating need for enhanced workplace safety in volatile environments such as oil and gas, petrochemical, and manufacturing sectors. The transition from traditional lighting to energy-efficient and durable LED technology, particularly in hazardous zones (Zone 0, 20, 1, 21, 22), is a primary catalyst. Furthermore, the adoption of smart lighting features, including remote monitoring and diagnostics, is gaining traction, offering improved operational efficiency and reduced maintenance costs. Emerging trends like the development of highly specialized lighting for niche applications and the integration of IoT capabilities within hazardous location fixtures are expected to further propel market growth.
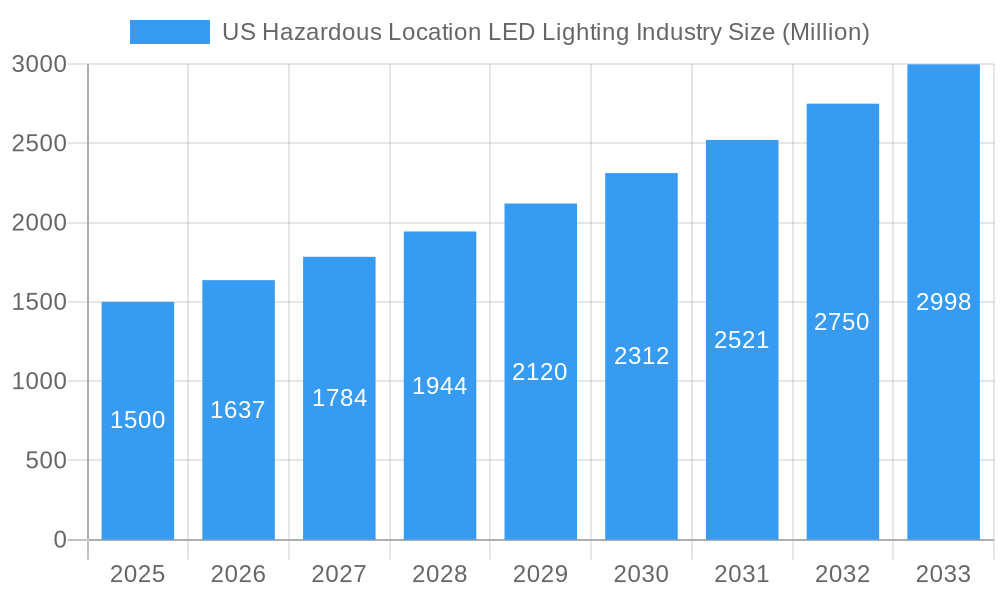
US Hazardous Location LED Lighting Industry Market Size (In Billion)
Despite this promising outlook, certain restraints may temper rapid expansion. The initial high cost of sophisticated hazardous location LED fixtures compared to conventional lighting can be a barrier for some smaller enterprises. Additionally, complex installation procedures and the need for specialized training for maintenance personnel in these sensitive environments can add to the overall investment. However, the long-term benefits of reduced energy consumption, extended lifespan, and superior illumination quality offered by LED technology are increasingly outweighing these initial challenges. The market is characterized by a competitive landscape with established players like GE Current, Eaton Corporation, and Emerson Electric Co., alongside innovative entrants focusing on specialized solutions. North America, particularly the United States, is a dominant region due to its extensive industrial base and strict adherence to safety standards, making it a crucial market for hazardous location LED lighting solutions.
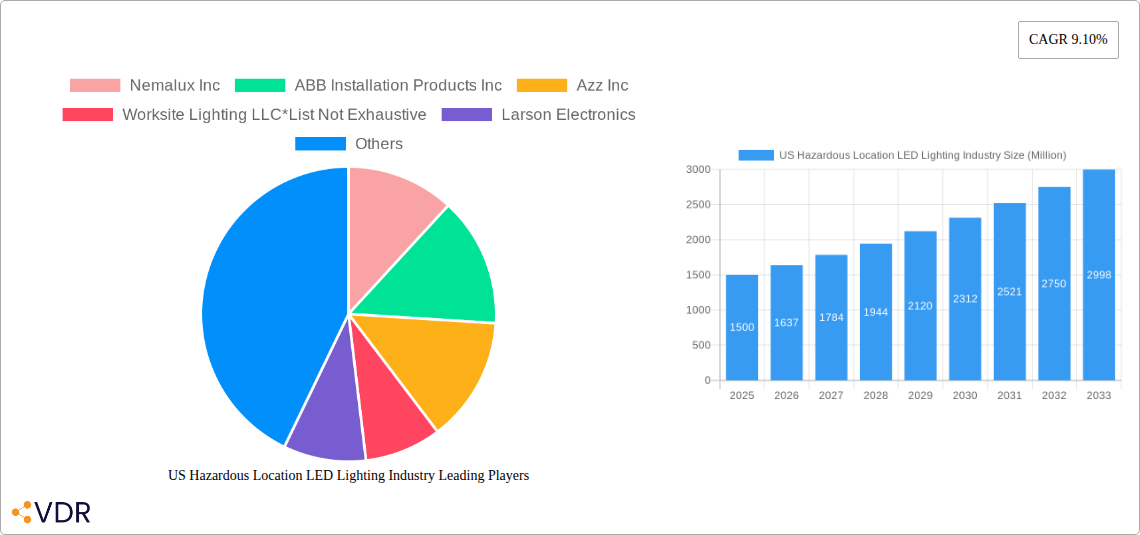
US Hazardous Location LED Lighting Industry Company Market Share
US Hazardous Location LED Lighting Industry Market Dynamics & Structure
The US Hazardous Location LED Lighting Industry is characterized by a moderate market concentration, with key players actively innovating and consolidating their positions. Technological advancements in LED efficiency, durability, and intelligent control systems are primary innovation drivers, directly impacting the adoption of specialized lighting solutions in environments posing fire or explosion risks. Stringent regulatory frameworks, including ATEX and NEC classifications for Zone 0, Zone 20, Zone 1, Zone 21, and Zone 22, mandate the use of certified lighting, fostering demand for compliant products. Competitive product substitutes, though diminishing with LED advancements, include traditional HID and fluorescent lighting, but these fall short in energy efficiency and lifespan. End-user demographics span critical sectors such as Oil and Gas, Petro Chemical, Industrial, Power Generation, Pharmaceutical, and Processing, each with unique safety and operational requirements. Mergers and acquisitions (M&A) trends, such as the integration of Digital Lumens Inc. (OSRAM) into broader portfolios, signal a strategic push for comprehensive solution offerings. The market is poised for growth, driven by safety upgrades and the increasing demand for energy-efficient, long-lasting lighting in hazardous environments.
- Market Concentration: A dynamic landscape with established leaders and emerging innovators.
- Technological Innovation Drivers: Enhanced lumen output, improved thermal management, smart lighting controls, and extended lifespan.
- Regulatory Frameworks: ATEX, NEC, IECEx certifications are crucial for market entry and product acceptance across all zones.
- Competitive Product Substitutes: While LED dominates, legacy technologies are gradually being phased out.
- End-User Verticals: Strong demand from Oil & Gas and Petrochemical sectors, with growing adoption in Industrial and Pharmaceutical.
- M&A Trends: Consolidation to gain market share and expand product portfolios for integrated hazardous location solutions.
US Hazardous Location LED Lighting Industry Growth Trends & Insights
The US Hazardous Location LED Lighting Industry is projected to experience robust growth over the forecast period, fueled by an escalating emphasis on workplace safety and operational efficiency across various hazardous environments. The market is anticipated to witness a Compound Annual Growth Rate (CAGR) of approximately 7.5% from 2025 to 2033, driven by the inherent advantages of LED technology, including superior energy efficiency, extended lifespan, and reduced maintenance requirements compared to traditional lighting solutions. The adoption rates for LED hazardous location lighting are steadily increasing, particularly within the Oil and Gas and Petrochemical industries, where strict safety regulations and the potential for catastrophic incidents necessitate the highest standards of illumination. Technological disruptions, such as the integration of IoT capabilities for remote monitoring and predictive maintenance, are further accelerating market penetration. Consumer behavior shifts are evident, with end-users increasingly prioritizing total cost of ownership, which includes energy savings and reduced downtime, over initial purchase price. The increasing number of certifications for new Zone 0 and Zone 1 applications signifies a maturing market and a growing willingness to invest in the most advanced safety technologies. Furthermore, the shift towards a more sustainable and energy-conscious industrial landscape directly benefits the adoption of LED lighting, which offers a significantly lower carbon footprint.
The market size for US Hazardous Location LED Lighting is expected to expand from an estimated $1.8 billion in 2025 to over $3.2 billion by 2033, reflecting this sustained growth trajectory. This expansion is not solely driven by new installations but also by the significant retrofitting market, as older facilities upgrade their lighting infrastructure to meet current safety codes and leverage energy-saving benefits. The market penetration of LED technology in hazardous locations is currently estimated at around 55% and is projected to reach over 85% by the end of the forecast period, highlighting its dominance. The increasing complexity of industrial processes and the development of new hazardous material handling techniques will also necessitate the deployment of specialized LED lighting solutions designed for specific environmental challenges. The ongoing digitalization of industrial operations is creating further demand for intelligent lighting systems that can seamlessly integrate with broader control and monitoring networks, enhancing overall operational awareness and safety protocols.
Dominant Regions, Countries, or Segments in US Hazardous Location LED Lighting Industry
The US Hazardous Location LED Lighting Industry's dominance is significantly shaped by the Oil and Gas end-user vertical, coupled with robust activity in the Petro Chemical and Industrial sectors. These segments, particularly when employing lighting for Zone 1 and Zone 2 environments, represent the largest share of market demand due to the inherent risks associated with flammable materials and explosive atmospheres. The Oil and Gas sector, encompassing upstream exploration and production, midstream transportation, and downstream refining, consistently requires high-performance, reliable LED lighting that can withstand extreme temperatures, corrosive substances, and potential ignition sources. Similarly, Petro Chemical facilities, dealing with a wide array of volatile chemicals, depend on certified lighting solutions to prevent accidents and ensure operational continuity. The broader Industrial segment, including manufacturing plants, chemical processing, and heavy machinery operations, also presents substantial opportunities, especially in areas requiring explosion-proof and dust-tight enclosures.
The geographical concentration of these dominant end-user verticals within the United States heavily influences regional market leadership. States with a significant presence of oil refineries, petrochemical plants, and heavy industrial manufacturing, such as Texas, Louisiana, Oklahoma, and parts of the Gulf Coast, emerge as key demand centers. Within these regions, the demand for lighting solutions for Zone 1 applications is particularly high, as these zones represent areas where an explosive atmosphere is likely to occur in normal operation. This translates into a substantial market share for manufacturers and suppliers capable of meeting the rigorous certification and performance standards required for such critical environments. The ongoing infrastructure development and modernization efforts within these sectors further stimulate demand.
The growth potential in these dominant segments is further amplified by evolving regulatory landscapes and a proactive approach to safety. Companies are increasingly investing in advanced LED lighting not just for compliance but as a strategic imperative to enhance productivity, reduce downtime, and mitigate risks. The specific requirements for Zone 21 and Zone 22 applications, while often associated with combustible dust, are also experiencing significant growth within the broader industrial and processing sectors, indicating a widening scope of hazardous location lighting adoption. The market share within these segments is substantial, with the Oil and Gas and Petro Chemical verticals alone accounting for an estimated 45% of the total US Hazardous Location LED Lighting market in 2025. The projected CAGR for these segments over the forecast period is expected to remain strong, driven by ongoing technological integration and the continuous need for enhanced safety measures.
- Dominant End-User Vertical: Oil and Gas, Petro Chemical, and Industrial sectors drive significant demand.
- Key Device Types: Zone 1 and Zone 2 applications are primary drivers of market share due to inherent risks.
- Geographical Concentration: States with extensive Oil & Gas and Petrochemical infrastructure lead demand.
- Market Share: Oil and Gas and Petrochemical sectors collectively account for an estimated 45% of the market in 2025.
- Growth Potential: Driven by regulatory compliance, safety upgrades, and technological advancements.
US Hazardous Location LED Lighting Industry Product Landscape
The product landscape of the US Hazardous Location LED Lighting Industry is defined by advanced LED luminaires engineered for extreme conditions. Innovations focus on enhanced lumen output, superior thermal management to prevent overheating in confined spaces, and robust construction using materials like stainless steel and high-grade aluminum alloys to resist corrosion and impact. Unique selling propositions include extended operational lifespans of up to 50,000 hours, significant energy savings, and specialized optics for optimized light distribution in challenging environments. Technological advancements are also integrating smart features such as wireless controls, dimming capabilities, and fault detection, enabling proactive maintenance and operational efficiency. These products are crucial for ensuring safety and productivity in Zone 0, Zone 20, Zone 1, Zone 21, and Zone 22 classifications across industries like Oil and Gas, Petro Chemical, and Power Generation.
Key Drivers, Barriers & Challenges in US Hazardous Location LED Lighting Industry
Key Drivers: The US Hazardous Location LED Lighting Industry is propelled by a confluence of critical factors. A primary driver is the unwavering focus on workplace safety and regulatory compliance, as stringent standards for hazardous environments necessitate the adoption of certified LED lighting. The energy efficiency and long operational lifespan of LED technology offer significant cost savings in terms of energy consumption and reduced maintenance, making it an attractive investment for end-users. Furthermore, technological advancements in LED performance, durability, and intelligent control systems continuously improve the value proposition. Growing awareness of environmental sustainability also favors LED adoption due to its lower energy footprint.
Barriers & Challenges: Despite the positive outlook, the industry faces notable barriers and challenges. The high initial cost of certified hazardous location LED lighting can be a deterrent for some organizations, particularly smaller enterprises. Complex certification processes can lead to longer lead times for product development and market entry. Supply chain disruptions and volatile raw material prices can impact product availability and cost-effectiveness. Additionally, a lack of skilled personnel for installation and maintenance of specialized LED systems can pose a challenge. Finally, fierce competition among established players and new entrants puts pressure on pricing and profit margins.
Emerging Opportunities in US Hazardous Location LED Lighting Industry
Emerging opportunities within the US Hazardous Location LED Lighting Industry lie in the increasing demand for smart and connected lighting solutions. The integration of IoT capabilities allows for remote monitoring, predictive maintenance, and data analytics, enhancing operational efficiency and safety in hazardous zones. The expansion of new applications in emerging industrial sectors, such as advanced manufacturing and specialized chemical processing, presents untapped market potential. Furthermore, the growing emphasis on sustainable practices and the circular economy is creating opportunities for eco-friendly product designs and advanced recycling initiatives. Growing demand for specialized lighting in remote and challenging environments like offshore oil rigs and underground mining operations also offers significant growth avenues.
Growth Accelerators in the US Hazardous Location LED Lighting Industry Industry
Several catalysts are accelerating the long-term growth of the US Hazardous Location LED Lighting Industry. Continuous innovation in LED technology, leading to higher efficacy, improved color rendering, and enhanced resilience to extreme conditions, is a key accelerator. Strategic partnerships and collaborations between lighting manufacturers and end-users, as well as technology providers, are fostering the development of tailored solutions and expanding market reach. Government incentives and stricter enforcement of safety regulations worldwide are also driving the adoption of advanced lighting systems. Furthermore, the global trend towards industrial automation and digitalization is creating demand for intelligent lighting that can integrate seamlessly with other operational technologies, thereby enhancing overall safety and productivity.
Key Players Shaping the US Hazardous Location LED Lighting Industry Market
- Nemalux Inc
- ABB Installation Products Inc
- Azz Inc
- Worksite Lighting LLC
- Larson Electronics
- GE Current
- Hubbell Limited
- Emerson Electric Co
- Digital Lumens Inc (OSRAM)
- Eaton Corporation
Notable Milestones in US Hazardous Location LED Lighting Industry Sector
- 2019: Increased adoption of ATEX-certified LED fixtures for Zone 0 and Zone 20 applications, reflecting stricter safety standards.
- 2020: Major players like Eaton Corporation and GE Current launched new series of high-efficiency, rugged LED luminaires for demanding industrial environments.
- 2021: ABB Installation Products Inc. expanded its portfolio with advanced hazardous location lighting solutions, emphasizing IoT integration.
- 2022: Nemalux Inc. focused on developing specialized LED lighting for extreme temperature applications in Oil and Gas.
- 2023: Increased M&A activity, with acquisitions aimed at consolidating market share and expanding product offerings for hazardous locations.
- 2024: Growth in demand for explosion-proof lighting in pharmaceutical manufacturing and food processing industries, including Zone 21 and Zone 22 applications.
In-Depth US Hazardous Location LED Lighting Industry Market Outlook
The US Hazardous Location LED Lighting Industry is poised for sustained and significant growth, driven by the persistent emphasis on safety, operational efficiency, and technological evolution. Growth accelerators such as continuous LED innovation, strategic market collaborations, and supportive regulatory environments will underpin this expansion. The industry's future potential lies in the widespread adoption of smart lighting systems capable of real-time monitoring and predictive analytics, further enhancing safety protocols and reducing downtime. As industries continue to prioritize investments in robust infrastructure that minimizes risk and optimizes performance, the demand for high-quality, certified hazardous location LED lighting solutions is expected to remain strong. Strategic opportunities for market players include focusing on specialized applications, expanding into underserved niches within the industrial sector, and developing integrated solutions that offer added value beyond basic illumination.
US Hazardous Location LED Lighting Industry Segmentation
-
1. Device Type
- 1.1. Zone 0
- 1.2. Zone 20
- 1.3. Zone 1
- 1.4. Zone 21
- 1.5. Zone 22
-
2. End-User Vertical
- 2.1. Oil and Gas
- 2.2. Petro Chemical
- 2.3. Industrial
- 2.4. Power Generation
- 2.5. Pharmaceutical
- 2.6. Processing
- 2.7. Other End-user Industries
US Hazardous Location LED Lighting Industry Segmentation By Geography
-
1. North America
- 1.1. United States
- 1.2. Canada
- 1.3. Mexico
-
2. South America
- 2.1. Brazil
- 2.2. Argentina
- 2.3. Rest of South America
-
3. Europe
- 3.1. United Kingdom
- 3.2. Germany
- 3.3. France
- 3.4. Italy
- 3.5. Spain
- 3.6. Russia
- 3.7. Benelux
- 3.8. Nordics
- 3.9. Rest of Europe
-
4. Middle East & Africa
- 4.1. Turkey
- 4.2. Israel
- 4.3. GCC
- 4.4. North Africa
- 4.5. South Africa
- 4.6. Rest of Middle East & Africa
-
5. Asia Pacific
- 5.1. China
- 5.2. India
- 5.3. Japan
- 5.4. South Korea
- 5.5. ASEAN
- 5.6. Oceania
- 5.7. Rest of Asia Pacific
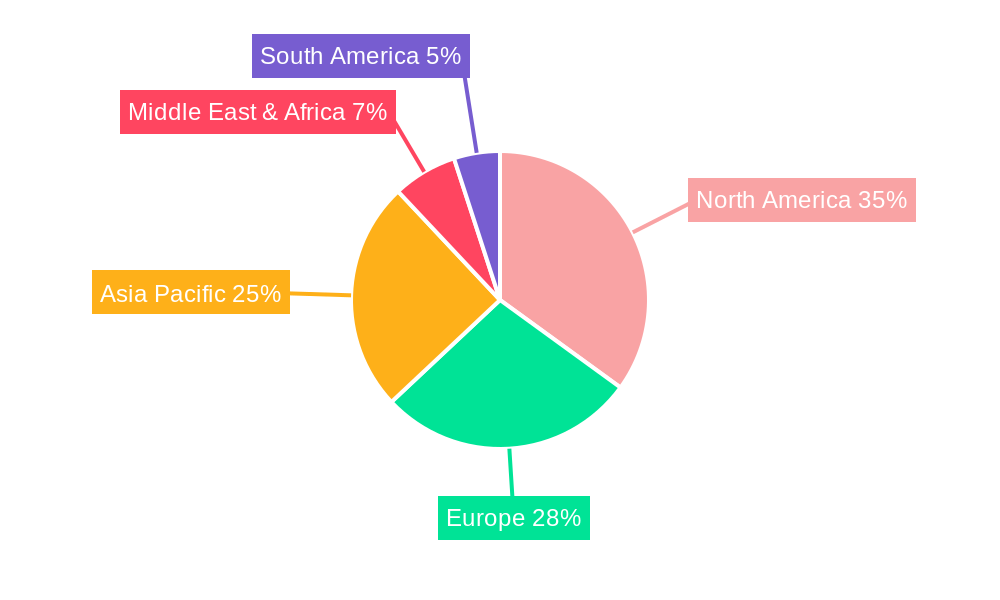
US Hazardous Location LED Lighting Industry Regional Market Share
Geographic Coverage of US Hazardous Location LED Lighting Industry
US Hazardous Location LED Lighting Industry REPORT HIGHLIGHTS
| Aspects | Details |
|---|---|
| Study Period | 2020-2034 |
| Base Year | 2025 |
| Estimated Year | 2026 |
| Forecast Period | 2026-2034 |
| Historical Period | 2020-2025 |
| Growth Rate | CAGR of 8% from 2020-2034 |
| Segmentation |
|
Table of Contents
- 1. Introduction
- 1.1. Research Scope
- 1.2. Market Segmentation
- 1.3. Research Objective
- 1.4. Definitions and Assumptions
- 2. Executive Summary
- 2.1. Market Snapshot
- 3. Market Dynamics
- 3.1. Market Drivers
- 3.2. Market Restrains
- 3.3. Market Trends
- 3.4. Market Opportunities
- 4. Market Factor Analysis
- 4.1. Porters Five Forces
- 4.1.1. Bargaining Power of Suppliers
- 4.1.2. Bargaining Power of Buyers
- 4.1.3. Threat of New Entrants
- 4.1.4. Threat of Substitutes
- 4.1.5. Competitive Rivalry
- 4.2. PESTEL analysis
- 4.3. BCG Analysis
- 4.3.1. Stars (High Growth, High Market Share)
- 4.3.2. Cash Cows (Low Growth, High Market Share)
- 4.3.3. Question Mark (High Growth, Low Market Share)
- 4.3.4. Dogs (Low Growth, Low Market Share)
- 4.4. Ansoff Matrix Analysis
- 4.5. Supply Chain Analysis
- 4.6. Regulatory Landscape
- 4.7. Current Market Potential and Opportunity Assessment (TAM–SAM–SOM Framework)
- 4.8. VDR Analyst Note
- 4.1. Porters Five Forces
- 5. Market Analysis, Insights and Forecast 2021-2033
- 5.1. Market Analysis, Insights and Forecast - by Device Type
- 5.1.1. Zone 0
- 5.1.2. Zone 20
- 5.1.3. Zone 1
- 5.1.4. Zone 21
- 5.1.5. Zone 22
- 5.2. Market Analysis, Insights and Forecast - by End-User Vertical
- 5.2.1. Oil and Gas
- 5.2.2. Petro Chemical
- 5.2.3. Industrial
- 5.2.4. Power Generation
- 5.2.5. Pharmaceutical
- 5.2.6. Processing
- 5.2.7. Other End-user Industries
- 5.3. Market Analysis, Insights and Forecast - by Region
- 5.3.1. North America
- 5.3.2. South America
- 5.3.3. Europe
- 5.3.4. Middle East & Africa
- 5.3.5. Asia Pacific
- 5.1. Market Analysis, Insights and Forecast - by Device Type
- 6. Global US Hazardous Location LED Lighting Industry Analysis, Insights and Forecast, 2021-2033
- 6.1. Market Analysis, Insights and Forecast - by Device Type
- 6.1.1. Zone 0
- 6.1.2. Zone 20
- 6.1.3. Zone 1
- 6.1.4. Zone 21
- 6.1.5. Zone 22
- 6.2. Market Analysis, Insights and Forecast - by End-User Vertical
- 6.2.1. Oil and Gas
- 6.2.2. Petro Chemical
- 6.2.3. Industrial
- 6.2.4. Power Generation
- 6.2.5. Pharmaceutical
- 6.2.6. Processing
- 6.2.7. Other End-user Industries
- 6.1. Market Analysis, Insights and Forecast - by Device Type
- 7. North America US Hazardous Location LED Lighting Industry Analysis, Insights and Forecast, 2021-2033
- 7.1. Market Analysis, Insights and Forecast - by Device Type
- 7.1.1. Zone 0
- 7.1.2. Zone 20
- 7.1.3. Zone 1
- 7.1.4. Zone 21
- 7.1.5. Zone 22
- 7.2. Market Analysis, Insights and Forecast - by End-User Vertical
- 7.2.1. Oil and Gas
- 7.2.2. Petro Chemical
- 7.2.3. Industrial
- 7.2.4. Power Generation
- 7.2.5. Pharmaceutical
- 7.2.6. Processing
- 7.2.7. Other End-user Industries
- 7.1. Market Analysis, Insights and Forecast - by Device Type
- 8. South America US Hazardous Location LED Lighting Industry Analysis, Insights and Forecast, 2021-2033
- 8.1. Market Analysis, Insights and Forecast - by Device Type
- 8.1.1. Zone 0
- 8.1.2. Zone 20
- 8.1.3. Zone 1
- 8.1.4. Zone 21
- 8.1.5. Zone 22
- 8.2. Market Analysis, Insights and Forecast - by End-User Vertical
- 8.2.1. Oil and Gas
- 8.2.2. Petro Chemical
- 8.2.3. Industrial
- 8.2.4. Power Generation
- 8.2.5. Pharmaceutical
- 8.2.6. Processing
- 8.2.7. Other End-user Industries
- 8.1. Market Analysis, Insights and Forecast - by Device Type
- 9. Europe US Hazardous Location LED Lighting Industry Analysis, Insights and Forecast, 2021-2033
- 9.1. Market Analysis, Insights and Forecast - by Device Type
- 9.1.1. Zone 0
- 9.1.2. Zone 20
- 9.1.3. Zone 1
- 9.1.4. Zone 21
- 9.1.5. Zone 22
- 9.2. Market Analysis, Insights and Forecast - by End-User Vertical
- 9.2.1. Oil and Gas
- 9.2.2. Petro Chemical
- 9.2.3. Industrial
- 9.2.4. Power Generation
- 9.2.5. Pharmaceutical
- 9.2.6. Processing
- 9.2.7. Other End-user Industries
- 9.1. Market Analysis, Insights and Forecast - by Device Type
- 10. Middle East & Africa US Hazardous Location LED Lighting Industry Analysis, Insights and Forecast, 2021-2033
- 10.1. Market Analysis, Insights and Forecast - by Device Type
- 10.1.1. Zone 0
- 10.1.2. Zone 20
- 10.1.3. Zone 1
- 10.1.4. Zone 21
- 10.1.5. Zone 22
- 10.2. Market Analysis, Insights and Forecast - by End-User Vertical
- 10.2.1. Oil and Gas
- 10.2.2. Petro Chemical
- 10.2.3. Industrial
- 10.2.4. Power Generation
- 10.2.5. Pharmaceutical
- 10.2.6. Processing
- 10.2.7. Other End-user Industries
- 10.1. Market Analysis, Insights and Forecast - by Device Type
- 11. Asia Pacific US Hazardous Location LED Lighting Industry Analysis, Insights and Forecast, 2021-2033
- 11.1. Market Analysis, Insights and Forecast - by Device Type
- 11.1.1. Zone 0
- 11.1.2. Zone 20
- 11.1.3. Zone 1
- 11.1.4. Zone 21
- 11.1.5. Zone 22
- 11.2. Market Analysis, Insights and Forecast - by End-User Vertical
- 11.2.1. Oil and Gas
- 11.2.2. Petro Chemical
- 11.2.3. Industrial
- 11.2.4. Power Generation
- 11.2.5. Pharmaceutical
- 11.2.6. Processing
- 11.2.7. Other End-user Industries
- 11.1. Market Analysis, Insights and Forecast - by Device Type
- 12. Competitive Analysis
- 12.1. Company Profiles
- 12.1.1 Nemalux Inc
- 12.1.1.1. Company Overview
- 12.1.1.2. Products
- 12.1.1.3. Company Financials
- 12.1.1.4. SWOT Analysis
- 12.1.2 ABB Installation Products Inc
- 12.1.2.1. Company Overview
- 12.1.2.2. Products
- 12.1.2.3. Company Financials
- 12.1.2.4. SWOT Analysis
- 12.1.3 Azz Inc
- 12.1.3.1. Company Overview
- 12.1.3.2. Products
- 12.1.3.3. Company Financials
- 12.1.3.4. SWOT Analysis
- 12.1.4 Worksite Lighting LLC*List Not Exhaustive
- 12.1.4.1. Company Overview
- 12.1.4.2. Products
- 12.1.4.3. Company Financials
- 12.1.4.4. SWOT Analysis
- 12.1.5 Larson Electronics
- 12.1.5.1. Company Overview
- 12.1.5.2. Products
- 12.1.5.3. Company Financials
- 12.1.5.4. SWOT Analysis
- 12.1.6 GE Current
- 12.1.6.1. Company Overview
- 12.1.6.2. Products
- 12.1.6.3. Company Financials
- 12.1.6.4. SWOT Analysis
- 12.1.7 Hubbell Limited
- 12.1.7.1. Company Overview
- 12.1.7.2. Products
- 12.1.7.3. Company Financials
- 12.1.7.4. SWOT Analysis
- 12.1.8 Emerson Electric Co
- 12.1.8.1. Company Overview
- 12.1.8.2. Products
- 12.1.8.3. Company Financials
- 12.1.8.4. SWOT Analysis
- 12.1.9 Digital Lumens Inc (OSRAM)
- 12.1.9.1. Company Overview
- 12.1.9.2. Products
- 12.1.9.3. Company Financials
- 12.1.9.4. SWOT Analysis
- 12.1.10 Eaton Corporation
- 12.1.10.1. Company Overview
- 12.1.10.2. Products
- 12.1.10.3. Company Financials
- 12.1.10.4. SWOT Analysis
- 12.1.1 Nemalux Inc
- 12.2. Market Entropy
- 12.2.1 Company's Key Areas Served
- 12.2.2 Recent Developments
- 12.3. Company Market Share Analysis 2025
- 12.3.1 Top 5 Companies Market Share Analysis
- 12.3.2 Top 3 Companies Market Share Analysis
- 12.4. List of Potential Customers
- 13. Research Methodology
List of Figures
- Figure 1: Global US Hazardous Location LED Lighting Industry Revenue Breakdown (undefined, %) by Region 2025 & 2033
- Figure 2: North America US Hazardous Location LED Lighting Industry Revenue (undefined), by Device Type 2025 & 2033
- Figure 3: North America US Hazardous Location LED Lighting Industry Revenue Share (%), by Device Type 2025 & 2033
- Figure 4: North America US Hazardous Location LED Lighting Industry Revenue (undefined), by End-User Vertical 2025 & 2033
- Figure 5: North America US Hazardous Location LED Lighting Industry Revenue Share (%), by End-User Vertical 2025 & 2033
- Figure 6: North America US Hazardous Location LED Lighting Industry Revenue (undefined), by Country 2025 & 2033
- Figure 7: North America US Hazardous Location LED Lighting Industry Revenue Share (%), by Country 2025 & 2033
- Figure 8: South America US Hazardous Location LED Lighting Industry Revenue (undefined), by Device Type 2025 & 2033
- Figure 9: South America US Hazardous Location LED Lighting Industry Revenue Share (%), by Device Type 2025 & 2033
- Figure 10: South America US Hazardous Location LED Lighting Industry Revenue (undefined), by End-User Vertical 2025 & 2033
- Figure 11: South America US Hazardous Location LED Lighting Industry Revenue Share (%), by End-User Vertical 2025 & 2033
- Figure 12: South America US Hazardous Location LED Lighting Industry Revenue (undefined), by Country 2025 & 2033
- Figure 13: South America US Hazardous Location LED Lighting Industry Revenue Share (%), by Country 2025 & 2033
- Figure 14: Europe US Hazardous Location LED Lighting Industry Revenue (undefined), by Device Type 2025 & 2033
- Figure 15: Europe US Hazardous Location LED Lighting Industry Revenue Share (%), by Device Type 2025 & 2033
- Figure 16: Europe US Hazardous Location LED Lighting Industry Revenue (undefined), by End-User Vertical 2025 & 2033
- Figure 17: Europe US Hazardous Location LED Lighting Industry Revenue Share (%), by End-User Vertical 2025 & 2033
- Figure 18: Europe US Hazardous Location LED Lighting Industry Revenue (undefined), by Country 2025 & 2033
- Figure 19: Europe US Hazardous Location LED Lighting Industry Revenue Share (%), by Country 2025 & 2033
- Figure 20: Middle East & Africa US Hazardous Location LED Lighting Industry Revenue (undefined), by Device Type 2025 & 2033
- Figure 21: Middle East & Africa US Hazardous Location LED Lighting Industry Revenue Share (%), by Device Type 2025 & 2033
- Figure 22: Middle East & Africa US Hazardous Location LED Lighting Industry Revenue (undefined), by End-User Vertical 2025 & 2033
- Figure 23: Middle East & Africa US Hazardous Location LED Lighting Industry Revenue Share (%), by End-User Vertical 2025 & 2033
- Figure 24: Middle East & Africa US Hazardous Location LED Lighting Industry Revenue (undefined), by Country 2025 & 2033
- Figure 25: Middle East & Africa US Hazardous Location LED Lighting Industry Revenue Share (%), by Country 2025 & 2033
- Figure 26: Asia Pacific US Hazardous Location LED Lighting Industry Revenue (undefined), by Device Type 2025 & 2033
- Figure 27: Asia Pacific US Hazardous Location LED Lighting Industry Revenue Share (%), by Device Type 2025 & 2033
- Figure 28: Asia Pacific US Hazardous Location LED Lighting Industry Revenue (undefined), by End-User Vertical 2025 & 2033
- Figure 29: Asia Pacific US Hazardous Location LED Lighting Industry Revenue Share (%), by End-User Vertical 2025 & 2033
- Figure 30: Asia Pacific US Hazardous Location LED Lighting Industry Revenue (undefined), by Country 2025 & 2033
- Figure 31: Asia Pacific US Hazardous Location LED Lighting Industry Revenue Share (%), by Country 2025 & 2033
List of Tables
- Table 1: Global US Hazardous Location LED Lighting Industry Revenue undefined Forecast, by Device Type 2020 & 2033
- Table 2: Global US Hazardous Location LED Lighting Industry Revenue undefined Forecast, by End-User Vertical 2020 & 2033
- Table 3: Global US Hazardous Location LED Lighting Industry Revenue undefined Forecast, by Region 2020 & 2033
- Table 4: Global US Hazardous Location LED Lighting Industry Revenue undefined Forecast, by Device Type 2020 & 2033
- Table 5: Global US Hazardous Location LED Lighting Industry Revenue undefined Forecast, by End-User Vertical 2020 & 2033
- Table 6: Global US Hazardous Location LED Lighting Industry Revenue undefined Forecast, by Country 2020 & 2033
- Table 7: United States US Hazardous Location LED Lighting Industry Revenue (undefined) Forecast, by Application 2020 & 2033
- Table 8: Canada US Hazardous Location LED Lighting Industry Revenue (undefined) Forecast, by Application 2020 & 2033
- Table 9: Mexico US Hazardous Location LED Lighting Industry Revenue (undefined) Forecast, by Application 2020 & 2033
- Table 10: Global US Hazardous Location LED Lighting Industry Revenue undefined Forecast, by Device Type 2020 & 2033
- Table 11: Global US Hazardous Location LED Lighting Industry Revenue undefined Forecast, by End-User Vertical 2020 & 2033
- Table 12: Global US Hazardous Location LED Lighting Industry Revenue undefined Forecast, by Country 2020 & 2033
- Table 13: Brazil US Hazardous Location LED Lighting Industry Revenue (undefined) Forecast, by Application 2020 & 2033
- Table 14: Argentina US Hazardous Location LED Lighting Industry Revenue (undefined) Forecast, by Application 2020 & 2033
- Table 15: Rest of South America US Hazardous Location LED Lighting Industry Revenue (undefined) Forecast, by Application 2020 & 2033
- Table 16: Global US Hazardous Location LED Lighting Industry Revenue undefined Forecast, by Device Type 2020 & 2033
- Table 17: Global US Hazardous Location LED Lighting Industry Revenue undefined Forecast, by End-User Vertical 2020 & 2033
- Table 18: Global US Hazardous Location LED Lighting Industry Revenue undefined Forecast, by Country 2020 & 2033
- Table 19: United Kingdom US Hazardous Location LED Lighting Industry Revenue (undefined) Forecast, by Application 2020 & 2033
- Table 20: Germany US Hazardous Location LED Lighting Industry Revenue (undefined) Forecast, by Application 2020 & 2033
- Table 21: France US Hazardous Location LED Lighting Industry Revenue (undefined) Forecast, by Application 2020 & 2033
- Table 22: Italy US Hazardous Location LED Lighting Industry Revenue (undefined) Forecast, by Application 2020 & 2033
- Table 23: Spain US Hazardous Location LED Lighting Industry Revenue (undefined) Forecast, by Application 2020 & 2033
- Table 24: Russia US Hazardous Location LED Lighting Industry Revenue (undefined) Forecast, by Application 2020 & 2033
- Table 25: Benelux US Hazardous Location LED Lighting Industry Revenue (undefined) Forecast, by Application 2020 & 2033
- Table 26: Nordics US Hazardous Location LED Lighting Industry Revenue (undefined) Forecast, by Application 2020 & 2033
- Table 27: Rest of Europe US Hazardous Location LED Lighting Industry Revenue (undefined) Forecast, by Application 2020 & 2033
- Table 28: Global US Hazardous Location LED Lighting Industry Revenue undefined Forecast, by Device Type 2020 & 2033
- Table 29: Global US Hazardous Location LED Lighting Industry Revenue undefined Forecast, by End-User Vertical 2020 & 2033
- Table 30: Global US Hazardous Location LED Lighting Industry Revenue undefined Forecast, by Country 2020 & 2033
- Table 31: Turkey US Hazardous Location LED Lighting Industry Revenue (undefined) Forecast, by Application 2020 & 2033
- Table 32: Israel US Hazardous Location LED Lighting Industry Revenue (undefined) Forecast, by Application 2020 & 2033
- Table 33: GCC US Hazardous Location LED Lighting Industry Revenue (undefined) Forecast, by Application 2020 & 2033
- Table 34: North Africa US Hazardous Location LED Lighting Industry Revenue (undefined) Forecast, by Application 2020 & 2033
- Table 35: South Africa US Hazardous Location LED Lighting Industry Revenue (undefined) Forecast, by Application 2020 & 2033
- Table 36: Rest of Middle East & Africa US Hazardous Location LED Lighting Industry Revenue (undefined) Forecast, by Application 2020 & 2033
- Table 37: Global US Hazardous Location LED Lighting Industry Revenue undefined Forecast, by Device Type 2020 & 2033
- Table 38: Global US Hazardous Location LED Lighting Industry Revenue undefined Forecast, by End-User Vertical 2020 & 2033
- Table 39: Global US Hazardous Location LED Lighting Industry Revenue undefined Forecast, by Country 2020 & 2033
- Table 40: China US Hazardous Location LED Lighting Industry Revenue (undefined) Forecast, by Application 2020 & 2033
- Table 41: India US Hazardous Location LED Lighting Industry Revenue (undefined) Forecast, by Application 2020 & 2033
- Table 42: Japan US Hazardous Location LED Lighting Industry Revenue (undefined) Forecast, by Application 2020 & 2033
- Table 43: South Korea US Hazardous Location LED Lighting Industry Revenue (undefined) Forecast, by Application 2020 & 2033
- Table 44: ASEAN US Hazardous Location LED Lighting Industry Revenue (undefined) Forecast, by Application 2020 & 2033
- Table 45: Oceania US Hazardous Location LED Lighting Industry Revenue (undefined) Forecast, by Application 2020 & 2033
- Table 46: Rest of Asia Pacific US Hazardous Location LED Lighting Industry Revenue (undefined) Forecast, by Application 2020 & 2033
Frequently Asked Questions
1. What is the projected Compound Annual Growth Rate (CAGR) of the US Hazardous Location LED Lighting Industry?
The projected CAGR is approximately 8%.
2. Which companies are prominent players in the US Hazardous Location LED Lighting Industry?
Key companies in the market include Nemalux Inc, ABB Installation Products Inc, Azz Inc, Worksite Lighting LLC*List Not Exhaustive, Larson Electronics, GE Current, Hubbell Limited, Emerson Electric Co, Digital Lumens Inc (OSRAM), Eaton Corporation.
3. What are the main segments of the US Hazardous Location LED Lighting Industry?
The market segments include Device Type, End-User Vertical.
4. Can you provide details about the market size?
The market size is estimated to be USD XXX N/A as of 2022.
5. What are some drivers contributing to market growth?
; Regulations Promoting Proper Lighting for Worker Safety in Hazardous Locations; Rising Demand for Cost-effective and Energy-efficient LED Lighting Solution.
6. What are the notable trends driving market growth?
Increasing Demand for Low-Cost. Low-Energy LED Lighting Solutions.
7. Are there any restraints impacting market growth?
Security and Privacy Concerns Due To Communication Technology.
8. Can you provide examples of recent developments in the market?
N/A
9. What pricing options are available for accessing the report?
Pricing options include single-user, multi-user, and enterprise licenses priced at USD 3800, USD 4500, and USD 5800 respectively.
10. Is the market size provided in terms of value or volume?
The market size is provided in terms of value, measured in N/A.
11. Are there any specific market keywords associated with the report?
Yes, the market keyword associated with the report is "US Hazardous Location LED Lighting Industry," which aids in identifying and referencing the specific market segment covered.
12. How do I determine which pricing option suits my needs best?
The pricing options vary based on user requirements and access needs. Individual users may opt for single-user licenses, while businesses requiring broader access may choose multi-user or enterprise licenses for cost-effective access to the report.
13. Are there any additional resources or data provided in the US Hazardous Location LED Lighting Industry report?
While the report offers comprehensive insights, it's advisable to review the specific contents or supplementary materials provided to ascertain if additional resources or data are available.
14. How can I stay updated on further developments or reports in the US Hazardous Location LED Lighting Industry?
To stay informed about further developments, trends, and reports in the US Hazardous Location LED Lighting Industry, consider subscribing to industry newsletters, following relevant companies and organizations, or regularly checking reputable industry news sources and publications.
Methodology
Step 1 - Identification of Relevant Samples Size from Population Database


Step 2 - Approaches for Defining Global Market Size (Value, Volume* & Price*)

Note*: In applicable scenarios
Step 3 - Data Sources
Primary Research
- Web Analytics
- Survey Reports
- Research Institute
- Latest Research Reports
- Opinion Leaders
Secondary Research
- Annual Reports
- White Paper
- Latest Press Release
- Industry Association
- Paid Database
- Investor Presentations

Step 4 - Data Triangulation
Involves using different sources of information in order to increase the validity of a study
These sources are likely to be stakeholders in a program - participants, other researchers, program staff, other community members, and so on.
Then we put all data in single framework & apply various statistical tools to find out the dynamic on the market.
During the analysis stage, feedback from the stakeholder groups would be compared to determine areas of agreement as well as areas of divergence