

Key Insights
The Internet of Things (IoT) in the Energy Market is projected to expand significantly, reaching a market size of $21.1 billion by 2025. This robust growth is underpinned by a compound annual growth rate (CAGR) of 13.2%. Key catalysts include the escalating demand for enhanced energy efficiency, the critical need for improved grid management and reliability, and the accelerating adoption of renewable energy sources requiring intelligent monitoring. The widespread deployment of smart meters and advanced sensor technologies across the energy value chain is further accelerating this trend, enabling real-time data analytics for optimized operations and predictive maintenance. The energy sector is increasingly adopting IoT to reduce operational costs, minimize downtime, and bolster safety, contributing to a more sustainable energy future.
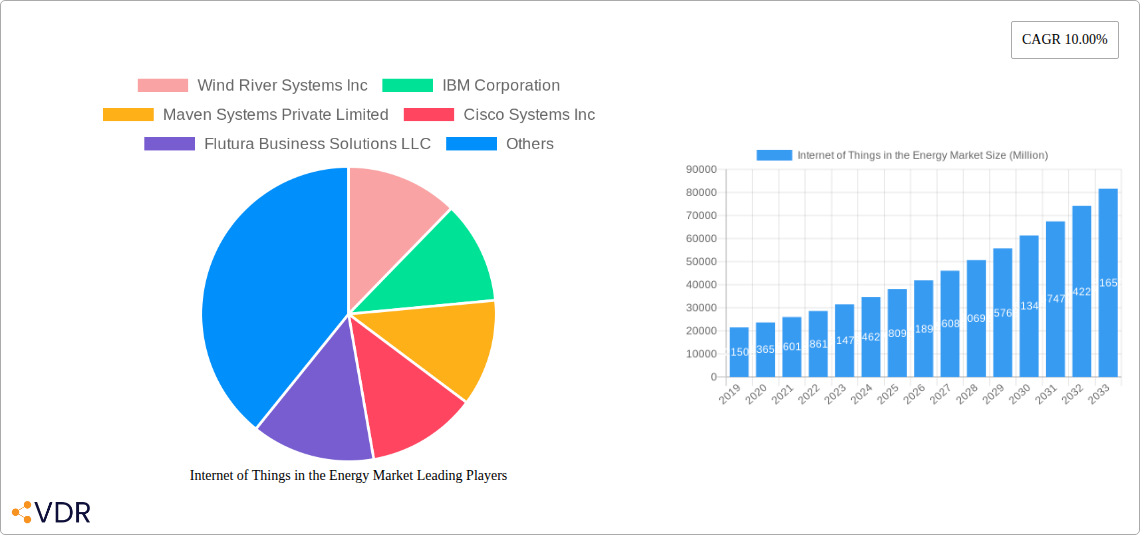
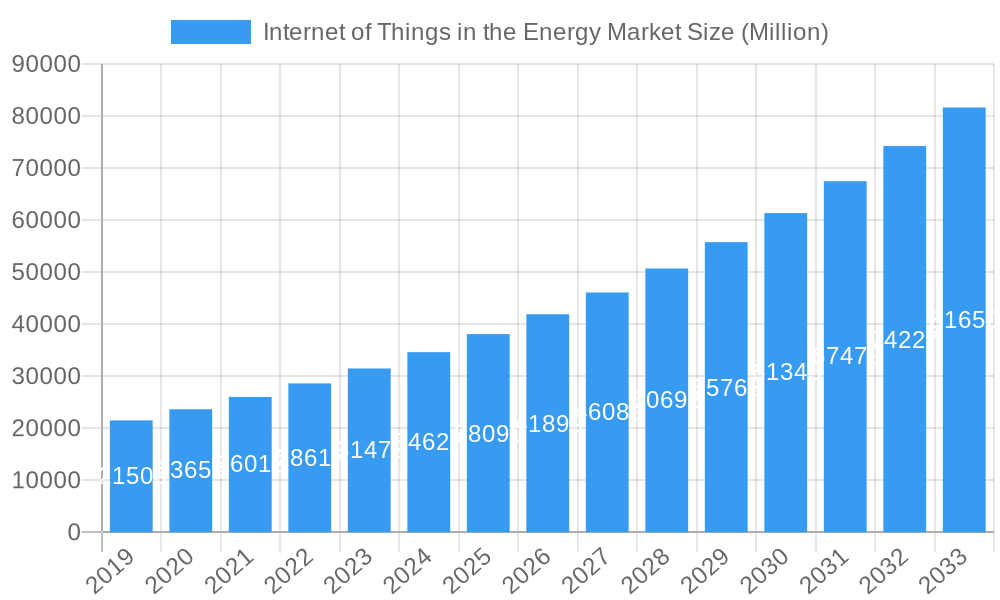
Internet of Things in the Energy Market Market Size (In Billion)
Dominant segments within this market include IoT platforms and services, crucial for seamless device integration and data analytics. Hardware, software, and security solutions are also integral to building a secure and comprehensive IoT ecosystem. Geographically, North America and Europe are expected to lead, driven by early adoption of smart grid technologies and significant infrastructure investments. However, the Asia Pacific region is poised for the most rapid expansion, fueled by industrialization, rising energy demand, and government-backed smart city initiatives. While data security concerns and initial investment costs present challenges, technological advancements and evolving regulations are mitigating these restraints, ensuring continued market growth.
Internet of Things in the Energy Market Company Market Share
Report Description: Internet of Things (IoT) in the Energy Market - Comprehensive 2025-2033 Outlook
Unlock critical insights into the rapidly evolving Internet of Things (IoT) in the Energy Market, a sector poised for unprecedented growth fueled by digital transformation and the demand for smarter, more sustainable energy solutions. This in-depth report delivers a meticulous analysis of the parent market and its key child markets, providing a 360-degree view of current trends, future projections, and strategic opportunities.
The IoT in the Energy Market is experiencing dynamic shifts driven by technological advancements and evolving industry needs. From Utilities modernizing grid infrastructure to Commercial Buildings optimizing energy consumption and Industrial Facilities enhancing operational efficiency, the adoption of IoT solutions is transforming how energy is generated, distributed, and consumed. This report covers the period from 2019–2033, with a detailed focus on the base year of 2025 and a robust forecast period of 2025–2033, building upon a comprehensive historical period of 2019–2024.
Our analysis delves into the intricate market structure, growth trajectories, dominant regions, product landscapes, and the key players shaping this vital sector. Understand the impact of IoT Software, IoT Platforms, IoT Hardware, IoT Security, and IoT Services as they converge to create intelligent energy ecosystems. With market values presented in Million units, this report offers actionable intelligence for stakeholders seeking to capitalize on the immense potential of IoT in the energy sector.
Internet of Things in the Energy Market Market Dynamics & Structure
The Internet of Things (IoT) in the Energy Market is characterized by a moderate to high concentration, with several leading technology providers vying for dominance. Technological innovation is the primary driver, fueled by advancements in sensor technology, artificial intelligence (AI), machine learning (ML), and cloud computing. Regulatory frameworks, particularly those focused on grid modernization, renewable energy integration, and data security, are increasingly shaping market development. Competitive product substitutes, such as traditional SCADA systems, are gradually being augmented or replaced by more agile and connected IoT solutions. End-user demographics are diverse, ranging from large-scale utility providers to individual building managers, all seeking enhanced efficiency, reliability, and sustainability. Mergers & Acquisitions (M&A) trends indicate a consolidation of capabilities, with larger tech firms acquiring specialized IoT startups to expand their offerings. For instance, the market saw an estimated USD 5,000 Million in M&A deal volumes during the historical period, reflecting a strong appetite for acquiring innovative technologies and customer bases.
- Market Concentration: Moderate to High, with key players investing heavily in R&D.
- Technological Innovation Drivers: AI/ML integration, edge computing, 5G connectivity, advanced analytics.
- Regulatory Frameworks: Focus on grid modernization, renewable energy mandates, cybersecurity standards.
- Competitive Product Substitutes: SCADA systems, legacy automation, manual monitoring.
- End-User Demographics: Utilities, commercial real estate, industrial manufacturers, smart city initiatives.
- M&A Trends: Strategic acquisitions for technology integration and market expansion. Estimated M&A deal volume in historical period: USD 5,000 Million.
Internet of Things in the Energy Market Growth Trends & Insights
The Internet of Things (IoT) in the Energy Market is experiencing robust growth, driven by the escalating demand for operational efficiency, predictive maintenance, and enhanced grid reliability. The market size is projected to expand significantly, with an estimated market valuation of USD 45,000 Million in the base year of 2025, and a projected Compound Annual Growth Rate (CAGR) of 18.5% during the forecast period of 2025–2033. This impressive growth is attributed to the increasing adoption of smart meters, renewable energy integration solutions, and advanced analytics platforms that enable real-time monitoring and control of energy assets. Technological disruptions, such as the proliferation of 5G networks, are further accelerating adoption by providing the necessary bandwidth and low latency for sophisticated IoT applications. Consumer behavior is also shifting, with a growing emphasis on energy conservation and a desire for greater control over energy consumption through smart home devices and personalized energy management services. The market penetration of advanced IoT solutions within the utilities sector alone is estimated to reach 65% by 2033. The global smart grid market, a significant child market, is expected to grow from USD 30,000 Million in 2025 to USD 75,000 Million by 2033, underscoring the direct correlation with IoT adoption. Furthermore, the industrial IoT (IIoT) segment within energy, focusing on process optimization and asset management, is anticipated to witness a CAGR of 19.2%. The increasing focus on reducing carbon footprints and achieving sustainability goals is a paramount factor propelling the adoption of IoT-enabled energy solutions, driving market penetration in both developed and emerging economies.
Dominant Regions, Countries, or Segments in Internet of Things in the Energy Market
North America currently dominates the Internet of Things (IoT) in the Energy Market, driven by its advanced technological infrastructure, significant investments in smart grid modernization, and supportive government policies. The United States, in particular, accounts for an estimated 35% of the global market share, owing to the widespread adoption of IoT solutions across its extensive utility networks and industrial sectors. Economic policies that encourage energy efficiency and renewable energy deployment, coupled with substantial investments in R&D by leading technology firms, have solidified North America's leadership. The presence of major players like IBM Corporation and Intel Corporation, along with innovative startups, fosters a competitive environment that spurs innovation.
Among the Type segments, IoT Software and IoT Platforms are exhibiting the most significant growth, with an estimated combined market share of 40% in 2025. These segments are crucial for data analysis, device management, and the deployment of intelligent applications. Utilities, representing a substantial 55% of the Industry segment's market share, are the primary adopters, leveraging IoT for grid optimization, demand-side management, and the integration of distributed energy resources. The Commercial Buildings sector, with an estimated market share of 25%, is increasingly embracing IoT for building automation systems, energy consumption monitoring, and smart HVAC controls. Industrial Facilities contribute another 20%, utilizing IoT for predictive maintenance of heavy machinery, process optimization, and enhanced safety protocols. The rapid digital transformation within these industries, coupled with the imperative for cost reduction and operational resilience, is a key driver of IoT adoption. The Asia-Pacific region is emerging as a significant growth engine, with countries like China and India rapidly expanding their smart city initiatives and renewable energy capacities, projected to witness a CAGR of 21% during the forecast period.
- Dominant Region: North America.
- Key Drivers: Advanced infrastructure, smart grid investments, supportive policies, R&D focus.
- Market Share: Estimated 35% (North America) in 2025.
- Leading Industry Segment: Utilities.
- Key Drivers: Grid modernization, renewable integration, efficiency mandates.
- Market Share: Estimated 55% (Utilities) in 2025.
- Fastest Growing Segment (Type): IoT Software & IoT Platforms.
- Key Drivers: Data analytics, application development, device management.
- Market Share: Estimated 40% (combined IoT Software & Platforms) in 2025.
- Emerging Growth Region: Asia-Pacific.
- Key Drivers: Smart city initiatives, renewable energy expansion, industrialization.
- Projected CAGR: 21% (2025-2033).
Internet of Things in the Energy Market Product Landscape
The product landscape within the Internet of Things (IoT) in the Energy Market is characterized by sophisticated hardware, intelligent software, robust platforms, and comprehensive security solutions. Hardware offerings include advanced smart meters, sensor networks, edge computing devices, and specialized industrial IoT gateways. IoT Software encompasses analytics platforms, AI/ML algorithms for predictive maintenance and demand forecasting, and asset management tools. IoT Platforms provide the foundational infrastructure for device connectivity, data aggregation, and application development, enabling seamless integration of various energy assets. IoT Security solutions are paramount, focusing on threat detection, data encryption, and secure device authentication to protect critical energy infrastructure. These products are designed for enhanced performance metrics, including real-time data acquisition, improved energy efficiency (estimated 15-20% savings), reduced downtime (estimated 25% reduction), and enhanced operational visibility. Innovations are continuously emerging, with a focus on low-power, long-range connectivity solutions like LoRaWAN and NB-IoT, alongside powerful cloud-based analytics for large-scale deployments.
Key Drivers, Barriers & Challenges in Internet of Things in the Energy Market
Key Drivers:
- Demand for Energy Efficiency: Growing global pressure to reduce energy consumption and operational costs.
- Grid Modernization: The need for smart grids to manage complex energy flows, integrate renewables, and improve reliability.
- Renewable Energy Integration: IoT enables better forecasting, management, and integration of intermittent renewable sources like solar and wind.
- Predictive Maintenance: IoT sensors and analytics significantly reduce downtime and maintenance costs for critical energy infrastructure.
- Data-Driven Decision Making: Real-time data from IoT devices allows for more informed operational and strategic decisions.
Barriers & Challenges:
- Cybersecurity Threats: Protecting vast interconnected energy systems from sophisticated cyberattacks remains a significant concern, with the potential for breaches costing the industry an estimated USD 10,000 Million annually.
- Interoperability Issues: Ensuring seamless communication and data exchange between diverse IoT devices and legacy systems from different vendors.
- Scalability and Infrastructure Costs: Implementing large-scale IoT deployments requires significant upfront investment in hardware, software, and network infrastructure.
- Regulatory Hurdles: Navigating complex and evolving regulatory landscapes concerning data privacy, security, and grid standards can be challenging.
- Lack of Skilled Workforce: A shortage of professionals with expertise in IoT, data analytics, and cybersecurity for the energy sector.
Emerging Opportunities in Internet of Things in the Energy Market
Emerging opportunities in the Internet of Things (IoT) in the Energy Market lie in the burgeoning demand for decentralized energy management and the integration of electric vehicle (EV) charging infrastructure. The growth of microgrids and distributed energy resources (DERs) presents a fertile ground for IoT solutions that can optimize local energy generation, storage, and consumption. Furthermore, the increasing electrification of transportation is creating a significant need for smart EV charging networks, where IoT can play a crucial role in managing charging loads, optimizing grid impact, and enabling vehicle-to-grid (V2G) capabilities. The expansion of smart building technologies, incorporating advanced energy monitoring and control systems, also offers substantial growth potential. The increasing focus on energy resilience and disaster preparedness is driving demand for IoT solutions that can provide real-time situational awareness and facilitate rapid response during emergencies.
Growth Accelerators in the Internet of Things in the Energy Market Industry
Several key catalysts are accelerating the growth of the Internet of Things (IoT) in the Energy Market. Technological breakthroughs in AI and machine learning are enabling more sophisticated analytics for predictive maintenance and energy demand forecasting, estimated to improve forecasting accuracy by 15%. Strategic partnerships between technology providers, energy companies, and utility firms are crucial for developing integrated solutions and expanding market reach. For instance, collaborations between hardware manufacturers like Intel Corporation and software providers like SAP SE are driving innovation. Market expansion strategies focusing on emerging economies with growing energy demands and nascent smart infrastructure initiatives will also be pivotal. The increasing availability of affordable IoT devices and the development of robust 5G networks are lowering adoption barriers and paving the way for widespread deployment of smart energy solutions.
Key Players Shaping the Internet of Things in the Energy Market Market
- Wind River Systems Inc
- IBM Corporation
- Maven Systems Private Limited
- Cisco Systems Inc
- Flutura Business Solutions LLC
- Carriots SL
- AGT International
- SAP SE
- Intel Corporation
- Davra Networks
Notable Milestones in Internet of Things in the Energy Market Sector
- Nov 2022: Huawei Technologies Co. Ltd started offering 5G distributed massive MIMO for indoor cellular networks, enhancing indoor radio network capabilities.
- Jul 2022: Crypto Quantique released a post-quantum cryptography (QPC) edition of its QuarkLink chip-to-cloud IoT security platform, incorporating NIST-standardized algorithms for enhanced IoT cybersecurity.
- Feb 2022: Nokia and AT&T collaborated to enhance 5G uplink performance using distributed massive MIMO, projecting a 60-90% increase in 5G uplink capacity.
In-Depth Internet of Things in the Energy Market Market Outlook
The future outlook for the Internet of Things (IoT) in the Energy Market is exceptionally bright, driven by a confluence of technological advancements and the urgent need for sustainable and efficient energy systems. Growth accelerators such as the pervasive adoption of AI for intelligent grid management, the integration of advanced analytics for granular energy consumption insights, and the expansion of 5G networks will continue to fuel market expansion. Strategic partnerships and a focus on emerging markets will unlock new avenues for growth. The increasing demand for energy resilience, cybersecurity, and the seamless integration of renewable energy sources will further solidify IoT's indispensable role in shaping the future of energy. The market is poised for significant innovation, with a projected valuation of USD 160,000 Million by 2033, offering substantial strategic opportunities for stakeholders across the energy value chain.
Internet of Things in the Energy Market Segmentation
-
1. Type
- 1.1. Hardware
- 1.2. IoT Software
- 1.3. IoT Platform
- 1.4. IoT Security
- 1.5. IoT Services
-
2. Industry
- 2.1. Utilities
- 2.2. Commercial Buildings
- 2.3. Industrial Facilities
Internet of Things in the Energy Market Segmentation By Geography
- 1. North America
- 2. Europe
- 3. Asia Pacific
- 4. Latin America
- 5. Middle East and Africa
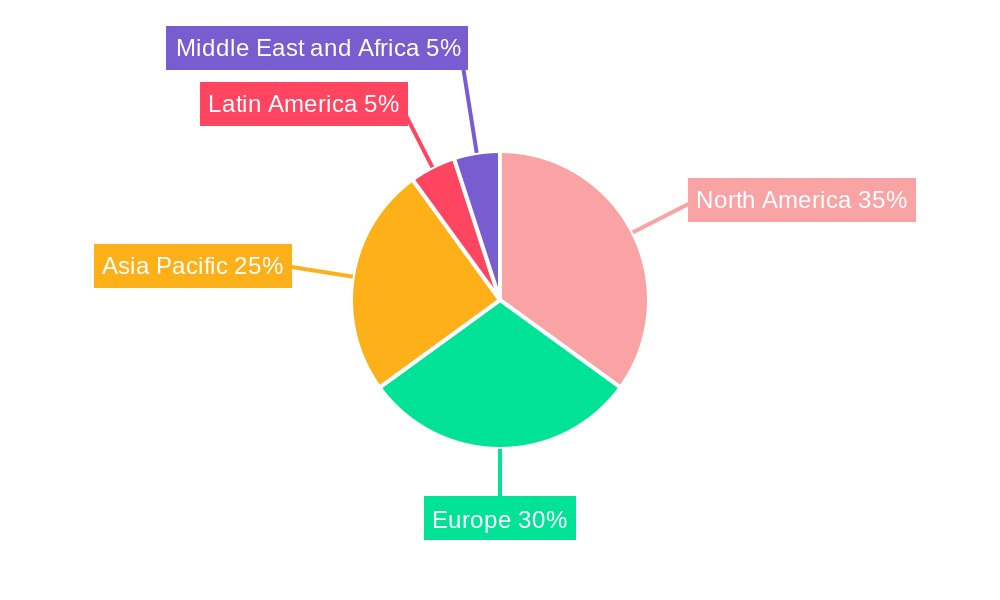
Internet of Things in the Energy Market Regional Market Share
Geographic Coverage of Internet of Things in the Energy Market
Internet of Things in the Energy Market REPORT HIGHLIGHTS
| Aspects | Details |
|---|---|
| Study Period | 2020-2034 |
| Base Year | 2025 |
| Estimated Year | 2026 |
| Forecast Period | 2026-2034 |
| Historical Period | 2020-2025 |
| Growth Rate | CAGR of 13.2% from 2020-2034 |
| Segmentation |
|
Table of Contents
- 1. Introduction
- 1.1. Research Scope
- 1.2. Market Segmentation
- 1.3. Research Objective
- 1.4. Definitions and Assumptions
- 2. Executive Summary
- 2.1. Market Snapshot
- 3. Market Dynamics
- 3.1. Market Drivers
- 3.2. Market Restrains
- 3.3. Market Trends
- 3.4. Market Opportunities
- 4. Market Factor Analysis
- 4.1. Porters Five Forces
- 4.1.1. Bargaining Power of Suppliers
- 4.1.2. Bargaining Power of Buyers
- 4.1.3. Threat of New Entrants
- 4.1.4. Threat of Substitutes
- 4.1.5. Competitive Rivalry
- 4.2. PESTEL analysis
- 4.3. BCG Analysis
- 4.3.1. Stars (High Growth, High Market Share)
- 4.3.2. Cash Cows (Low Growth, High Market Share)
- 4.3.3. Question Mark (High Growth, Low Market Share)
- 4.3.4. Dogs (Low Growth, Low Market Share)
- 4.4. Ansoff Matrix Analysis
- 4.5. Supply Chain Analysis
- 4.6. Regulatory Landscape
- 4.7. Current Market Potential and Opportunity Assessment (TAM–SAM–SOM Framework)
- 4.8. VDR Analyst Note
- 4.1. Porters Five Forces
- 5. Market Analysis, Insights and Forecast 2021-2033
- 5.1. Market Analysis, Insights and Forecast - by Type
- 5.1.1. Hardware
- 5.1.2. IoT Software
- 5.1.3. IoT Platform
- 5.1.4. IoT Security
- 5.1.5. IoT Services
- 5.2. Market Analysis, Insights and Forecast - by Industry
- 5.2.1. Utilities
- 5.2.2. Commercial Buildings
- 5.2.3. Industrial Facilities
- 5.3. Market Analysis, Insights and Forecast - by Region
- 5.3.1. North America
- 5.3.2. Europe
- 5.3.3. Asia Pacific
- 5.3.4. Latin America
- 5.3.5. Middle East and Africa
- 5.1. Market Analysis, Insights and Forecast - by Type
- 6. Global Internet of Things in the Energy Market Analysis, Insights and Forecast, 2021-2033
- 6.1. Market Analysis, Insights and Forecast - by Type
- 6.1.1. Hardware
- 6.1.2. IoT Software
- 6.1.3. IoT Platform
- 6.1.4. IoT Security
- 6.1.5. IoT Services
- 6.2. Market Analysis, Insights and Forecast - by Industry
- 6.2.1. Utilities
- 6.2.2. Commercial Buildings
- 6.2.3. Industrial Facilities
- 6.1. Market Analysis, Insights and Forecast - by Type
- 7. North America Internet of Things in the Energy Market Analysis, Insights and Forecast, 2021-2033
- 7.1. Market Analysis, Insights and Forecast - by Type
- 7.1.1. Hardware
- 7.1.2. IoT Software
- 7.1.3. IoT Platform
- 7.1.4. IoT Security
- 7.1.5. IoT Services
- 7.2. Market Analysis, Insights and Forecast - by Industry
- 7.2.1. Utilities
- 7.2.2. Commercial Buildings
- 7.2.3. Industrial Facilities
- 7.1. Market Analysis, Insights and Forecast - by Type
- 8. Europe Internet of Things in the Energy Market Analysis, Insights and Forecast, 2021-2033
- 8.1. Market Analysis, Insights and Forecast - by Type
- 8.1.1. Hardware
- 8.1.2. IoT Software
- 8.1.3. IoT Platform
- 8.1.4. IoT Security
- 8.1.5. IoT Services
- 8.2. Market Analysis, Insights and Forecast - by Industry
- 8.2.1. Utilities
- 8.2.2. Commercial Buildings
- 8.2.3. Industrial Facilities
- 8.1. Market Analysis, Insights and Forecast - by Type
- 9. Asia Pacific Internet of Things in the Energy Market Analysis, Insights and Forecast, 2021-2033
- 9.1. Market Analysis, Insights and Forecast - by Type
- 9.1.1. Hardware
- 9.1.2. IoT Software
- 9.1.3. IoT Platform
- 9.1.4. IoT Security
- 9.1.5. IoT Services
- 9.2. Market Analysis, Insights and Forecast - by Industry
- 9.2.1. Utilities
- 9.2.2. Commercial Buildings
- 9.2.3. Industrial Facilities
- 9.1. Market Analysis, Insights and Forecast - by Type
- 10. Latin America Internet of Things in the Energy Market Analysis, Insights and Forecast, 2021-2033
- 10.1. Market Analysis, Insights and Forecast - by Type
- 10.1.1. Hardware
- 10.1.2. IoT Software
- 10.1.3. IoT Platform
- 10.1.4. IoT Security
- 10.1.5. IoT Services
- 10.2. Market Analysis, Insights and Forecast - by Industry
- 10.2.1. Utilities
- 10.2.2. Commercial Buildings
- 10.2.3. Industrial Facilities
- 10.1. Market Analysis, Insights and Forecast - by Type
- 11. Middle East and Africa Internet of Things in the Energy Market Analysis, Insights and Forecast, 2021-2033
- 11.1. Market Analysis, Insights and Forecast - by Type
- 11.1.1. Hardware
- 11.1.2. IoT Software
- 11.1.3. IoT Platform
- 11.1.4. IoT Security
- 11.1.5. IoT Services
- 11.2. Market Analysis, Insights and Forecast - by Industry
- 11.2.1. Utilities
- 11.2.2. Commercial Buildings
- 11.2.3. Industrial Facilities
- 11.1. Market Analysis, Insights and Forecast - by Type
- 12. Competitive Analysis
- 12.1. Company Profiles
- 12.1.1 Wind River Systems Inc
- 12.1.1.1. Company Overview
- 12.1.1.2. Products
- 12.1.1.3. Company Financials
- 12.1.1.4. SWOT Analysis
- 12.1.2 IBM Corporation
- 12.1.2.1. Company Overview
- 12.1.2.2. Products
- 12.1.2.3. Company Financials
- 12.1.2.4. SWOT Analysis
- 12.1.3 Maven Systems Private Limited
- 12.1.3.1. Company Overview
- 12.1.3.2. Products
- 12.1.3.3. Company Financials
- 12.1.3.4. SWOT Analysis
- 12.1.4 Cisco Systems Inc
- 12.1.4.1. Company Overview
- 12.1.4.2. Products
- 12.1.4.3. Company Financials
- 12.1.4.4. SWOT Analysis
- 12.1.5 Flutura Business Solutions LLC
- 12.1.5.1. Company Overview
- 12.1.5.2. Products
- 12.1.5.3. Company Financials
- 12.1.5.4. SWOT Analysis
- 12.1.6 Carriots SL
- 12.1.6.1. Company Overview
- 12.1.6.2. Products
- 12.1.6.3. Company Financials
- 12.1.6.4. SWOT Analysis
- 12.1.7 AGT International
- 12.1.7.1. Company Overview
- 12.1.7.2. Products
- 12.1.7.3. Company Financials
- 12.1.7.4. SWOT Analysis
- 12.1.8 SAP SE
- 12.1.8.1. Company Overview
- 12.1.8.2. Products
- 12.1.8.3. Company Financials
- 12.1.8.4. SWOT Analysis
- 12.1.9 Intel Corporation
- 12.1.9.1. Company Overview
- 12.1.9.2. Products
- 12.1.9.3. Company Financials
- 12.1.9.4. SWOT Analysis
- 12.1.10 Davra Networks
- 12.1.10.1. Company Overview
- 12.1.10.2. Products
- 12.1.10.3. Company Financials
- 12.1.10.4. SWOT Analysis
- 12.1.1 Wind River Systems Inc
- 12.2. Market Entropy
- 12.2.1 Company's Key Areas Served
- 12.2.2 Recent Developments
- 12.3. Company Market Share Analysis 2025
- 12.3.1 Top 5 Companies Market Share Analysis
- 12.3.2 Top 3 Companies Market Share Analysis
- 12.4. List of Potential Customers
- 13. Research Methodology
List of Figures
- Figure 1: Global Internet of Things in the Energy Market Revenue Breakdown (billion, %) by Region 2025 & 2033
- Figure 2: Global Internet of Things in the Energy Market Volume Breakdown (K Unit, %) by Region 2025 & 2033
- Figure 3: North America Internet of Things in the Energy Market Revenue (billion), by Type 2025 & 2033
- Figure 4: North America Internet of Things in the Energy Market Volume (K Unit), by Type 2025 & 2033
- Figure 5: North America Internet of Things in the Energy Market Revenue Share (%), by Type 2025 & 2033
- Figure 6: North America Internet of Things in the Energy Market Volume Share (%), by Type 2025 & 2033
- Figure 7: North America Internet of Things in the Energy Market Revenue (billion), by Industry 2025 & 2033
- Figure 8: North America Internet of Things in the Energy Market Volume (K Unit), by Industry 2025 & 2033
- Figure 9: North America Internet of Things in the Energy Market Revenue Share (%), by Industry 2025 & 2033
- Figure 10: North America Internet of Things in the Energy Market Volume Share (%), by Industry 2025 & 2033
- Figure 11: North America Internet of Things in the Energy Market Revenue (billion), by Country 2025 & 2033
- Figure 12: North America Internet of Things in the Energy Market Volume (K Unit), by Country 2025 & 2033
- Figure 13: North America Internet of Things in the Energy Market Revenue Share (%), by Country 2025 & 2033
- Figure 14: North America Internet of Things in the Energy Market Volume Share (%), by Country 2025 & 2033
- Figure 15: Europe Internet of Things in the Energy Market Revenue (billion), by Type 2025 & 2033
- Figure 16: Europe Internet of Things in the Energy Market Volume (K Unit), by Type 2025 & 2033
- Figure 17: Europe Internet of Things in the Energy Market Revenue Share (%), by Type 2025 & 2033
- Figure 18: Europe Internet of Things in the Energy Market Volume Share (%), by Type 2025 & 2033
- Figure 19: Europe Internet of Things in the Energy Market Revenue (billion), by Industry 2025 & 2033
- Figure 20: Europe Internet of Things in the Energy Market Volume (K Unit), by Industry 2025 & 2033
- Figure 21: Europe Internet of Things in the Energy Market Revenue Share (%), by Industry 2025 & 2033
- Figure 22: Europe Internet of Things in the Energy Market Volume Share (%), by Industry 2025 & 2033
- Figure 23: Europe Internet of Things in the Energy Market Revenue (billion), by Country 2025 & 2033
- Figure 24: Europe Internet of Things in the Energy Market Volume (K Unit), by Country 2025 & 2033
- Figure 25: Europe Internet of Things in the Energy Market Revenue Share (%), by Country 2025 & 2033
- Figure 26: Europe Internet of Things in the Energy Market Volume Share (%), by Country 2025 & 2033
- Figure 27: Asia Pacific Internet of Things in the Energy Market Revenue (billion), by Type 2025 & 2033
- Figure 28: Asia Pacific Internet of Things in the Energy Market Volume (K Unit), by Type 2025 & 2033
- Figure 29: Asia Pacific Internet of Things in the Energy Market Revenue Share (%), by Type 2025 & 2033
- Figure 30: Asia Pacific Internet of Things in the Energy Market Volume Share (%), by Type 2025 & 2033
- Figure 31: Asia Pacific Internet of Things in the Energy Market Revenue (billion), by Industry 2025 & 2033
- Figure 32: Asia Pacific Internet of Things in the Energy Market Volume (K Unit), by Industry 2025 & 2033
- Figure 33: Asia Pacific Internet of Things in the Energy Market Revenue Share (%), by Industry 2025 & 2033
- Figure 34: Asia Pacific Internet of Things in the Energy Market Volume Share (%), by Industry 2025 & 2033
- Figure 35: Asia Pacific Internet of Things in the Energy Market Revenue (billion), by Country 2025 & 2033
- Figure 36: Asia Pacific Internet of Things in the Energy Market Volume (K Unit), by Country 2025 & 2033
- Figure 37: Asia Pacific Internet of Things in the Energy Market Revenue Share (%), by Country 2025 & 2033
- Figure 38: Asia Pacific Internet of Things in the Energy Market Volume Share (%), by Country 2025 & 2033
- Figure 39: Latin America Internet of Things in the Energy Market Revenue (billion), by Type 2025 & 2033
- Figure 40: Latin America Internet of Things in the Energy Market Volume (K Unit), by Type 2025 & 2033
- Figure 41: Latin America Internet of Things in the Energy Market Revenue Share (%), by Type 2025 & 2033
- Figure 42: Latin America Internet of Things in the Energy Market Volume Share (%), by Type 2025 & 2033
- Figure 43: Latin America Internet of Things in the Energy Market Revenue (billion), by Industry 2025 & 2033
- Figure 44: Latin America Internet of Things in the Energy Market Volume (K Unit), by Industry 2025 & 2033
- Figure 45: Latin America Internet of Things in the Energy Market Revenue Share (%), by Industry 2025 & 2033
- Figure 46: Latin America Internet of Things in the Energy Market Volume Share (%), by Industry 2025 & 2033
- Figure 47: Latin America Internet of Things in the Energy Market Revenue (billion), by Country 2025 & 2033
- Figure 48: Latin America Internet of Things in the Energy Market Volume (K Unit), by Country 2025 & 2033
- Figure 49: Latin America Internet of Things in the Energy Market Revenue Share (%), by Country 2025 & 2033
- Figure 50: Latin America Internet of Things in the Energy Market Volume Share (%), by Country 2025 & 2033
- Figure 51: Middle East and Africa Internet of Things in the Energy Market Revenue (billion), by Type 2025 & 2033
- Figure 52: Middle East and Africa Internet of Things in the Energy Market Volume (K Unit), by Type 2025 & 2033
- Figure 53: Middle East and Africa Internet of Things in the Energy Market Revenue Share (%), by Type 2025 & 2033
- Figure 54: Middle East and Africa Internet of Things in the Energy Market Volume Share (%), by Type 2025 & 2033
- Figure 55: Middle East and Africa Internet of Things in the Energy Market Revenue (billion), by Industry 2025 & 2033
- Figure 56: Middle East and Africa Internet of Things in the Energy Market Volume (K Unit), by Industry 2025 & 2033
- Figure 57: Middle East and Africa Internet of Things in the Energy Market Revenue Share (%), by Industry 2025 & 2033
- Figure 58: Middle East and Africa Internet of Things in the Energy Market Volume Share (%), by Industry 2025 & 2033
- Figure 59: Middle East and Africa Internet of Things in the Energy Market Revenue (billion), by Country 2025 & 2033
- Figure 60: Middle East and Africa Internet of Things in the Energy Market Volume (K Unit), by Country 2025 & 2033
- Figure 61: Middle East and Africa Internet of Things in the Energy Market Revenue Share (%), by Country 2025 & 2033
- Figure 62: Middle East and Africa Internet of Things in the Energy Market Volume Share (%), by Country 2025 & 2033
List of Tables
- Table 1: Global Internet of Things in the Energy Market Revenue billion Forecast, by Type 2020 & 2033
- Table 2: Global Internet of Things in the Energy Market Volume K Unit Forecast, by Type 2020 & 2033
- Table 3: Global Internet of Things in the Energy Market Revenue billion Forecast, by Industry 2020 & 2033
- Table 4: Global Internet of Things in the Energy Market Volume K Unit Forecast, by Industry 2020 & 2033
- Table 5: Global Internet of Things in the Energy Market Revenue billion Forecast, by Region 2020 & 2033
- Table 6: Global Internet of Things in the Energy Market Volume K Unit Forecast, by Region 2020 & 2033
- Table 7: Global Internet of Things in the Energy Market Revenue billion Forecast, by Type 2020 & 2033
- Table 8: Global Internet of Things in the Energy Market Volume K Unit Forecast, by Type 2020 & 2033
- Table 9: Global Internet of Things in the Energy Market Revenue billion Forecast, by Industry 2020 & 2033
- Table 10: Global Internet of Things in the Energy Market Volume K Unit Forecast, by Industry 2020 & 2033
- Table 11: Global Internet of Things in the Energy Market Revenue billion Forecast, by Country 2020 & 2033
- Table 12: Global Internet of Things in the Energy Market Volume K Unit Forecast, by Country 2020 & 2033
- Table 13: Global Internet of Things in the Energy Market Revenue billion Forecast, by Type 2020 & 2033
- Table 14: Global Internet of Things in the Energy Market Volume K Unit Forecast, by Type 2020 & 2033
- Table 15: Global Internet of Things in the Energy Market Revenue billion Forecast, by Industry 2020 & 2033
- Table 16: Global Internet of Things in the Energy Market Volume K Unit Forecast, by Industry 2020 & 2033
- Table 17: Global Internet of Things in the Energy Market Revenue billion Forecast, by Country 2020 & 2033
- Table 18: Global Internet of Things in the Energy Market Volume K Unit Forecast, by Country 2020 & 2033
- Table 19: Global Internet of Things in the Energy Market Revenue billion Forecast, by Type 2020 & 2033
- Table 20: Global Internet of Things in the Energy Market Volume K Unit Forecast, by Type 2020 & 2033
- Table 21: Global Internet of Things in the Energy Market Revenue billion Forecast, by Industry 2020 & 2033
- Table 22: Global Internet of Things in the Energy Market Volume K Unit Forecast, by Industry 2020 & 2033
- Table 23: Global Internet of Things in the Energy Market Revenue billion Forecast, by Country 2020 & 2033
- Table 24: Global Internet of Things in the Energy Market Volume K Unit Forecast, by Country 2020 & 2033
- Table 25: Global Internet of Things in the Energy Market Revenue billion Forecast, by Type 2020 & 2033
- Table 26: Global Internet of Things in the Energy Market Volume K Unit Forecast, by Type 2020 & 2033
- Table 27: Global Internet of Things in the Energy Market Revenue billion Forecast, by Industry 2020 & 2033
- Table 28: Global Internet of Things in the Energy Market Volume K Unit Forecast, by Industry 2020 & 2033
- Table 29: Global Internet of Things in the Energy Market Revenue billion Forecast, by Country 2020 & 2033
- Table 30: Global Internet of Things in the Energy Market Volume K Unit Forecast, by Country 2020 & 2033
- Table 31: Global Internet of Things in the Energy Market Revenue billion Forecast, by Type 2020 & 2033
- Table 32: Global Internet of Things in the Energy Market Volume K Unit Forecast, by Type 2020 & 2033
- Table 33: Global Internet of Things in the Energy Market Revenue billion Forecast, by Industry 2020 & 2033
- Table 34: Global Internet of Things in the Energy Market Volume K Unit Forecast, by Industry 2020 & 2033
- Table 35: Global Internet of Things in the Energy Market Revenue billion Forecast, by Country 2020 & 2033
- Table 36: Global Internet of Things in the Energy Market Volume K Unit Forecast, by Country 2020 & 2033
Frequently Asked Questions
1. What is the projected Compound Annual Growth Rate (CAGR) of the Internet of Things in the Energy Market?
The projected CAGR is approximately 13.2%.
2. Which companies are prominent players in the Internet of Things in the Energy Market?
Key companies in the market include Wind River Systems Inc, IBM Corporation, Maven Systems Private Limited, Cisco Systems Inc, Flutura Business Solutions LLC, Carriots SL, AGT International, SAP SE, Intel Corporation, Davra Networks.
3. What are the main segments of the Internet of Things in the Energy Market?
The market segments include Type , Industry.
4. Can you provide details about the market size?
The market size is estimated to be USD 21.1 billion as of 2022.
5. What are some drivers contributing to market growth?
Increasing Awareness of Energy Consumption Control.
6. What are the notable trends driving market growth?
Smart Meters Expected to Hold Significant Share.
7. Are there any restraints impacting market growth?
High Risk Associated with Data.
8. Can you provide examples of recent developments in the market?
Nov 2022: With the subsequent development in indoor cellular networks, Huawei Technologies Co. Ltd started offering 5G distributed massive MIMO. To replicate Massive MIMO indoors, Huawei offers to coordinate distributed indoor radio networks like the enhanced antenna arrays of Massive MIMO.
9. What pricing options are available for accessing the report?
Pricing options include single-user, multi-user, and enterprise licenses priced at USD 4750, USD 5250, and USD 8750 respectively.
10. Is the market size provided in terms of value or volume?
The market size is provided in terms of value, measured in billion and volume, measured in K Unit.
11. Are there any specific market keywords associated with the report?
Yes, the market keyword associated with the report is "Internet of Things in the Energy Market," which aids in identifying and referencing the specific market segment covered.
12. How do I determine which pricing option suits my needs best?
The pricing options vary based on user requirements and access needs. Individual users may opt for single-user licenses, while businesses requiring broader access may choose multi-user or enterprise licenses for cost-effective access to the report.
13. Are there any additional resources or data provided in the Internet of Things in the Energy Market report?
While the report offers comprehensive insights, it's advisable to review the specific contents or supplementary materials provided to ascertain if additional resources or data are available.
14. How can I stay updated on further developments or reports in the Internet of Things in the Energy Market?
To stay informed about further developments, trends, and reports in the Internet of Things in the Energy Market, consider subscribing to industry newsletters, following relevant companies and organizations, or regularly checking reputable industry news sources and publications.
Methodology
Step 1 - Identification of Relevant Samples Size from Population Database


Step 2 - Approaches for Defining Global Market Size (Value, Volume* & Price*)

Note*: In applicable scenarios
Step 3 - Data Sources
Primary Research
- Web Analytics
- Survey Reports
- Research Institute
- Latest Research Reports
- Opinion Leaders
Secondary Research
- Annual Reports
- White Paper
- Latest Press Release
- Industry Association
- Paid Database
- Investor Presentations

Step 4 - Data Triangulation
Involves using different sources of information in order to increase the validity of a study
These sources are likely to be stakeholders in a program - participants, other researchers, program staff, other community members, and so on.
Then we put all data in single framework & apply various statistical tools to find out the dynamic on the market.
During the analysis stage, feedback from the stakeholder groups would be compared to determine areas of agreement as well as areas of divergence