

Key Insights
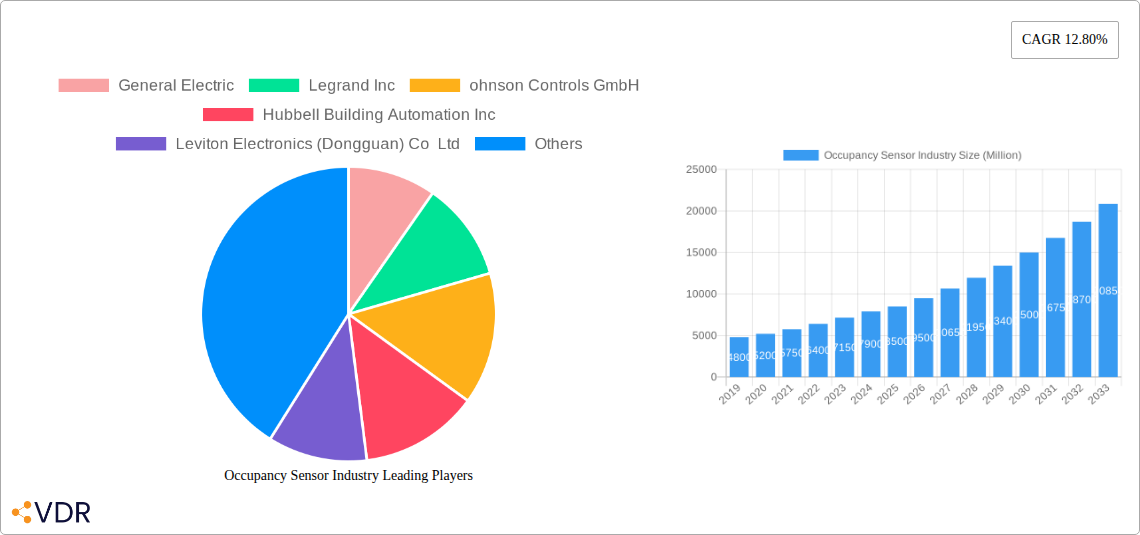
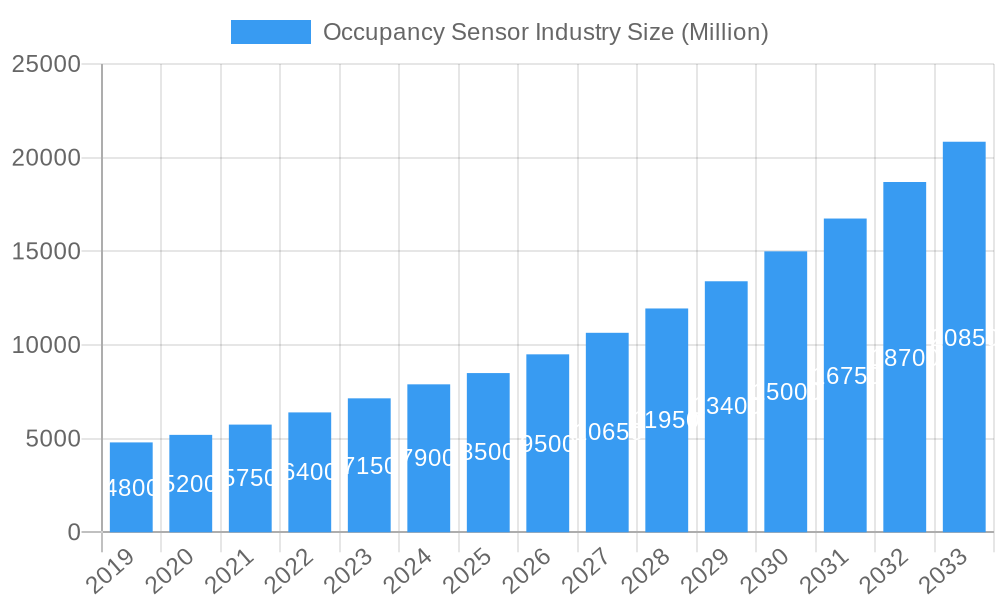
The global Occupancy Sensor market is projected for substantial growth, expected to reach $8,500 million by 2025, with a CAGR of 12.80%. This expansion is driven by the increasing demand for energy efficiency and sustainability in residential, commercial, and industrial sectors. Favorable government regulations on energy consumption are compelling adoption of smart technologies like occupancy sensors to optimize lighting and HVAC, reducing operational costs and carbon footprints. Advancements in IoT and sensor technology, coupled with their integration into Building Management Systems (BMS) for security, further fuel market momentum.
Occupancy Sensor Industry Market Size (In Billion)
The market is segmented by technology, with wireless sensors leading adoption due to ease of installation. Passive Infrared (PIR) sensors maintain a dominant share, while Ultrasonic and Microwave technologies gain traction for their enhanced accuracy. Lighting control and HVAC optimization are the primary applications in residential and commercial sectors. North America currently leads market share, while the Asia Pacific region is anticipated to exhibit the fastest growth due to rapid urbanization and construction. Key players are actively innovating to capitalize on evolving market demands, with intensifying competition expected.
Occupancy Sensor Industry Company Market Share
Occupancy Sensor Market Analysis: Driving Smart Building Efficiency and Sustainability
This report offers an in-depth analysis of the global Occupancy Sensor market, a key component for modern building automation and energy efficiency. With a study period from 2019–2033, this report utilizes 2025 as the base year, forecasting the market size to be $3.07 billion by 2025. It examines parent and child market dynamics, growth drivers, opportunities, and competitive landscapes. This report provides actionable insights for industry professionals, strategists, and investors navigating the smart building technology and IoT sensor markets. Data is presented in billion units.
Occupancy Sensor Industry Market Dynamics & Structure
The occupancy sensor market exhibits a dynamic and evolving structure, driven by increasing demand for energy conservation and intelligent building management. Market concentration varies across different technology segments and geographical regions, with established players vying for dominance against emerging innovators. Technological innovation serves as a primary driver, fueled by advancements in wireless sensor technology, AI-powered analytics, and miniaturization of IoT devices. Regulatory frameworks promoting energy efficiency standards and sustainable building practices are further accelerating market adoption. Competitive product substitutes, such as manual control systems and timers, are gradually being phased out by the superior efficiency and automation offered by occupancy sensors. End-user demographics are shifting towards a greater appreciation for smart home technology and commercial building automation solutions. Mergers and acquisitions (M&A) are a notable trend, as larger corporations seek to expand their portfolios and technological capabilities within the building automation systems market. For instance, significant M&A activity has been observed in recent years, with an estimated X deal volumes within the historical period, indicating a consolidation phase. Key innovation barriers include the cost of advanced sensor technologies and the need for standardized interoperability protocols across different building systems.
Occupancy Sensor Industry Growth Trends & Insights
The global occupancy sensor market is poised for robust growth, projected to expand at a significant CAGR of XX% during the forecast period. This upward trajectory is underpinned by an increasing global emphasis on energy efficiency, smart city initiatives, and the proliferation of the Internet of Things (IoT) in building infrastructure. The wireless occupancy sensor segment, in particular, is experiencing heightened adoption rates due to its ease of installation and flexibility. Technological disruptions, such as the integration of advanced algorithms for precise occupancy detection and the development of ultra-low-power sensors, are revolutionizing the performance and application scope of these devices. Consumer behavior is also shifting, with a growing demand for automated environments that enhance comfort, security, and operational efficiency in both residential and commercial spaces. The market penetration of occupancy sensors in new construction projects is steadily increasing, while retrofit projects are gaining momentum as building owners seek to upgrade existing infrastructure for energy savings and enhanced functionality. The smart building market is intrinsically linked to occupancy sensor adoption, as these devices form the foundational layer for intelligent space utilization and resource management. Emerging applications beyond basic lighting control, such as advanced HVAC optimization and sophisticated security surveillance, are further driving market expansion. The continuous innovation in sensor technology, coupled with declining hardware costs, is making occupancy sensors a more accessible and indispensable component of modern building design and management.
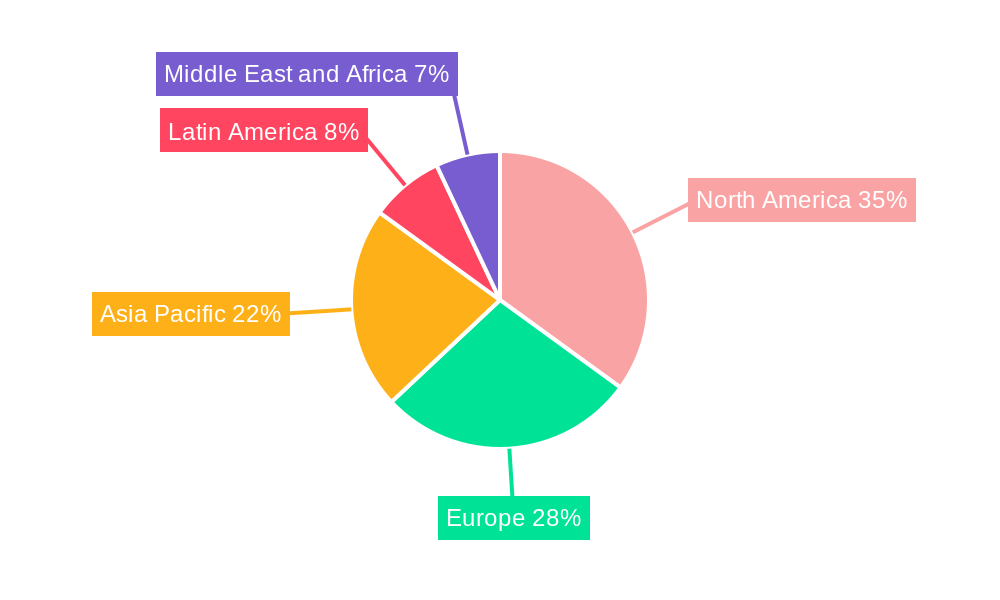
Dominant Regions, Countries, or Segments in Occupancy Sensor Industry
The occupancy sensor industry is currently experiencing significant growth and dominance across various segments, with North America emerging as a leading region. This dominance is fueled by a confluence of factors including strong government initiatives promoting energy efficiency, a mature smart building ecosystem, and a high level of technological adoption in both commercial building applications and residential sectors. Within North America, the United States stands out due to its extensive investments in smart infrastructure and its proactive stance on sustainable building practices.
- Network Type: The Wireless segment is rapidly gaining traction, outperforming the Wired segment. This is attributed to the ease of installation, flexibility in deployment, and lower infrastructure costs associated with wireless solutions, making them ideal for retrofitting existing buildings and for complex layouts.
- Technology: Passive Infrared (PIR) sensors currently hold a dominant share due to their cost-effectiveness and proven reliability for detecting human presence. However, Microwave sensors are gaining market share due to their ability to detect motion through obstacles and their higher accuracy in certain environments. Ultrasonic sensors are also carving out a niche, particularly where precise detection in enclosed spaces is crucial.
- Building Type: The Commercial Building Type segment is the primary driver of market growth. This includes applications in offices, retail spaces, educational institutions, and healthcare facilities, where energy savings and optimized space utilization are paramount. The Residential segment is also experiencing steady growth as smart home technology becomes more mainstream.
- Application: Lighting Control remains the largest application, driven by substantial energy savings. However, HVAC control and Security and Surveillance applications are witnessing accelerated growth. Advanced occupancy data allows for dynamic adjustment of heating, ventilation, and air conditioning, significantly reducing energy waste. In security, occupancy sensors enhance the intelligence of surveillance systems by detecting presence and movement.
The market share of North America in the global occupancy sensor market is estimated to be XX%, with a projected growth rate of XX% during the forecast period. This leadership is further supported by the presence of key industry players and a robust research and development ecosystem.
Occupancy Sensor Industry Product Landscape
The occupancy sensor product landscape is characterized by continuous innovation focused on enhanced accuracy, energy efficiency, and seamless integration into smart building ecosystems. Manufacturers are introducing advanced sensors leveraging multi-technology approaches (e.g., PIR with ultrasonic) for improved detection and reduced false positives. Product developments include miniature, discreet sensors designed for aesthetic integration into various building elements and long-range sensors for covering larger spaces. Performance metrics are seeing significant improvements, with faster response times, extended battery life for wireless devices, and enhanced sensitivity. Unique selling propositions often revolve around the ease of installation, comprehensive data analytics capabilities for space optimization, and compatibility with leading building management systems (BMS) and smart home platforms. Emerging trends include the integration of edge AI for localized data processing and privacy-preserving analytics, enabling smarter decision-making at the sensor level.
Key Drivers, Barriers & Challenges in Occupancy Sensor Industry
Key Drivers: The occupancy sensor industry is propelled by a confluence of powerful drivers. Foremost among these is the escalating global demand for energy efficiency and sustainability, mandated by stringent government regulations and corporate ESG (Environmental, Social, and Governance) goals. The increasing adoption of smart building technologies and the broader IoT market expansion are critical catalysts, enabling seamless integration and data-driven insights. Technological advancements in sensor accuracy, miniaturization, and wireless connectivity are making solutions more attractive and cost-effective. The growing awareness of the benefits of optimized space utilization and enhanced occupant comfort in commercial and residential settings also fuels demand.
Barriers & Challenges: Despite the promising outlook, the occupancy sensor market faces several challenges. Initial installation costs, particularly for complex wired systems, can be a barrier for some organizations. Ensuring interoperability and standardization across diverse building systems and platforms remains an ongoing challenge, potentially leading to integration complexities. Intense competition among manufacturers, leading to price pressures, can impact profit margins. Supply chain disruptions, as witnessed in recent global events, can affect product availability and lead times. Furthermore, data privacy concerns related to occupant tracking and surveillance necessitate robust security measures and transparent data handling policies.
Emerging Opportunities in Occupancy Sensor Industry
Emerging opportunities within the occupancy sensor industry are vast and diverse. The integration of Artificial Intelligence (AI) and Machine Learning (ML) with occupancy data presents a significant frontier, enabling predictive maintenance, dynamic space allocation, and highly personalized environmental controls. Untapped markets, particularly in developing economies with rapidly urbanizing populations and increasing construction of commercial and residential buildings, offer substantial growth potential. The expansion of occupancy sensors into niche applications such as smart retail analytics (customer flow, dwell times), smart healthcare (patient room monitoring), and intelligent transportation systems (occupancy detection in public transport) represents new avenues for revenue generation. Evolving consumer preferences for hyper-personalized and automated living experiences in smart homes will continue to drive innovation in user-friendly and integrated occupancy sensing solutions.
Growth Accelerators in the Occupancy Sensor Industry Industry
Several key catalysts are accelerating long-term growth in the occupancy sensor industry. Continued technological breakthroughs in sensor fusion, combining multiple sensing technologies for unparalleled accuracy and reliability, will drive performance. Strategic partnerships between sensor manufacturers, building automation system providers, and software developers are crucial for creating comprehensive, end-to-end smart building solutions. Market expansion strategies, including targeting specific industry verticals with tailored applications and establishing strong distribution networks in emerging markets, will amplify reach. Furthermore, the development of sophisticated analytics platforms that translate raw occupancy data into actionable business intelligence for facility managers and building owners will significantly enhance the value proposition of occupancy sensors, acting as a major growth accelerator.
Key Players Shaping the Occupancy Sensor Industry Market
- General Electric
- Legrand Inc
- Johnson Controls GmbH
- Hubbell Building Automation Inc
- Leviton Electronics (Dongguan) Co Ltd
- Honeywell International
- Schneider Electric
- Texas Instruments Incorporated
- Pammvi Group
- Philips Ltd
- Lutron Electronics Inc
- Eaton Corporation
Notable Milestones in Occupancy Sensor Industry Sector
- June 2022 - Butlr launched as an occupancy-sensing platform that captures the presence and movement of individuals within a space in real-time, stating that the data gathered by the platform can be utilized to revolutionize the workplace. Butlr's platform's spatial insights, occupancy, and activity analytics may be utilized to make data-driven real estate and design decisions, as well as to improve the tenant experience.
- April 2022 - Lumentum Holdings Inc. and Ambarella Inc. have launched a new collaborative reference design for smart building applications that integrates edge artificial intelligence (AI) with privacy. This combination enables the deployment of small AIoT sensors with local processing throughout buildings for applications such as occupancy sensor systems, intelligent space management, and smart retail.
In-Depth Occupancy Sensor Industry Market Outlook
The occupancy sensor industry is set for an impressive period of growth and innovation, driven by the relentless pursuit of energy efficiency and intelligent building management. The future market potential is immense, with the ongoing digital transformation of built environments and the increasing integration of AI and IoT technologies. Strategic opportunities lie in developing more intelligent, predictive, and privacy-centric sensing solutions that cater to evolving user needs and regulatory landscapes. The expansion into new application areas beyond traditional lighting and HVAC, coupled with a focus on data analytics for enhanced operational insights, will solidify the indispensable role of occupancy sensors in creating smarter, more sustainable, and human-centric spaces. The market is expected to witness further consolidation and diversification as key players continue to invest in R&D and explore new business models.
Occupancy Sensor Industry Segmentation
-
1. Network Type
- 1.1. Wired
- 1.2. Wireless
-
2. Technology
- 2.1. Ultrasonic
- 2.2. Passive Infrared
- 2.3. Microwave
-
3. Building Type
- 3.1. Residential
- 3.2. Commercial
-
4. Application
- 4.1. Lighting Control
- 4.2. HVAC
- 4.3. Security and Surveillance
- 4.4. Other Applications
Occupancy Sensor Industry Segmentation By Geography
-
1. North America
- 1.1. United States
- 1.2. Canada
-
2. Europe
- 2.1. United Kingdom
- 2.2. France
- 2.3. Germany
- 2.4. Italy
- 2.5. Rest of Europe
-
3. Asia Pacific
- 3.1. China
- 3.2. Japan
- 3.3. South Korea
- 3.4. Australia
- 3.5. Rest of Asia Pacific
-
4. Latin America
- 4.1. Mexico
- 4.2. Rest of Latin America
- 5. Middle East and Africa
Occupancy Sensor Industry Regional Market Share
Geographic Coverage of Occupancy Sensor Industry
Occupancy Sensor Industry REPORT HIGHLIGHTS
| Aspects | Details |
|---|---|
| Study Period | 2020-2034 |
| Base Year | 2025 |
| Estimated Year | 2026 |
| Forecast Period | 2026-2034 |
| Historical Period | 2020-2025 |
| Growth Rate | CAGR of 11.92% from 2020-2034 |
| Segmentation |
|
Table of Contents
- 1. Introduction
- 1.1. Research Scope
- 1.2. Market Segmentation
- 1.3. Research Objective
- 1.4. Definitions and Assumptions
- 2. Executive Summary
- 2.1. Market Snapshot
- 3. Market Dynamics
- 3.1. Market Drivers
- 3.2. Market Restrains
- 3.3. Market Trends
- 3.4. Market Opportunities
- 4. Market Factor Analysis
- 4.1. Porters Five Forces
- 4.1.1. Bargaining Power of Suppliers
- 4.1.2. Bargaining Power of Buyers
- 4.1.3. Threat of New Entrants
- 4.1.4. Threat of Substitutes
- 4.1.5. Competitive Rivalry
- 4.2. PESTEL analysis
- 4.3. BCG Analysis
- 4.3.1. Stars (High Growth, High Market Share)
- 4.3.2. Cash Cows (Low Growth, High Market Share)
- 4.3.3. Question Mark (High Growth, Low Market Share)
- 4.3.4. Dogs (Low Growth, Low Market Share)
- 4.4. Ansoff Matrix Analysis
- 4.5. Supply Chain Analysis
- 4.6. Regulatory Landscape
- 4.7. Current Market Potential and Opportunity Assessment (TAM–SAM–SOM Framework)
- 4.8. VDR Analyst Note
- 4.1. Porters Five Forces
- 5. Market Analysis, Insights and Forecast 2021-2033
- 5.1. Market Analysis, Insights and Forecast - by Network Type
- 5.1.1. Wired
- 5.1.2. Wireless
- 5.2. Market Analysis, Insights and Forecast - by Technology
- 5.2.1. Ultrasonic
- 5.2.2. Passive Infrared
- 5.2.3. Microwave
- 5.3. Market Analysis, Insights and Forecast - by Building Type
- 5.3.1. Residential
- 5.3.2. Commercial
- 5.4. Market Analysis, Insights and Forecast - by Application
- 5.4.1. Lighting Control
- 5.4.2. HVAC
- 5.4.3. Security and Surveillance
- 5.4.4. Other Applications
- 5.5. Market Analysis, Insights and Forecast - by Region
- 5.5.1. North America
- 5.5.2. Europe
- 5.5.3. Asia Pacific
- 5.5.4. Latin America
- 5.5.5. Middle East and Africa
- 5.1. Market Analysis, Insights and Forecast - by Network Type
- 6. Global Occupancy Sensor Industry Analysis, Insights and Forecast, 2021-2033
- 6.1. Market Analysis, Insights and Forecast - by Network Type
- 6.1.1. Wired
- 6.1.2. Wireless
- 6.2. Market Analysis, Insights and Forecast - by Technology
- 6.2.1. Ultrasonic
- 6.2.2. Passive Infrared
- 6.2.3. Microwave
- 6.3. Market Analysis, Insights and Forecast - by Building Type
- 6.3.1. Residential
- 6.3.2. Commercial
- 6.4. Market Analysis, Insights and Forecast - by Application
- 6.4.1. Lighting Control
- 6.4.2. HVAC
- 6.4.3. Security and Surveillance
- 6.4.4. Other Applications
- 6.1. Market Analysis, Insights and Forecast - by Network Type
- 7. North America Occupancy Sensor Industry Analysis, Insights and Forecast, 2021-2033
- 7.1. Market Analysis, Insights and Forecast - by Network Type
- 7.1.1. Wired
- 7.1.2. Wireless
- 7.2. Market Analysis, Insights and Forecast - by Technology
- 7.2.1. Ultrasonic
- 7.2.2. Passive Infrared
- 7.2.3. Microwave
- 7.3. Market Analysis, Insights and Forecast - by Building Type
- 7.3.1. Residential
- 7.3.2. Commercial
- 7.4. Market Analysis, Insights and Forecast - by Application
- 7.4.1. Lighting Control
- 7.4.2. HVAC
- 7.4.3. Security and Surveillance
- 7.4.4. Other Applications
- 7.1. Market Analysis, Insights and Forecast - by Network Type
- 8. Europe Occupancy Sensor Industry Analysis, Insights and Forecast, 2021-2033
- 8.1. Market Analysis, Insights and Forecast - by Network Type
- 8.1.1. Wired
- 8.1.2. Wireless
- 8.2. Market Analysis, Insights and Forecast - by Technology
- 8.2.1. Ultrasonic
- 8.2.2. Passive Infrared
- 8.2.3. Microwave
- 8.3. Market Analysis, Insights and Forecast - by Building Type
- 8.3.1. Residential
- 8.3.2. Commercial
- 8.4. Market Analysis, Insights and Forecast - by Application
- 8.4.1. Lighting Control
- 8.4.2. HVAC
- 8.4.3. Security and Surveillance
- 8.4.4. Other Applications
- 8.1. Market Analysis, Insights and Forecast - by Network Type
- 9. Asia Pacific Occupancy Sensor Industry Analysis, Insights and Forecast, 2021-2033
- 9.1. Market Analysis, Insights and Forecast - by Network Type
- 9.1.1. Wired
- 9.1.2. Wireless
- 9.2. Market Analysis, Insights and Forecast - by Technology
- 9.2.1. Ultrasonic
- 9.2.2. Passive Infrared
- 9.2.3. Microwave
- 9.3. Market Analysis, Insights and Forecast - by Building Type
- 9.3.1. Residential
- 9.3.2. Commercial
- 9.4. Market Analysis, Insights and Forecast - by Application
- 9.4.1. Lighting Control
- 9.4.2. HVAC
- 9.4.3. Security and Surveillance
- 9.4.4. Other Applications
- 9.1. Market Analysis, Insights and Forecast - by Network Type
- 10. Latin America Occupancy Sensor Industry Analysis, Insights and Forecast, 2021-2033
- 10.1. Market Analysis, Insights and Forecast - by Network Type
- 10.1.1. Wired
- 10.1.2. Wireless
- 10.2. Market Analysis, Insights and Forecast - by Technology
- 10.2.1. Ultrasonic
- 10.2.2. Passive Infrared
- 10.2.3. Microwave
- 10.3. Market Analysis, Insights and Forecast - by Building Type
- 10.3.1. Residential
- 10.3.2. Commercial
- 10.4. Market Analysis, Insights and Forecast - by Application
- 10.4.1. Lighting Control
- 10.4.2. HVAC
- 10.4.3. Security and Surveillance
- 10.4.4. Other Applications
- 10.1. Market Analysis, Insights and Forecast - by Network Type
- 11. Middle East and Africa Occupancy Sensor Industry Analysis, Insights and Forecast, 2021-2033
- 11.1. Market Analysis, Insights and Forecast - by Network Type
- 11.1.1. Wired
- 11.1.2. Wireless
- 11.2. Market Analysis, Insights and Forecast - by Technology
- 11.2.1. Ultrasonic
- 11.2.2. Passive Infrared
- 11.2.3. Microwave
- 11.3. Market Analysis, Insights and Forecast - by Building Type
- 11.3.1. Residential
- 11.3.2. Commercial
- 11.4. Market Analysis, Insights and Forecast - by Application
- 11.4.1. Lighting Control
- 11.4.2. HVAC
- 11.4.3. Security and Surveillance
- 11.4.4. Other Applications
- 11.1. Market Analysis, Insights and Forecast - by Network Type
- 12. Competitive Analysis
- 12.1. Company Profiles
- 12.1.1 General Electric
- 12.1.1.1. Company Overview
- 12.1.1.2. Products
- 12.1.1.3. Company Financials
- 12.1.1.4. SWOT Analysis
- 12.1.2 Legrand Inc
- 12.1.2.1. Company Overview
- 12.1.2.2. Products
- 12.1.2.3. Company Financials
- 12.1.2.4. SWOT Analysis
- 12.1.3 ohnson Controls GmbH
- 12.1.3.1. Company Overview
- 12.1.3.2. Products
- 12.1.3.3. Company Financials
- 12.1.3.4. SWOT Analysis
- 12.1.4 Hubbell Building Automation Inc
- 12.1.4.1. Company Overview
- 12.1.4.2. Products
- 12.1.4.3. Company Financials
- 12.1.4.4. SWOT Analysis
- 12.1.5 Leviton Electronics (Dongguan) Co Ltd
- 12.1.5.1. Company Overview
- 12.1.5.2. Products
- 12.1.5.3. Company Financials
- 12.1.5.4. SWOT Analysis
- 12.1.6 Honeywell International
- 12.1.6.1. Company Overview
- 12.1.6.2. Products
- 12.1.6.3. Company Financials
- 12.1.6.4. SWOT Analysis
- 12.1.7 Schneider Electric
- 12.1.7.1. Company Overview
- 12.1.7.2. Products
- 12.1.7.3. Company Financials
- 12.1.7.4. SWOT Analysis
- 12.1.8 Texas Instruments Incorporated*List Not Exhaustive
- 12.1.8.1. Company Overview
- 12.1.8.2. Products
- 12.1.8.3. Company Financials
- 12.1.8.4. SWOT Analysis
- 12.1.9 Pammvi Group
- 12.1.9.1. Company Overview
- 12.1.9.2. Products
- 12.1.9.3. Company Financials
- 12.1.9.4. SWOT Analysis
- 12.1.10 Philips Ltd
- 12.1.10.1. Company Overview
- 12.1.10.2. Products
- 12.1.10.3. Company Financials
- 12.1.10.4. SWOT Analysis
- 12.1.11 Lutron Electronics Inc
- 12.1.11.1. Company Overview
- 12.1.11.2. Products
- 12.1.11.3. Company Financials
- 12.1.11.4. SWOT Analysis
- 12.1.12 Eaton Corporation
- 12.1.12.1. Company Overview
- 12.1.12.2. Products
- 12.1.12.3. Company Financials
- 12.1.12.4. SWOT Analysis
- 12.1.1 General Electric
- 12.2. Market Entropy
- 12.2.1 Company's Key Areas Served
- 12.2.2 Recent Developments
- 12.3. Company Market Share Analysis 2025
- 12.3.1 Top 5 Companies Market Share Analysis
- 12.3.2 Top 3 Companies Market Share Analysis
- 12.4. List of Potential Customers
- 13. Research Methodology
List of Figures
- Figure 1: Global Occupancy Sensor Industry Revenue Breakdown (billion, %) by Region 2025 & 2033
- Figure 2: North America Occupancy Sensor Industry Revenue (billion), by Network Type 2025 & 2033
- Figure 3: North America Occupancy Sensor Industry Revenue Share (%), by Network Type 2025 & 2033
- Figure 4: North America Occupancy Sensor Industry Revenue (billion), by Technology 2025 & 2033
- Figure 5: North America Occupancy Sensor Industry Revenue Share (%), by Technology 2025 & 2033
- Figure 6: North America Occupancy Sensor Industry Revenue (billion), by Building Type 2025 & 2033
- Figure 7: North America Occupancy Sensor Industry Revenue Share (%), by Building Type 2025 & 2033
- Figure 8: North America Occupancy Sensor Industry Revenue (billion), by Application 2025 & 2033
- Figure 9: North America Occupancy Sensor Industry Revenue Share (%), by Application 2025 & 2033
- Figure 10: North America Occupancy Sensor Industry Revenue (billion), by Country 2025 & 2033
- Figure 11: North America Occupancy Sensor Industry Revenue Share (%), by Country 2025 & 2033
- Figure 12: Europe Occupancy Sensor Industry Revenue (billion), by Network Type 2025 & 2033
- Figure 13: Europe Occupancy Sensor Industry Revenue Share (%), by Network Type 2025 & 2033
- Figure 14: Europe Occupancy Sensor Industry Revenue (billion), by Technology 2025 & 2033
- Figure 15: Europe Occupancy Sensor Industry Revenue Share (%), by Technology 2025 & 2033
- Figure 16: Europe Occupancy Sensor Industry Revenue (billion), by Building Type 2025 & 2033
- Figure 17: Europe Occupancy Sensor Industry Revenue Share (%), by Building Type 2025 & 2033
- Figure 18: Europe Occupancy Sensor Industry Revenue (billion), by Application 2025 & 2033
- Figure 19: Europe Occupancy Sensor Industry Revenue Share (%), by Application 2025 & 2033
- Figure 20: Europe Occupancy Sensor Industry Revenue (billion), by Country 2025 & 2033
- Figure 21: Europe Occupancy Sensor Industry Revenue Share (%), by Country 2025 & 2033
- Figure 22: Asia Pacific Occupancy Sensor Industry Revenue (billion), by Network Type 2025 & 2033
- Figure 23: Asia Pacific Occupancy Sensor Industry Revenue Share (%), by Network Type 2025 & 2033
- Figure 24: Asia Pacific Occupancy Sensor Industry Revenue (billion), by Technology 2025 & 2033
- Figure 25: Asia Pacific Occupancy Sensor Industry Revenue Share (%), by Technology 2025 & 2033
- Figure 26: Asia Pacific Occupancy Sensor Industry Revenue (billion), by Building Type 2025 & 2033
- Figure 27: Asia Pacific Occupancy Sensor Industry Revenue Share (%), by Building Type 2025 & 2033
- Figure 28: Asia Pacific Occupancy Sensor Industry Revenue (billion), by Application 2025 & 2033
- Figure 29: Asia Pacific Occupancy Sensor Industry Revenue Share (%), by Application 2025 & 2033
- Figure 30: Asia Pacific Occupancy Sensor Industry Revenue (billion), by Country 2025 & 2033
- Figure 31: Asia Pacific Occupancy Sensor Industry Revenue Share (%), by Country 2025 & 2033
- Figure 32: Latin America Occupancy Sensor Industry Revenue (billion), by Network Type 2025 & 2033
- Figure 33: Latin America Occupancy Sensor Industry Revenue Share (%), by Network Type 2025 & 2033
- Figure 34: Latin America Occupancy Sensor Industry Revenue (billion), by Technology 2025 & 2033
- Figure 35: Latin America Occupancy Sensor Industry Revenue Share (%), by Technology 2025 & 2033
- Figure 36: Latin America Occupancy Sensor Industry Revenue (billion), by Building Type 2025 & 2033
- Figure 37: Latin America Occupancy Sensor Industry Revenue Share (%), by Building Type 2025 & 2033
- Figure 38: Latin America Occupancy Sensor Industry Revenue (billion), by Application 2025 & 2033
- Figure 39: Latin America Occupancy Sensor Industry Revenue Share (%), by Application 2025 & 2033
- Figure 40: Latin America Occupancy Sensor Industry Revenue (billion), by Country 2025 & 2033
- Figure 41: Latin America Occupancy Sensor Industry Revenue Share (%), by Country 2025 & 2033
- Figure 42: Middle East and Africa Occupancy Sensor Industry Revenue (billion), by Network Type 2025 & 2033
- Figure 43: Middle East and Africa Occupancy Sensor Industry Revenue Share (%), by Network Type 2025 & 2033
- Figure 44: Middle East and Africa Occupancy Sensor Industry Revenue (billion), by Technology 2025 & 2033
- Figure 45: Middle East and Africa Occupancy Sensor Industry Revenue Share (%), by Technology 2025 & 2033
- Figure 46: Middle East and Africa Occupancy Sensor Industry Revenue (billion), by Building Type 2025 & 2033
- Figure 47: Middle East and Africa Occupancy Sensor Industry Revenue Share (%), by Building Type 2025 & 2033
- Figure 48: Middle East and Africa Occupancy Sensor Industry Revenue (billion), by Application 2025 & 2033
- Figure 49: Middle East and Africa Occupancy Sensor Industry Revenue Share (%), by Application 2025 & 2033
- Figure 50: Middle East and Africa Occupancy Sensor Industry Revenue (billion), by Country 2025 & 2033
- Figure 51: Middle East and Africa Occupancy Sensor Industry Revenue Share (%), by Country 2025 & 2033
List of Tables
- Table 1: Global Occupancy Sensor Industry Revenue billion Forecast, by Network Type 2020 & 2033
- Table 2: Global Occupancy Sensor Industry Revenue billion Forecast, by Technology 2020 & 2033
- Table 3: Global Occupancy Sensor Industry Revenue billion Forecast, by Building Type 2020 & 2033
- Table 4: Global Occupancy Sensor Industry Revenue billion Forecast, by Application 2020 & 2033
- Table 5: Global Occupancy Sensor Industry Revenue billion Forecast, by Region 2020 & 2033
- Table 6: Global Occupancy Sensor Industry Revenue billion Forecast, by Network Type 2020 & 2033
- Table 7: Global Occupancy Sensor Industry Revenue billion Forecast, by Technology 2020 & 2033
- Table 8: Global Occupancy Sensor Industry Revenue billion Forecast, by Building Type 2020 & 2033
- Table 9: Global Occupancy Sensor Industry Revenue billion Forecast, by Application 2020 & 2033
- Table 10: Global Occupancy Sensor Industry Revenue billion Forecast, by Country 2020 & 2033
- Table 11: United States Occupancy Sensor Industry Revenue (billion) Forecast, by Application 2020 & 2033
- Table 12: Canada Occupancy Sensor Industry Revenue (billion) Forecast, by Application 2020 & 2033
- Table 13: Global Occupancy Sensor Industry Revenue billion Forecast, by Network Type 2020 & 2033
- Table 14: Global Occupancy Sensor Industry Revenue billion Forecast, by Technology 2020 & 2033
- Table 15: Global Occupancy Sensor Industry Revenue billion Forecast, by Building Type 2020 & 2033
- Table 16: Global Occupancy Sensor Industry Revenue billion Forecast, by Application 2020 & 2033
- Table 17: Global Occupancy Sensor Industry Revenue billion Forecast, by Country 2020 & 2033
- Table 18: United Kingdom Occupancy Sensor Industry Revenue (billion) Forecast, by Application 2020 & 2033
- Table 19: France Occupancy Sensor Industry Revenue (billion) Forecast, by Application 2020 & 2033
- Table 20: Germany Occupancy Sensor Industry Revenue (billion) Forecast, by Application 2020 & 2033
- Table 21: Italy Occupancy Sensor Industry Revenue (billion) Forecast, by Application 2020 & 2033
- Table 22: Rest of Europe Occupancy Sensor Industry Revenue (billion) Forecast, by Application 2020 & 2033
- Table 23: Global Occupancy Sensor Industry Revenue billion Forecast, by Network Type 2020 & 2033
- Table 24: Global Occupancy Sensor Industry Revenue billion Forecast, by Technology 2020 & 2033
- Table 25: Global Occupancy Sensor Industry Revenue billion Forecast, by Building Type 2020 & 2033
- Table 26: Global Occupancy Sensor Industry Revenue billion Forecast, by Application 2020 & 2033
- Table 27: Global Occupancy Sensor Industry Revenue billion Forecast, by Country 2020 & 2033
- Table 28: China Occupancy Sensor Industry Revenue (billion) Forecast, by Application 2020 & 2033
- Table 29: Japan Occupancy Sensor Industry Revenue (billion) Forecast, by Application 2020 & 2033
- Table 30: South Korea Occupancy Sensor Industry Revenue (billion) Forecast, by Application 2020 & 2033
- Table 31: Australia Occupancy Sensor Industry Revenue (billion) Forecast, by Application 2020 & 2033
- Table 32: Rest of Asia Pacific Occupancy Sensor Industry Revenue (billion) Forecast, by Application 2020 & 2033
- Table 33: Global Occupancy Sensor Industry Revenue billion Forecast, by Network Type 2020 & 2033
- Table 34: Global Occupancy Sensor Industry Revenue billion Forecast, by Technology 2020 & 2033
- Table 35: Global Occupancy Sensor Industry Revenue billion Forecast, by Building Type 2020 & 2033
- Table 36: Global Occupancy Sensor Industry Revenue billion Forecast, by Application 2020 & 2033
- Table 37: Global Occupancy Sensor Industry Revenue billion Forecast, by Country 2020 & 2033
- Table 38: Mexico Occupancy Sensor Industry Revenue (billion) Forecast, by Application 2020 & 2033
- Table 39: Rest of Latin America Occupancy Sensor Industry Revenue (billion) Forecast, by Application 2020 & 2033
- Table 40: Global Occupancy Sensor Industry Revenue billion Forecast, by Network Type 2020 & 2033
- Table 41: Global Occupancy Sensor Industry Revenue billion Forecast, by Technology 2020 & 2033
- Table 42: Global Occupancy Sensor Industry Revenue billion Forecast, by Building Type 2020 & 2033
- Table 43: Global Occupancy Sensor Industry Revenue billion Forecast, by Application 2020 & 2033
- Table 44: Global Occupancy Sensor Industry Revenue billion Forecast, by Country 2020 & 2033
Frequently Asked Questions
1. What is the projected Compound Annual Growth Rate (CAGR) of the Occupancy Sensor Industry?
The projected CAGR is approximately 11.92%.
2. Which companies are prominent players in the Occupancy Sensor Industry?
Key companies in the market include General Electric, Legrand Inc, ohnson Controls GmbH, Hubbell Building Automation Inc, Leviton Electronics (Dongguan) Co Ltd, Honeywell International, Schneider Electric, Texas Instruments Incorporated*List Not Exhaustive, Pammvi Group, Philips Ltd, Lutron Electronics Inc, Eaton Corporation.
3. What are the main segments of the Occupancy Sensor Industry?
The market segments include Network Type, Technology, Building Type, Application.
4. Can you provide details about the market size?
The market size is estimated to be USD 3.07 billion as of 2022.
5. What are some drivers contributing to market growth?
Rising Demand for Energy-efficient Devices; Demand for Passive Infrared Due to Low Cost and High Energy Efficiency.
6. What are the notable trends driving market growth?
Smart City to Increase the Growth of the Occupancy Sensor Market.
7. Are there any restraints impacting market growth?
False Triggering of Switch and Inconsistency Issues Associated with Wireless Network Systems.
8. Can you provide examples of recent developments in the market?
June 2022 - Butlr launched as an occupancy-sensing platform that captures the presence and movement of individuals within a space in real-time, stating that the data gathered by the platform can be utilized to revolutionize the workplace. Butlr's platform's spatial insights, occupancy, and activity analytics may be utilized to make data-driven real estate and design decisions, as well as to improve the tenant experience.
9. What pricing options are available for accessing the report?
Pricing options include single-user, multi-user, and enterprise licenses priced at USD 4750, USD 5250, and USD 8750 respectively.
10. Is the market size provided in terms of value or volume?
The market size is provided in terms of value, measured in billion.
11. Are there any specific market keywords associated with the report?
Yes, the market keyword associated with the report is "Occupancy Sensor Industry," which aids in identifying and referencing the specific market segment covered.
12. How do I determine which pricing option suits my needs best?
The pricing options vary based on user requirements and access needs. Individual users may opt for single-user licenses, while businesses requiring broader access may choose multi-user or enterprise licenses for cost-effective access to the report.
13. Are there any additional resources or data provided in the Occupancy Sensor Industry report?
While the report offers comprehensive insights, it's advisable to review the specific contents or supplementary materials provided to ascertain if additional resources or data are available.
14. How can I stay updated on further developments or reports in the Occupancy Sensor Industry?
To stay informed about further developments, trends, and reports in the Occupancy Sensor Industry, consider subscribing to industry newsletters, following relevant companies and organizations, or regularly checking reputable industry news sources and publications.
Methodology
Step 1 - Identification of Relevant Samples Size from Population Database


Step 2 - Approaches for Defining Global Market Size (Value, Volume* & Price*)

Note*: In applicable scenarios
Step 3 - Data Sources
Primary Research
- Web Analytics
- Survey Reports
- Research Institute
- Latest Research Reports
- Opinion Leaders
Secondary Research
- Annual Reports
- White Paper
- Latest Press Release
- Industry Association
- Paid Database
- Investor Presentations

Step 4 - Data Triangulation
Involves using different sources of information in order to increase the validity of a study
These sources are likely to be stakeholders in a program - participants, other researchers, program staff, other community members, and so on.
Then we put all data in single framework & apply various statistical tools to find out the dynamic on the market.
During the analysis stage, feedback from the stakeholder groups would be compared to determine areas of agreement as well as areas of divergence