
Key Insights
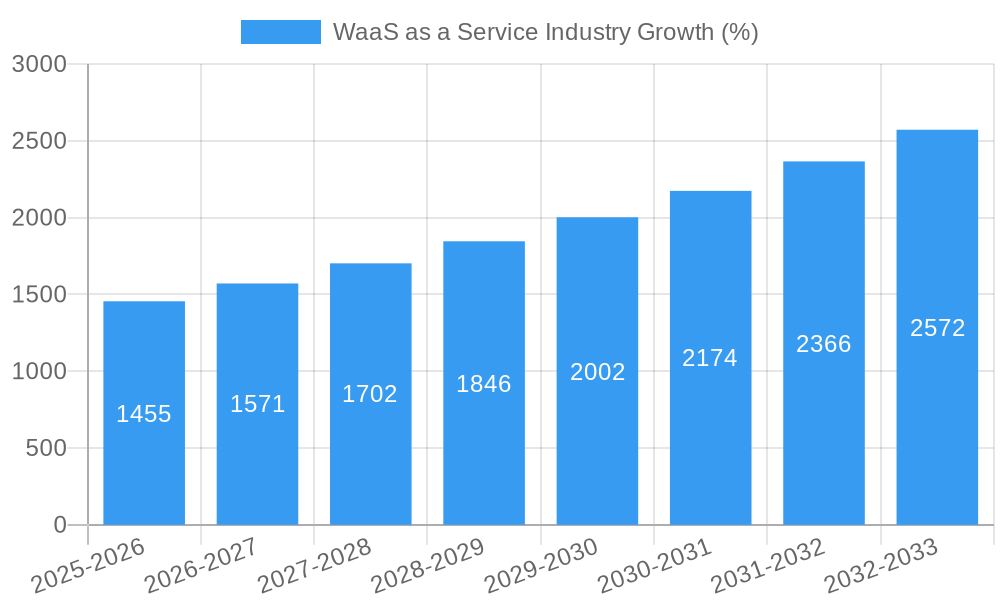
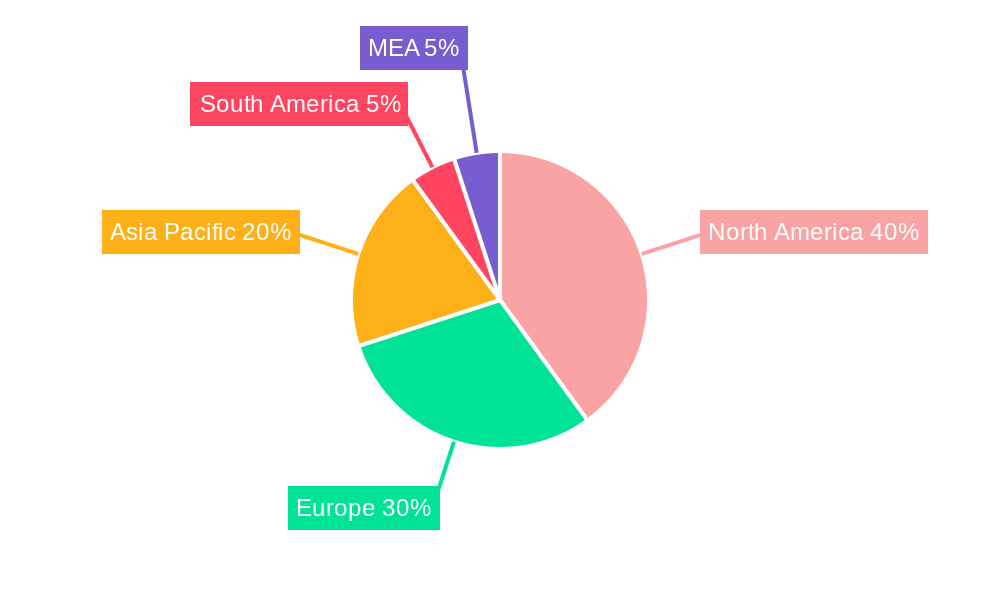
The Workload as a Service (WaaS) market is experiencing robust growth, driven by the increasing adoption of cloud computing, the need for enhanced agility and scalability, and the desire to optimize IT infrastructure costs. The 9.70% CAGR indicates a significant expansion, projected to reach a substantial market value by 2033. Key drivers include the rising demand for flexible and on-demand computing resources across diverse sectors like BFSI, education, and healthcare. Businesses are increasingly outsourcing their workload management to leverage the expertise and infrastructure offered by WaaS providers, reducing capital expenditure and freeing up internal IT resources. The shift towards hybrid and multi-cloud environments further fuels this growth, as organizations seek to balance the benefits of public and private clouds. The market segmentation reveals that DaaS and AaaS solutions are particularly popular, catering to the varied needs of small and medium enterprises (SMEs) and large enterprises. North America and Europe currently dominate the market share, reflecting high technological advancement and cloud adoption rates; however, rapid growth is expected in Asia-Pacific due to increasing digitalization initiatives and infrastructure development. Despite the positive outlook, certain restraints like security concerns, vendor lock-in, and the need for skilled workforce to manage cloud-based workloads could impede market expansion.
The competitive landscape is marked by a mix of established cloud providers like Microsoft and Amazon Web Services, along with specialized WaaS vendors such as Cloudalize and Dizzion. The market is characterized by intense competition, fostering innovation and driving down prices. The success of individual players depends on their ability to offer comprehensive solutions, strong security features, robust customer support, and a flexible pricing model. Future growth hinges on continuous technological advancements, the development of advanced security measures to address data breaches, and effective strategies to manage increasing data volumes and complexities associated with hybrid and multi-cloud deployments. The ongoing trend towards automation and AI-powered workload management will further shape the landscape of the WaaS market, leading to more sophisticated and efficient solutions. To maintain a competitive edge, players must invest heavily in research and development and focus on strategic partnerships to expand their reach and offer comprehensive solutions tailored to specific industry needs.
WaaS as a Service Industry Market Report: 2019-2033
This comprehensive report provides a detailed analysis of the Work-as-a-Service (WaaS) industry, encompassing market dynamics, growth trends, dominant segments, and key players. The report covers the period 2019-2033, with a base year of 2025 and a forecast period of 2025-2033. It offers invaluable insights for industry professionals, investors, and businesses seeking to understand and capitalize on the opportunities within this rapidly evolving market. The total market size is projected to reach xx Million by 2033.
WaaS as a Service Industry Market Dynamics & Structure
The WaaS market is characterized by a dynamic interplay of factors influencing its structure and growth trajectory. Market concentration is moderate, with a few major players holding significant shares, while numerous smaller niche players cater to specific customer segments. Technological innovation, particularly in areas like cloud computing, virtualization, and cybersecurity, is a primary driver of market expansion. Regulatory frameworks, varying by region, impact data privacy, security compliance, and cross-border data transfers, shaping industry practices. Competitive pressures from traditional on-premise solutions and emerging technologies are significant. End-user demographics, influenced by the rising adoption of remote work and digital transformation initiatives, are significantly expanding the market. M&A activity is robust, with strategic acquisitions bolstering market consolidation and expansion.
- Market Concentration: Moderate, with top 5 players holding approximately 60% market share in 2025 (estimated).
- Technological Innovation: Cloud computing, virtualization, AI, and enhanced security protocols are key drivers.
- Regulatory Frameworks: GDPR, CCPA, and other regional regulations impact data handling and compliance.
- Competitive Substitutes: On-premise solutions, open-source alternatives, and other cloud-based services create competitive pressure.
- End-User Demographics: Growth driven by increasing remote work, digital transformation initiatives, and small and medium-sized enterprises (SMEs) adoption.
- M&A Activity: Significant volume of deals expected in the forecast period, averaging xx deals annually (predicted).
WaaS as a Service Industry Growth Trends & Insights
The WaaS market exhibits robust growth, driven by the increasing demand for flexible, scalable, and cost-effective IT solutions. Market size expanded from xx Million in 2019 to xx Million in 2024, demonstrating a strong CAGR of xx%. This trend is projected to continue, with the market reaching xx Million by 2033. Adoption rates are particularly high in sectors undergoing digital transformation, such as BFSI and Government. Technological disruptions, such as the shift towards serverless computing and edge computing, are creating new opportunities. Consumer behavior is evolving towards preference for subscription-based services and pay-as-you-go models.
Dominant Regions, Countries, or Segments in WaaS as a Service Industry
North America currently dominates the WaaS market, driven by high technology adoption rates and robust digital infrastructure. Europe follows closely, with significant growth potential in emerging markets. Within segments, DaaS solutions hold a leading position due to high demand for remote work capabilities. The BFSI sector is a key driver, demanding high security and compliance features. Large enterprises lead in adoption due to scale and budget capabilities.
- Leading Regions: North America, Europe, and APAC.
- Leading End-User Verticals: BFSI, Telecom and IT, and Government.
- Leading Deployment Model: Public Cloud.
- Leading Solution: DaaS.
- Leading Enterprise Size: Large Enterprises.
- Key Drivers: Government support for digital transformation initiatives, increasing investments in IT infrastructure, expanding adoption in SMEs.
WaaS as a Service Industry Product Landscape
The WaaS product landscape is characterized by continuous innovation in terms of functionality, scalability, and security. Products increasingly incorporate AI-powered features for enhanced performance and automation. Key differentiators include seamless integration capabilities, advanced security protocols, and user-friendly interfaces. The market is witnessing a trend towards specialized WaaS solutions tailored to specific industry needs.
Key Drivers, Barriers & Challenges in WaaS as a Service Industry
Key Drivers: Increasing demand for remote work solutions, rising adoption of cloud computing, and cost optimization needs. Government initiatives promoting digital transformation further accelerate market growth.
Key Challenges: Security concerns around data breaches, high upfront investment costs for infrastructure, and the need for skilled IT personnel to manage and support WaaS solutions.
Emerging Opportunities in WaaS as a Service Industry
Emerging opportunities include the expansion of WaaS solutions into untapped markets, such as developing economies and specific niche industries. The integration of IoT devices and edge computing capabilities within WaaS platforms creates new possibilities. Personalized and customized WaaS solutions are expected to gain traction.
Growth Accelerators in the WaaS as a Service Industry
Technological advancements such as serverless computing, edge computing, and improved security measures are driving long-term growth. Strategic partnerships between WaaS providers and other technology companies are expanding market reach and creating innovative solutions. Government regulations promoting digital transformation are contributing to increased adoption rates.
Key Players Shaping the WaaS as a Service Industry Market
- Cloudalize NV
- Unisys Corporation
- Getronics NV
- Dizzion Inc
- NTT DATA Corporation
- Microsoft Corporation
- Amazon Web Services Inc
- Colt Technology Services
- VMware Inc
- Citrix Systems Inc
Notable Milestones in WaaS as a Service Industry Sector
- April 2023: Bikanervala adopts Google Workspace, demonstrating the growing adoption of WaaS in the retail sector.
- March 2023: Evolve IP partners with Five9, showcasing the increasing integration of WaaS solutions with other cloud services.
In-Depth WaaS as a Service Industry Market Outlook
The WaaS market is poised for continued strong growth, fueled by technological advancements, increasing demand for flexible IT solutions, and ongoing digital transformation efforts across various industries. Strategic partnerships and acquisitions will further consolidate the market, leading to increased innovation and broader market penetration. The focus on enhanced security and compliance features will be crucial in driving wider adoption and building consumer trust.
WaaS as a Service Industry Segmentation
-
1. Deployment
- 1.1. Public
- 1.2. Private
- 1.3. Hybrid
-
2. Solution and Service
- 2.1. Desktop as a Service (DaaS)
- 2.2. Application as a Service (AaaS)
-
3. Enterprise
- 3.1. Small and Medium Enterprises
- 3.2. Large Enterprises
-
4. End-user Vertical
- 4.1. Banking, Financial Services and Insurance (BFSI)
- 4.2. Education
- 4.3. Retail
- 4.4. Government
- 4.5. Telecom and IT
- 4.6. Healthcare
- 4.7. Other End-user Verticals
WaaS as a Service Industry Segmentation By Geography
- 1. North America
- 2. Europe
- 3. Asia Pacific
- 4. Latin America
- 5. Middle East
WaaS as a Service Industry REPORT HIGHLIGHTS
| Aspects | Details |
|---|---|
| Study Period | 2019-2033 |
| Base Year | 2024 |
| Estimated Year | 2025 |
| Forecast Period | 2025-2033 |
| Historical Period | 2019-2024 |
| Growth Rate | CAGR of 9.70% from 2019-2033 |
| Segmentation |
|
Table of Contents
- 1. Introduction
- 1.1. Research Scope
- 1.2. Market Segmentation
- 1.3. Research Methodology
- 1.4. Definitions and Assumptions
- 2. Executive Summary
- 2.1. Introduction
- 3. Market Dynamics
- 3.1. Introduction
- 3.2. Market Drivers
- 3.2.1. Rising Adoption of BYOD across Various Industries; Increasing Demand for Affordable Desktop Virtualization Solutions
- 3.3. Market Restrains
- 3.3.1. Security Concerns Over Cloud Storage
- 3.4. Market Trends
- 3.4.1. Telecom and IT to hold a Major Market Share
- 4. Market Factor Analysis
- 4.1. Porters Five Forces
- 4.2. Supply/Value Chain
- 4.3. PESTEL analysis
- 4.4. Market Entropy
- 4.5. Patent/Trademark Analysis
- 5. Global WaaS as a Service Industry Analysis, Insights and Forecast, 2019-2031
- 5.1. Market Analysis, Insights and Forecast - by Deployment
- 5.1.1. Public
- 5.1.2. Private
- 5.1.3. Hybrid
- 5.2. Market Analysis, Insights and Forecast - by Solution and Service
- 5.2.1. Desktop as a Service (DaaS)
- 5.2.2. Application as a Service (AaaS)
- 5.3. Market Analysis, Insights and Forecast - by Enterprise
- 5.3.1. Small and Medium Enterprises
- 5.3.2. Large Enterprises
- 5.4. Market Analysis, Insights and Forecast - by End-user Vertical
- 5.4.1. Banking, Financial Services and Insurance (BFSI)
- 5.4.2. Education
- 5.4.3. Retail
- 5.4.4. Government
- 5.4.5. Telecom and IT
- 5.4.6. Healthcare
- 5.4.7. Other End-user Verticals
- 5.5. Market Analysis, Insights and Forecast - by Region
- 5.5.1. North America
- 5.5.2. Europe
- 5.5.3. Asia Pacific
- 5.5.4. Latin America
- 5.5.5. Middle East
- 5.1. Market Analysis, Insights and Forecast - by Deployment
- 6. North America WaaS as a Service Industry Analysis, Insights and Forecast, 2019-2031
- 6.1. Market Analysis, Insights and Forecast - by Deployment
- 6.1.1. Public
- 6.1.2. Private
- 6.1.3. Hybrid
- 6.2. Market Analysis, Insights and Forecast - by Solution and Service
- 6.2.1. Desktop as a Service (DaaS)
- 6.2.2. Application as a Service (AaaS)
- 6.3. Market Analysis, Insights and Forecast - by Enterprise
- 6.3.1. Small and Medium Enterprises
- 6.3.2. Large Enterprises
- 6.4. Market Analysis, Insights and Forecast - by End-user Vertical
- 6.4.1. Banking, Financial Services and Insurance (BFSI)
- 6.4.2. Education
- 6.4.3. Retail
- 6.4.4. Government
- 6.4.5. Telecom and IT
- 6.4.6. Healthcare
- 6.4.7. Other End-user Verticals
- 6.1. Market Analysis, Insights and Forecast - by Deployment
- 7. Europe WaaS as a Service Industry Analysis, Insights and Forecast, 2019-2031
- 7.1. Market Analysis, Insights and Forecast - by Deployment
- 7.1.1. Public
- 7.1.2. Private
- 7.1.3. Hybrid
- 7.2. Market Analysis, Insights and Forecast - by Solution and Service
- 7.2.1. Desktop as a Service (DaaS)
- 7.2.2. Application as a Service (AaaS)
- 7.3. Market Analysis, Insights and Forecast - by Enterprise
- 7.3.1. Small and Medium Enterprises
- 7.3.2. Large Enterprises
- 7.4. Market Analysis, Insights and Forecast - by End-user Vertical
- 7.4.1. Banking, Financial Services and Insurance (BFSI)
- 7.4.2. Education
- 7.4.3. Retail
- 7.4.4. Government
- 7.4.5. Telecom and IT
- 7.4.6. Healthcare
- 7.4.7. Other End-user Verticals
- 7.1. Market Analysis, Insights and Forecast - by Deployment
- 8. Asia Pacific WaaS as a Service Industry Analysis, Insights and Forecast, 2019-2031
- 8.1. Market Analysis, Insights and Forecast - by Deployment
- 8.1.1. Public
- 8.1.2. Private
- 8.1.3. Hybrid
- 8.2. Market Analysis, Insights and Forecast - by Solution and Service
- 8.2.1. Desktop as a Service (DaaS)
- 8.2.2. Application as a Service (AaaS)
- 8.3. Market Analysis, Insights and Forecast - by Enterprise
- 8.3.1. Small and Medium Enterprises
- 8.3.2. Large Enterprises
- 8.4. Market Analysis, Insights and Forecast - by End-user Vertical
- 8.4.1. Banking, Financial Services and Insurance (BFSI)
- 8.4.2. Education
- 8.4.3. Retail
- 8.4.4. Government
- 8.4.5. Telecom and IT
- 8.4.6. Healthcare
- 8.4.7. Other End-user Verticals
- 8.1. Market Analysis, Insights and Forecast - by Deployment
- 9. Latin America WaaS as a Service Industry Analysis, Insights and Forecast, 2019-2031
- 9.1. Market Analysis, Insights and Forecast - by Deployment
- 9.1.1. Public
- 9.1.2. Private
- 9.1.3. Hybrid
- 9.2. Market Analysis, Insights and Forecast - by Solution and Service
- 9.2.1. Desktop as a Service (DaaS)
- 9.2.2. Application as a Service (AaaS)
- 9.3. Market Analysis, Insights and Forecast - by Enterprise
- 9.3.1. Small and Medium Enterprises
- 9.3.2. Large Enterprises
- 9.4. Market Analysis, Insights and Forecast - by End-user Vertical
- 9.4.1. Banking, Financial Services and Insurance (BFSI)
- 9.4.2. Education
- 9.4.3. Retail
- 9.4.4. Government
- 9.4.5. Telecom and IT
- 9.4.6. Healthcare
- 9.4.7. Other End-user Verticals
- 9.1. Market Analysis, Insights and Forecast - by Deployment
- 10. Middle East WaaS as a Service Industry Analysis, Insights and Forecast, 2019-2031
- 10.1. Market Analysis, Insights and Forecast - by Deployment
- 10.1.1. Public
- 10.1.2. Private
- 10.1.3. Hybrid
- 10.2. Market Analysis, Insights and Forecast - by Solution and Service
- 10.2.1. Desktop as a Service (DaaS)
- 10.2.2. Application as a Service (AaaS)
- 10.3. Market Analysis, Insights and Forecast - by Enterprise
- 10.3.1. Small and Medium Enterprises
- 10.3.2. Large Enterprises
- 10.4. Market Analysis, Insights and Forecast - by End-user Vertical
- 10.4.1. Banking, Financial Services and Insurance (BFSI)
- 10.4.2. Education
- 10.4.3. Retail
- 10.4.4. Government
- 10.4.5. Telecom and IT
- 10.4.6. Healthcare
- 10.4.7. Other End-user Verticals
- 10.1. Market Analysis, Insights and Forecast - by Deployment
- 11. North America WaaS as a Service Industry Analysis, Insights and Forecast, 2019-2031
- 11.1. Market Analysis, Insights and Forecast - By Country/Sub-region
- 11.1.1 United States
- 11.1.2 Canada
- 11.1.3 Mexico
- 12. Europe WaaS as a Service Industry Analysis, Insights and Forecast, 2019-2031
- 12.1. Market Analysis, Insights and Forecast - By Country/Sub-region
- 12.1.1 Germany
- 12.1.2 United Kingdom
- 12.1.3 France
- 12.1.4 Spain
- 12.1.5 Italy
- 12.1.6 Spain
- 12.1.7 Belgium
- 12.1.8 Netherland
- 12.1.9 Nordics
- 12.1.10 Rest of Europe
- 13. Asia Pacific WaaS as a Service Industry Analysis, Insights and Forecast, 2019-2031
- 13.1. Market Analysis, Insights and Forecast - By Country/Sub-region
- 13.1.1 China
- 13.1.2 Japan
- 13.1.3 India
- 13.1.4 South Korea
- 13.1.5 Southeast Asia
- 13.1.6 Australia
- 13.1.7 Indonesia
- 13.1.8 Phillipes
- 13.1.9 Singapore
- 13.1.10 Thailandc
- 13.1.11 Rest of Asia Pacific
- 14. South America WaaS as a Service Industry Analysis, Insights and Forecast, 2019-2031
- 14.1. Market Analysis, Insights and Forecast - By Country/Sub-region
- 14.1.1 Brazil
- 14.1.2 Argentina
- 14.1.3 Peru
- 14.1.4 Chile
- 14.1.5 Colombia
- 14.1.6 Ecuador
- 14.1.7 Venezuela
- 14.1.8 Rest of South America
- 15. North America WaaS as a Service Industry Analysis, Insights and Forecast, 2019-2031
- 15.1. Market Analysis, Insights and Forecast - By Country/Sub-region
- 15.1.1 United States
- 15.1.2 Canada
- 15.1.3 Mexico
- 16. MEA WaaS as a Service Industry Analysis, Insights and Forecast, 2019-2031
- 16.1. Market Analysis, Insights and Forecast - By Country/Sub-region
- 16.1.1 United Arab Emirates
- 16.1.2 Saudi Arabia
- 16.1.3 South Africa
- 16.1.4 Rest of Middle East and Africa
- 17. Competitive Analysis
- 17.1. Global Market Share Analysis 2024
- 17.2. Company Profiles
- 17.2.1 Cloudalize NV
- 17.2.1.1. Overview
- 17.2.1.2. Products
- 17.2.1.3. SWOT Analysis
- 17.2.1.4. Recent Developments
- 17.2.1.5. Financials (Based on Availability)
- 17.2.2 Unisys Corporation
- 17.2.2.1. Overview
- 17.2.2.2. Products
- 17.2.2.3. SWOT Analysis
- 17.2.2.4. Recent Developments
- 17.2.2.5. Financials (Based on Availability)
- 17.2.3 Getronics NV
- 17.2.3.1. Overview
- 17.2.3.2. Products
- 17.2.3.3. SWOT Analysis
- 17.2.3.4. Recent Developments
- 17.2.3.5. Financials (Based on Availability)
- 17.2.4 Dizzion Inc
- 17.2.4.1. Overview
- 17.2.4.2. Products
- 17.2.4.3. SWOT Analysis
- 17.2.4.4. Recent Developments
- 17.2.4.5. Financials (Based on Availability)
- 17.2.5 NTT DATA Corporation
- 17.2.5.1. Overview
- 17.2.5.2. Products
- 17.2.5.3. SWOT Analysis
- 17.2.5.4. Recent Developments
- 17.2.5.5. Financials (Based on Availability)
- 17.2.6 Microsoft Corporation
- 17.2.6.1. Overview
- 17.2.6.2. Products
- 17.2.6.3. SWOT Analysis
- 17.2.6.4. Recent Developments
- 17.2.6.5. Financials (Based on Availability)
- 17.2.7 Amazon Web Services Inc
- 17.2.7.1. Overview
- 17.2.7.2. Products
- 17.2.7.3. SWOT Analysis
- 17.2.7.4. Recent Developments
- 17.2.7.5. Financials (Based on Availability)
- 17.2.8 Colt Technology Services
- 17.2.8.1. Overview
- 17.2.8.2. Products
- 17.2.8.3. SWOT Analysis
- 17.2.8.4. Recent Developments
- 17.2.8.5. Financials (Based on Availability)
- 17.2.9 VMware Inc
- 17.2.9.1. Overview
- 17.2.9.2. Products
- 17.2.9.3. SWOT Analysis
- 17.2.9.4. Recent Developments
- 17.2.9.5. Financials (Based on Availability)
- 17.2.10 Citrix Systems Inc
- 17.2.10.1. Overview
- 17.2.10.2. Products
- 17.2.10.3. SWOT Analysis
- 17.2.10.4. Recent Developments
- 17.2.10.5. Financials (Based on Availability)
- 17.2.1 Cloudalize NV
List of Figures
- Figure 1: Global WaaS as a Service Industry Revenue Breakdown (Million, %) by Region 2024 & 2032
- Figure 2: Global WaaS as a Service Industry Volume Breakdown (K Unit, %) by Region 2024 & 2032
- Figure 3: North America WaaS as a Service Industry Revenue (Million), by Country 2024 & 2032
- Figure 4: North America WaaS as a Service Industry Volume (K Unit), by Country 2024 & 2032
- Figure 5: North America WaaS as a Service Industry Revenue Share (%), by Country 2024 & 2032
- Figure 6: North America WaaS as a Service Industry Volume Share (%), by Country 2024 & 2032
- Figure 7: Europe WaaS as a Service Industry Revenue (Million), by Country 2024 & 2032
- Figure 8: Europe WaaS as a Service Industry Volume (K Unit), by Country 2024 & 2032
- Figure 9: Europe WaaS as a Service Industry Revenue Share (%), by Country 2024 & 2032
- Figure 10: Europe WaaS as a Service Industry Volume Share (%), by Country 2024 & 2032
- Figure 11: Asia Pacific WaaS as a Service Industry Revenue (Million), by Country 2024 & 2032
- Figure 12: Asia Pacific WaaS as a Service Industry Volume (K Unit), by Country 2024 & 2032
- Figure 13: Asia Pacific WaaS as a Service Industry Revenue Share (%), by Country 2024 & 2032
- Figure 14: Asia Pacific WaaS as a Service Industry Volume Share (%), by Country 2024 & 2032
- Figure 15: South America WaaS as a Service Industry Revenue (Million), by Country 2024 & 2032
- Figure 16: South America WaaS as a Service Industry Volume (K Unit), by Country 2024 & 2032
- Figure 17: South America WaaS as a Service Industry Revenue Share (%), by Country 2024 & 2032
- Figure 18: South America WaaS as a Service Industry Volume Share (%), by Country 2024 & 2032
- Figure 19: North America WaaS as a Service Industry Revenue (Million), by Country 2024 & 2032
- Figure 20: North America WaaS as a Service Industry Volume (K Unit), by Country 2024 & 2032
- Figure 21: North America WaaS as a Service Industry Revenue Share (%), by Country 2024 & 2032
- Figure 22: North America WaaS as a Service Industry Volume Share (%), by Country 2024 & 2032
- Figure 23: MEA WaaS as a Service Industry Revenue (Million), by Country 2024 & 2032
- Figure 24: MEA WaaS as a Service Industry Volume (K Unit), by Country 2024 & 2032
- Figure 25: MEA WaaS as a Service Industry Revenue Share (%), by Country 2024 & 2032
- Figure 26: MEA WaaS as a Service Industry Volume Share (%), by Country 2024 & 2032
- Figure 27: North America WaaS as a Service Industry Revenue (Million), by Deployment 2024 & 2032
- Figure 28: North America WaaS as a Service Industry Volume (K Unit), by Deployment 2024 & 2032
- Figure 29: North America WaaS as a Service Industry Revenue Share (%), by Deployment 2024 & 2032
- Figure 30: North America WaaS as a Service Industry Volume Share (%), by Deployment 2024 & 2032
- Figure 31: North America WaaS as a Service Industry Revenue (Million), by Solution and Service 2024 & 2032
- Figure 32: North America WaaS as a Service Industry Volume (K Unit), by Solution and Service 2024 & 2032
- Figure 33: North America WaaS as a Service Industry Revenue Share (%), by Solution and Service 2024 & 2032
- Figure 34: North America WaaS as a Service Industry Volume Share (%), by Solution and Service 2024 & 2032
- Figure 35: North America WaaS as a Service Industry Revenue (Million), by Enterprise 2024 & 2032
- Figure 36: North America WaaS as a Service Industry Volume (K Unit), by Enterprise 2024 & 2032
- Figure 37: North America WaaS as a Service Industry Revenue Share (%), by Enterprise 2024 & 2032
- Figure 38: North America WaaS as a Service Industry Volume Share (%), by Enterprise 2024 & 2032
- Figure 39: North America WaaS as a Service Industry Revenue (Million), by End-user Vertical 2024 & 2032
- Figure 40: North America WaaS as a Service Industry Volume (K Unit), by End-user Vertical 2024 & 2032
- Figure 41: North America WaaS as a Service Industry Revenue Share (%), by End-user Vertical 2024 & 2032
- Figure 42: North America WaaS as a Service Industry Volume Share (%), by End-user Vertical 2024 & 2032
- Figure 43: North America WaaS as a Service Industry Revenue (Million), by Country 2024 & 2032
- Figure 44: North America WaaS as a Service Industry Volume (K Unit), by Country 2024 & 2032
- Figure 45: North America WaaS as a Service Industry Revenue Share (%), by Country 2024 & 2032
- Figure 46: North America WaaS as a Service Industry Volume Share (%), by Country 2024 & 2032
- Figure 47: Europe WaaS as a Service Industry Revenue (Million), by Deployment 2024 & 2032
- Figure 48: Europe WaaS as a Service Industry Volume (K Unit), by Deployment 2024 & 2032
- Figure 49: Europe WaaS as a Service Industry Revenue Share (%), by Deployment 2024 & 2032
- Figure 50: Europe WaaS as a Service Industry Volume Share (%), by Deployment 2024 & 2032
- Figure 51: Europe WaaS as a Service Industry Revenue (Million), by Solution and Service 2024 & 2032
- Figure 52: Europe WaaS as a Service Industry Volume (K Unit), by Solution and Service 2024 & 2032
- Figure 53: Europe WaaS as a Service Industry Revenue Share (%), by Solution and Service 2024 & 2032
- Figure 54: Europe WaaS as a Service Industry Volume Share (%), by Solution and Service 2024 & 2032
- Figure 55: Europe WaaS as a Service Industry Revenue (Million), by Enterprise 2024 & 2032
- Figure 56: Europe WaaS as a Service Industry Volume (K Unit), by Enterprise 2024 & 2032
- Figure 57: Europe WaaS as a Service Industry Revenue Share (%), by Enterprise 2024 & 2032
- Figure 58: Europe WaaS as a Service Industry Volume Share (%), by Enterprise 2024 & 2032
- Figure 59: Europe WaaS as a Service Industry Revenue (Million), by End-user Vertical 2024 & 2032
- Figure 60: Europe WaaS as a Service Industry Volume (K Unit), by End-user Vertical 2024 & 2032
- Figure 61: Europe WaaS as a Service Industry Revenue Share (%), by End-user Vertical 2024 & 2032
- Figure 62: Europe WaaS as a Service Industry Volume Share (%), by End-user Vertical 2024 & 2032
- Figure 63: Europe WaaS as a Service Industry Revenue (Million), by Country 2024 & 2032
- Figure 64: Europe WaaS as a Service Industry Volume (K Unit), by Country 2024 & 2032
- Figure 65: Europe WaaS as a Service Industry Revenue Share (%), by Country 2024 & 2032
- Figure 66: Europe WaaS as a Service Industry Volume Share (%), by Country 2024 & 2032
- Figure 67: Asia Pacific WaaS as a Service Industry Revenue (Million), by Deployment 2024 & 2032
- Figure 68: Asia Pacific WaaS as a Service Industry Volume (K Unit), by Deployment 2024 & 2032
- Figure 69: Asia Pacific WaaS as a Service Industry Revenue Share (%), by Deployment 2024 & 2032
- Figure 70: Asia Pacific WaaS as a Service Industry Volume Share (%), by Deployment 2024 & 2032
- Figure 71: Asia Pacific WaaS as a Service Industry Revenue (Million), by Solution and Service 2024 & 2032
- Figure 72: Asia Pacific WaaS as a Service Industry Volume (K Unit), by Solution and Service 2024 & 2032
- Figure 73: Asia Pacific WaaS as a Service Industry Revenue Share (%), by Solution and Service 2024 & 2032
- Figure 74: Asia Pacific WaaS as a Service Industry Volume Share (%), by Solution and Service 2024 & 2032
- Figure 75: Asia Pacific WaaS as a Service Industry Revenue (Million), by Enterprise 2024 & 2032
- Figure 76: Asia Pacific WaaS as a Service Industry Volume (K Unit), by Enterprise 2024 & 2032
- Figure 77: Asia Pacific WaaS as a Service Industry Revenue Share (%), by Enterprise 2024 & 2032
- Figure 78: Asia Pacific WaaS as a Service Industry Volume Share (%), by Enterprise 2024 & 2032
- Figure 79: Asia Pacific WaaS as a Service Industry Revenue (Million), by End-user Vertical 2024 & 2032
- Figure 80: Asia Pacific WaaS as a Service Industry Volume (K Unit), by End-user Vertical 2024 & 2032
- Figure 81: Asia Pacific WaaS as a Service Industry Revenue Share (%), by End-user Vertical 2024 & 2032
- Figure 82: Asia Pacific WaaS as a Service Industry Volume Share (%), by End-user Vertical 2024 & 2032
- Figure 83: Asia Pacific WaaS as a Service Industry Revenue (Million), by Country 2024 & 2032
- Figure 84: Asia Pacific WaaS as a Service Industry Volume (K Unit), by Country 2024 & 2032
- Figure 85: Asia Pacific WaaS as a Service Industry Revenue Share (%), by Country 2024 & 2032
- Figure 86: Asia Pacific WaaS as a Service Industry Volume Share (%), by Country 2024 & 2032
- Figure 87: Latin America WaaS as a Service Industry Revenue (Million), by Deployment 2024 & 2032
- Figure 88: Latin America WaaS as a Service Industry Volume (K Unit), by Deployment 2024 & 2032
- Figure 89: Latin America WaaS as a Service Industry Revenue Share (%), by Deployment 2024 & 2032
- Figure 90: Latin America WaaS as a Service Industry Volume Share (%), by Deployment 2024 & 2032
- Figure 91: Latin America WaaS as a Service Industry Revenue (Million), by Solution and Service 2024 & 2032
- Figure 92: Latin America WaaS as a Service Industry Volume (K Unit), by Solution and Service 2024 & 2032
- Figure 93: Latin America WaaS as a Service Industry Revenue Share (%), by Solution and Service 2024 & 2032
- Figure 94: Latin America WaaS as a Service Industry Volume Share (%), by Solution and Service 2024 & 2032
- Figure 95: Latin America WaaS as a Service Industry Revenue (Million), by Enterprise 2024 & 2032
- Figure 96: Latin America WaaS as a Service Industry Volume (K Unit), by Enterprise 2024 & 2032
- Figure 97: Latin America WaaS as a Service Industry Revenue Share (%), by Enterprise 2024 & 2032
- Figure 98: Latin America WaaS as a Service Industry Volume Share (%), by Enterprise 2024 & 2032
- Figure 99: Latin America WaaS as a Service Industry Revenue (Million), by End-user Vertical 2024 & 2032
- Figure 100: Latin America WaaS as a Service Industry Volume (K Unit), by End-user Vertical 2024 & 2032
- Figure 101: Latin America WaaS as a Service Industry Revenue Share (%), by End-user Vertical 2024 & 2032
- Figure 102: Latin America WaaS as a Service Industry Volume Share (%), by End-user Vertical 2024 & 2032
- Figure 103: Latin America WaaS as a Service Industry Revenue (Million), by Country 2024 & 2032
- Figure 104: Latin America WaaS as a Service Industry Volume (K Unit), by Country 2024 & 2032
- Figure 105: Latin America WaaS as a Service Industry Revenue Share (%), by Country 2024 & 2032
- Figure 106: Latin America WaaS as a Service Industry Volume Share (%), by Country 2024 & 2032
- Figure 107: Middle East WaaS as a Service Industry Revenue (Million), by Deployment 2024 & 2032
- Figure 108: Middle East WaaS as a Service Industry Volume (K Unit), by Deployment 2024 & 2032
- Figure 109: Middle East WaaS as a Service Industry Revenue Share (%), by Deployment 2024 & 2032
- Figure 110: Middle East WaaS as a Service Industry Volume Share (%), by Deployment 2024 & 2032
- Figure 111: Middle East WaaS as a Service Industry Revenue (Million), by Solution and Service 2024 & 2032
- Figure 112: Middle East WaaS as a Service Industry Volume (K Unit), by Solution and Service 2024 & 2032
- Figure 113: Middle East WaaS as a Service Industry Revenue Share (%), by Solution and Service 2024 & 2032
- Figure 114: Middle East WaaS as a Service Industry Volume Share (%), by Solution and Service 2024 & 2032
- Figure 115: Middle East WaaS as a Service Industry Revenue (Million), by Enterprise 2024 & 2032
- Figure 116: Middle East WaaS as a Service Industry Volume (K Unit), by Enterprise 2024 & 2032
- Figure 117: Middle East WaaS as a Service Industry Revenue Share (%), by Enterprise 2024 & 2032
- Figure 118: Middle East WaaS as a Service Industry Volume Share (%), by Enterprise 2024 & 2032
- Figure 119: Middle East WaaS as a Service Industry Revenue (Million), by End-user Vertical 2024 & 2032
- Figure 120: Middle East WaaS as a Service Industry Volume (K Unit), by End-user Vertical 2024 & 2032
- Figure 121: Middle East WaaS as a Service Industry Revenue Share (%), by End-user Vertical 2024 & 2032
- Figure 122: Middle East WaaS as a Service Industry Volume Share (%), by End-user Vertical 2024 & 2032
- Figure 123: Middle East WaaS as a Service Industry Revenue (Million), by Country 2024 & 2032
- Figure 124: Middle East WaaS as a Service Industry Volume (K Unit), by Country 2024 & 2032
- Figure 125: Middle East WaaS as a Service Industry Revenue Share (%), by Country 2024 & 2032
- Figure 126: Middle East WaaS as a Service Industry Volume Share (%), by Country 2024 & 2032
List of Tables
- Table 1: Global WaaS as a Service Industry Revenue Million Forecast, by Region 2019 & 2032
- Table 2: Global WaaS as a Service Industry Volume K Unit Forecast, by Region 2019 & 2032
- Table 3: Global WaaS as a Service Industry Revenue Million Forecast, by Deployment 2019 & 2032
- Table 4: Global WaaS as a Service Industry Volume K Unit Forecast, by Deployment 2019 & 2032
- Table 5: Global WaaS as a Service Industry Revenue Million Forecast, by Solution and Service 2019 & 2032
- Table 6: Global WaaS as a Service Industry Volume K Unit Forecast, by Solution and Service 2019 & 2032
- Table 7: Global WaaS as a Service Industry Revenue Million Forecast, by Enterprise 2019 & 2032
- Table 8: Global WaaS as a Service Industry Volume K Unit Forecast, by Enterprise 2019 & 2032
- Table 9: Global WaaS as a Service Industry Revenue Million Forecast, by End-user Vertical 2019 & 2032
- Table 10: Global WaaS as a Service Industry Volume K Unit Forecast, by End-user Vertical 2019 & 2032
- Table 11: Global WaaS as a Service Industry Revenue Million Forecast, by Region 2019 & 2032
- Table 12: Global WaaS as a Service Industry Volume K Unit Forecast, by Region 2019 & 2032
- Table 13: Global WaaS as a Service Industry Revenue Million Forecast, by Country 2019 & 2032
- Table 14: Global WaaS as a Service Industry Volume K Unit Forecast, by Country 2019 & 2032
- Table 15: United States WaaS as a Service Industry Revenue (Million) Forecast, by Application 2019 & 2032
- Table 16: United States WaaS as a Service Industry Volume (K Unit) Forecast, by Application 2019 & 2032
- Table 17: Canada WaaS as a Service Industry Revenue (Million) Forecast, by Application 2019 & 2032
- Table 18: Canada WaaS as a Service Industry Volume (K Unit) Forecast, by Application 2019 & 2032
- Table 19: Mexico WaaS as a Service Industry Revenue (Million) Forecast, by Application 2019 & 2032
- Table 20: Mexico WaaS as a Service Industry Volume (K Unit) Forecast, by Application 2019 & 2032
- Table 21: Global WaaS as a Service Industry Revenue Million Forecast, by Country 2019 & 2032
- Table 22: Global WaaS as a Service Industry Volume K Unit Forecast, by Country 2019 & 2032
- Table 23: Germany WaaS as a Service Industry Revenue (Million) Forecast, by Application 2019 & 2032
- Table 24: Germany WaaS as a Service Industry Volume (K Unit) Forecast, by Application 2019 & 2032
- Table 25: United Kingdom WaaS as a Service Industry Revenue (Million) Forecast, by Application 2019 & 2032
- Table 26: United Kingdom WaaS as a Service Industry Volume (K Unit) Forecast, by Application 2019 & 2032
- Table 27: France WaaS as a Service Industry Revenue (Million) Forecast, by Application 2019 & 2032
- Table 28: France WaaS as a Service Industry Volume (K Unit) Forecast, by Application 2019 & 2032
- Table 29: Spain WaaS as a Service Industry Revenue (Million) Forecast, by Application 2019 & 2032
- Table 30: Spain WaaS as a Service Industry Volume (K Unit) Forecast, by Application 2019 & 2032
- Table 31: Italy WaaS as a Service Industry Revenue (Million) Forecast, by Application 2019 & 2032
- Table 32: Italy WaaS as a Service Industry Volume (K Unit) Forecast, by Application 2019 & 2032
- Table 33: Spain WaaS as a Service Industry Revenue (Million) Forecast, by Application 2019 & 2032
- Table 34: Spain WaaS as a Service Industry Volume (K Unit) Forecast, by Application 2019 & 2032
- Table 35: Belgium WaaS as a Service Industry Revenue (Million) Forecast, by Application 2019 & 2032
- Table 36: Belgium WaaS as a Service Industry Volume (K Unit) Forecast, by Application 2019 & 2032
- Table 37: Netherland WaaS as a Service Industry Revenue (Million) Forecast, by Application 2019 & 2032
- Table 38: Netherland WaaS as a Service Industry Volume (K Unit) Forecast, by Application 2019 & 2032
- Table 39: Nordics WaaS as a Service Industry Revenue (Million) Forecast, by Application 2019 & 2032
- Table 40: Nordics WaaS as a Service Industry Volume (K Unit) Forecast, by Application 2019 & 2032
- Table 41: Rest of Europe WaaS as a Service Industry Revenue (Million) Forecast, by Application 2019 & 2032
- Table 42: Rest of Europe WaaS as a Service Industry Volume (K Unit) Forecast, by Application 2019 & 2032
- Table 43: Global WaaS as a Service Industry Revenue Million Forecast, by Country 2019 & 2032
- Table 44: Global WaaS as a Service Industry Volume K Unit Forecast, by Country 2019 & 2032
- Table 45: China WaaS as a Service Industry Revenue (Million) Forecast, by Application 2019 & 2032
- Table 46: China WaaS as a Service Industry Volume (K Unit) Forecast, by Application 2019 & 2032
- Table 47: Japan WaaS as a Service Industry Revenue (Million) Forecast, by Application 2019 & 2032
- Table 48: Japan WaaS as a Service Industry Volume (K Unit) Forecast, by Application 2019 & 2032
- Table 49: India WaaS as a Service Industry Revenue (Million) Forecast, by Application 2019 & 2032
- Table 50: India WaaS as a Service Industry Volume (K Unit) Forecast, by Application 2019 & 2032
- Table 51: South Korea WaaS as a Service Industry Revenue (Million) Forecast, by Application 2019 & 2032
- Table 52: South Korea WaaS as a Service Industry Volume (K Unit) Forecast, by Application 2019 & 2032
- Table 53: Southeast Asia WaaS as a Service Industry Revenue (Million) Forecast, by Application 2019 & 2032
- Table 54: Southeast Asia WaaS as a Service Industry Volume (K Unit) Forecast, by Application 2019 & 2032
- Table 55: Australia WaaS as a Service Industry Revenue (Million) Forecast, by Application 2019 & 2032
- Table 56: Australia WaaS as a Service Industry Volume (K Unit) Forecast, by Application 2019 & 2032
- Table 57: Indonesia WaaS as a Service Industry Revenue (Million) Forecast, by Application 2019 & 2032
- Table 58: Indonesia WaaS as a Service Industry Volume (K Unit) Forecast, by Application 2019 & 2032
- Table 59: Phillipes WaaS as a Service Industry Revenue (Million) Forecast, by Application 2019 & 2032
- Table 60: Phillipes WaaS as a Service Industry Volume (K Unit) Forecast, by Application 2019 & 2032
- Table 61: Singapore WaaS as a Service Industry Revenue (Million) Forecast, by Application 2019 & 2032
- Table 62: Singapore WaaS as a Service Industry Volume (K Unit) Forecast, by Application 2019 & 2032
- Table 63: Thailandc WaaS as a Service Industry Revenue (Million) Forecast, by Application 2019 & 2032
- Table 64: Thailandc WaaS as a Service Industry Volume (K Unit) Forecast, by Application 2019 & 2032
- Table 65: Rest of Asia Pacific WaaS as a Service Industry Revenue (Million) Forecast, by Application 2019 & 2032
- Table 66: Rest of Asia Pacific WaaS as a Service Industry Volume (K Unit) Forecast, by Application 2019 & 2032
- Table 67: Global WaaS as a Service Industry Revenue Million Forecast, by Country 2019 & 2032
- Table 68: Global WaaS as a Service Industry Volume K Unit Forecast, by Country 2019 & 2032
- Table 69: Brazil WaaS as a Service Industry Revenue (Million) Forecast, by Application 2019 & 2032
- Table 70: Brazil WaaS as a Service Industry Volume (K Unit) Forecast, by Application 2019 & 2032
- Table 71: Argentina WaaS as a Service Industry Revenue (Million) Forecast, by Application 2019 & 2032
- Table 72: Argentina WaaS as a Service Industry Volume (K Unit) Forecast, by Application 2019 & 2032
- Table 73: Peru WaaS as a Service Industry Revenue (Million) Forecast, by Application 2019 & 2032
- Table 74: Peru WaaS as a Service Industry Volume (K Unit) Forecast, by Application 2019 & 2032
- Table 75: Chile WaaS as a Service Industry Revenue (Million) Forecast, by Application 2019 & 2032
- Table 76: Chile WaaS as a Service Industry Volume (K Unit) Forecast, by Application 2019 & 2032
- Table 77: Colombia WaaS as a Service Industry Revenue (Million) Forecast, by Application 2019 & 2032
- Table 78: Colombia WaaS as a Service Industry Volume (K Unit) Forecast, by Application 2019 & 2032
- Table 79: Ecuador WaaS as a Service Industry Revenue (Million) Forecast, by Application 2019 & 2032
- Table 80: Ecuador WaaS as a Service Industry Volume (K Unit) Forecast, by Application 2019 & 2032
- Table 81: Venezuela WaaS as a Service Industry Revenue (Million) Forecast, by Application 2019 & 2032
- Table 82: Venezuela WaaS as a Service Industry Volume (K Unit) Forecast, by Application 2019 & 2032
- Table 83: Rest of South America WaaS as a Service Industry Revenue (Million) Forecast, by Application 2019 & 2032
- Table 84: Rest of South America WaaS as a Service Industry Volume (K Unit) Forecast, by Application 2019 & 2032
- Table 85: Global WaaS as a Service Industry Revenue Million Forecast, by Country 2019 & 2032
- Table 86: Global WaaS as a Service Industry Volume K Unit Forecast, by Country 2019 & 2032
- Table 87: United States WaaS as a Service Industry Revenue (Million) Forecast, by Application 2019 & 2032
- Table 88: United States WaaS as a Service Industry Volume (K Unit) Forecast, by Application 2019 & 2032
- Table 89: Canada WaaS as a Service Industry Revenue (Million) Forecast, by Application 2019 & 2032
- Table 90: Canada WaaS as a Service Industry Volume (K Unit) Forecast, by Application 2019 & 2032
- Table 91: Mexico WaaS as a Service Industry Revenue (Million) Forecast, by Application 2019 & 2032
- Table 92: Mexico WaaS as a Service Industry Volume (K Unit) Forecast, by Application 2019 & 2032
- Table 93: Global WaaS as a Service Industry Revenue Million Forecast, by Country 2019 & 2032
- Table 94: Global WaaS as a Service Industry Volume K Unit Forecast, by Country 2019 & 2032
- Table 95: United Arab Emirates WaaS as a Service Industry Revenue (Million) Forecast, by Application 2019 & 2032
- Table 96: United Arab Emirates WaaS as a Service Industry Volume (K Unit) Forecast, by Application 2019 & 2032
- Table 97: Saudi Arabia WaaS as a Service Industry Revenue (Million) Forecast, by Application 2019 & 2032
- Table 98: Saudi Arabia WaaS as a Service Industry Volume (K Unit) Forecast, by Application 2019 & 2032
- Table 99: South Africa WaaS as a Service Industry Revenue (Million) Forecast, by Application 2019 & 2032
- Table 100: South Africa WaaS as a Service Industry Volume (K Unit) Forecast, by Application 2019 & 2032
- Table 101: Rest of Middle East and Africa WaaS as a Service Industry Revenue (Million) Forecast, by Application 2019 & 2032
- Table 102: Rest of Middle East and Africa WaaS as a Service Industry Volume (K Unit) Forecast, by Application 2019 & 2032
- Table 103: Global WaaS as a Service Industry Revenue Million Forecast, by Deployment 2019 & 2032
- Table 104: Global WaaS as a Service Industry Volume K Unit Forecast, by Deployment 2019 & 2032
- Table 105: Global WaaS as a Service Industry Revenue Million Forecast, by Solution and Service 2019 & 2032
- Table 106: Global WaaS as a Service Industry Volume K Unit Forecast, by Solution and Service 2019 & 2032
- Table 107: Global WaaS as a Service Industry Revenue Million Forecast, by Enterprise 2019 & 2032
- Table 108: Global WaaS as a Service Industry Volume K Unit Forecast, by Enterprise 2019 & 2032
- Table 109: Global WaaS as a Service Industry Revenue Million Forecast, by End-user Vertical 2019 & 2032
- Table 110: Global WaaS as a Service Industry Volume K Unit Forecast, by End-user Vertical 2019 & 2032
- Table 111: Global WaaS as a Service Industry Revenue Million Forecast, by Country 2019 & 2032
- Table 112: Global WaaS as a Service Industry Volume K Unit Forecast, by Country 2019 & 2032
- Table 113: Global WaaS as a Service Industry Revenue Million Forecast, by Deployment 2019 & 2032
- Table 114: Global WaaS as a Service Industry Volume K Unit Forecast, by Deployment 2019 & 2032
- Table 115: Global WaaS as a Service Industry Revenue Million Forecast, by Solution and Service 2019 & 2032
- Table 116: Global WaaS as a Service Industry Volume K Unit Forecast, by Solution and Service 2019 & 2032
- Table 117: Global WaaS as a Service Industry Revenue Million Forecast, by Enterprise 2019 & 2032
- Table 118: Global WaaS as a Service Industry Volume K Unit Forecast, by Enterprise 2019 & 2032
- Table 119: Global WaaS as a Service Industry Revenue Million Forecast, by End-user Vertical 2019 & 2032
- Table 120: Global WaaS as a Service Industry Volume K Unit Forecast, by End-user Vertical 2019 & 2032
- Table 121: Global WaaS as a Service Industry Revenue Million Forecast, by Country 2019 & 2032
- Table 122: Global WaaS as a Service Industry Volume K Unit Forecast, by Country 2019 & 2032
- Table 123: Global WaaS as a Service Industry Revenue Million Forecast, by Deployment 2019 & 2032
- Table 124: Global WaaS as a Service Industry Volume K Unit Forecast, by Deployment 2019 & 2032
- Table 125: Global WaaS as a Service Industry Revenue Million Forecast, by Solution and Service 2019 & 2032
- Table 126: Global WaaS as a Service Industry Volume K Unit Forecast, by Solution and Service 2019 & 2032
- Table 127: Global WaaS as a Service Industry Revenue Million Forecast, by Enterprise 2019 & 2032
- Table 128: Global WaaS as a Service Industry Volume K Unit Forecast, by Enterprise 2019 & 2032
- Table 129: Global WaaS as a Service Industry Revenue Million Forecast, by End-user Vertical 2019 & 2032
- Table 130: Global WaaS as a Service Industry Volume K Unit Forecast, by End-user Vertical 2019 & 2032
- Table 131: Global WaaS as a Service Industry Revenue Million Forecast, by Country 2019 & 2032
- Table 132: Global WaaS as a Service Industry Volume K Unit Forecast, by Country 2019 & 2032
- Table 133: Global WaaS as a Service Industry Revenue Million Forecast, by Deployment 2019 & 2032
- Table 134: Global WaaS as a Service Industry Volume K Unit Forecast, by Deployment 2019 & 2032
- Table 135: Global WaaS as a Service Industry Revenue Million Forecast, by Solution and Service 2019 & 2032
- Table 136: Global WaaS as a Service Industry Volume K Unit Forecast, by Solution and Service 2019 & 2032
- Table 137: Global WaaS as a Service Industry Revenue Million Forecast, by Enterprise 2019 & 2032
- Table 138: Global WaaS as a Service Industry Volume K Unit Forecast, by Enterprise 2019 & 2032
- Table 139: Global WaaS as a Service Industry Revenue Million Forecast, by End-user Vertical 2019 & 2032
- Table 140: Global WaaS as a Service Industry Volume K Unit Forecast, by End-user Vertical 2019 & 2032
- Table 141: Global WaaS as a Service Industry Revenue Million Forecast, by Country 2019 & 2032
- Table 142: Global WaaS as a Service Industry Volume K Unit Forecast, by Country 2019 & 2032
- Table 143: Global WaaS as a Service Industry Revenue Million Forecast, by Deployment 2019 & 2032
- Table 144: Global WaaS as a Service Industry Volume K Unit Forecast, by Deployment 2019 & 2032
- Table 145: Global WaaS as a Service Industry Revenue Million Forecast, by Solution and Service 2019 & 2032
- Table 146: Global WaaS as a Service Industry Volume K Unit Forecast, by Solution and Service 2019 & 2032
- Table 147: Global WaaS as a Service Industry Revenue Million Forecast, by Enterprise 2019 & 2032
- Table 148: Global WaaS as a Service Industry Volume K Unit Forecast, by Enterprise 2019 & 2032
- Table 149: Global WaaS as a Service Industry Revenue Million Forecast, by End-user Vertical 2019 & 2032
- Table 150: Global WaaS as a Service Industry Volume K Unit Forecast, by End-user Vertical 2019 & 2032
- Table 151: Global WaaS as a Service Industry Revenue Million Forecast, by Country 2019 & 2032
- Table 152: Global WaaS as a Service Industry Volume K Unit Forecast, by Country 2019 & 2032
Frequently Asked Questions
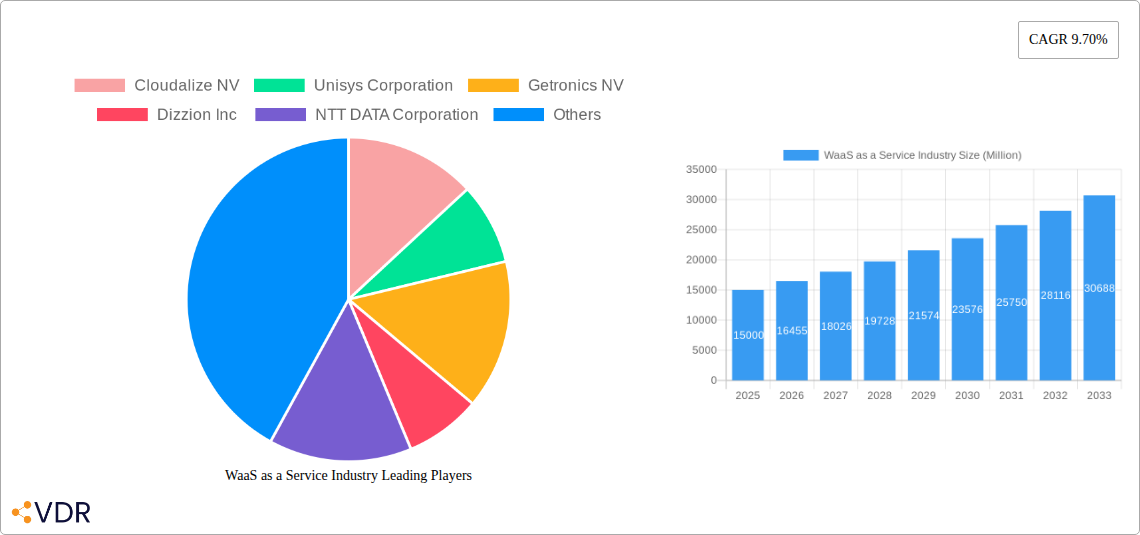
1. What is the projected Compound Annual Growth Rate (CAGR) of the WaaS as a Service Industry?
The projected CAGR is approximately 9.70%.
2. Which companies are prominent players in the WaaS as a Service Industry?
Key companies in the market include Cloudalize NV, Unisys Corporation, Getronics NV, Dizzion Inc , NTT DATA Corporation, Microsoft Corporation, Amazon Web Services Inc, Colt Technology Services, VMware Inc, Citrix Systems Inc.
3. What are the main segments of the WaaS as a Service Industry?
The market segments include Deployment, Solution and Service, Enterprise, End-user Vertical.
4. Can you provide details about the market size?
The market size is estimated to be USD XX Million as of 2022.
5. What are some drivers contributing to market growth?
Rising Adoption of BYOD across Various Industries; Increasing Demand for Affordable Desktop Virtualization Solutions.
6. What are the notable trends driving market growth?
Telecom and IT to hold a Major Market Share.
7. Are there any restraints impacting market growth?
Security Concerns Over Cloud Storage.
8. Can you provide examples of recent developments in the market?
April 2023, Bikanervala, a renowned Indian food chain, has launched a digital transformation by adopting Google Workspace with the aid of Google Cloud’s partner specializing in Google Workspace solutions. The move will enable the consumer to improve productivity, collaboration, and communication. Bikanervala stored information in files across numerous email systems, and they realized that this was not the most efficient way of storing and sharing information.
9. What pricing options are available for accessing the report?
Pricing options include single-user, multi-user, and enterprise licenses priced at USD 4750, USD 5250, and USD 8750 respectively.
10. Is the market size provided in terms of value or volume?
The market size is provided in terms of value, measured in Million and volume, measured in K Unit.
11. Are there any specific market keywords associated with the report?
Yes, the market keyword associated with the report is "WaaS as a Service Industry," which aids in identifying and referencing the specific market segment covered.
12. How do I determine which pricing option suits my needs best?
The pricing options vary based on user requirements and access needs. Individual users may opt for single-user licenses, while businesses requiring broader access may choose multi-user or enterprise licenses for cost-effective access to the report.
13. Are there any additional resources or data provided in the WaaS as a Service Industry report?
While the report offers comprehensive insights, it's advisable to review the specific contents or supplementary materials provided to ascertain if additional resources or data are available.
14. How can I stay updated on further developments or reports in the WaaS as a Service Industry?
To stay informed about further developments, trends, and reports in the WaaS as a Service Industry, consider subscribing to industry newsletters, following relevant companies and organizations, or regularly checking reputable industry news sources and publications.
Methodology
Step 1 - Identification of Relevant Samples Size from Population Database


Step 2 - Approaches for Defining Global Market Size (Value, Volume* & Price*)

Note*: In applicable scenarios
Step 3 - Data Sources
Primary Research
- Web Analytics
- Survey Reports
- Research Institute
- Latest Research Reports
- Opinion Leaders
Secondary Research
- Annual Reports
- White Paper
- Latest Press Release
- Industry Association
- Paid Database
- Investor Presentations

Step 4 - Data Triangulation
Involves using different sources of information in order to increase the validity of a study
These sources are likely to be stakeholders in a program - participants, other researchers, program staff, other community members, and so on.
Then we put all data in single framework & apply various statistical tools to find out the dynamic on the market.
During the analysis stage, feedback from the stakeholder groups would be compared to determine areas of agreement as well as areas of divergence


