
Key Insights
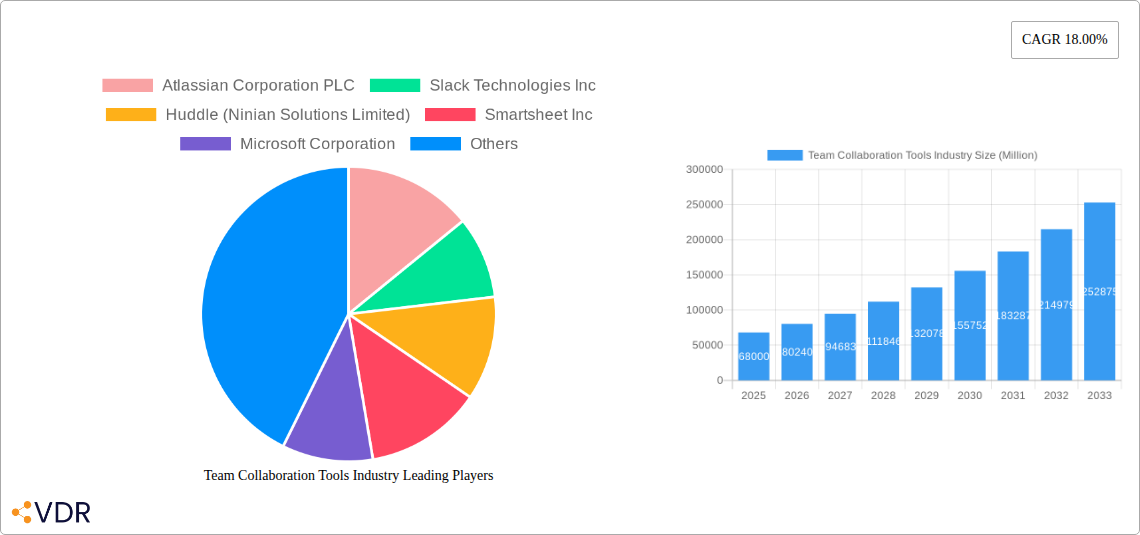
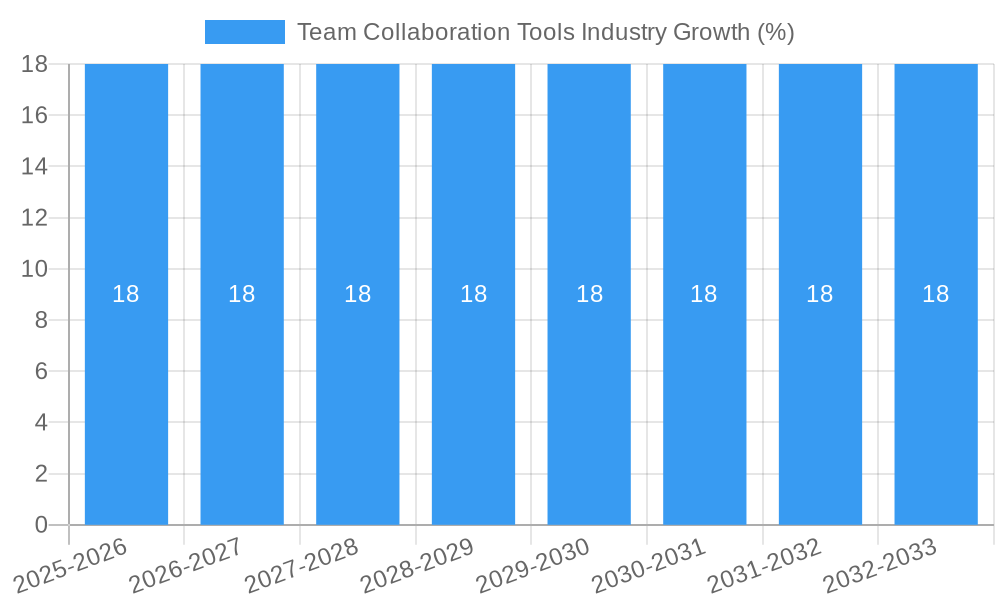
The global Team Collaboration Tools market is poised for substantial growth, projected to reach an estimated market size of USD 68,000 Million by 2025, expanding at a robust Compound Annual Growth Rate (CAGR) of 18.00% through 2033. This significant expansion is primarily driven by the escalating need for enhanced productivity, streamlined communication, and improved project management across organizations of all sizes. The widespread adoption of remote and hybrid work models has further accelerated demand, making digital collaboration platforms indispensable for seamless operations. Key drivers include the increasing complexity of modern projects, the growing global workforce, and the continuous evolution of technology that offers more integrated and intelligent collaboration features. Organizations are actively seeking solutions that foster better teamwork, facilitate real-time document sharing, and provide secure channels for communication, all of which contribute to a more efficient and agile work environment.
The market is characterized by a dynamic interplay of technological advancements and shifting organizational needs. Cloud-based deployment models are dominating the landscape, offering scalability, accessibility, and cost-effectiveness. However, on-premise solutions continue to hold relevance for organizations with stringent data security requirements. Both Small and Medium Enterprises (SMEs) and Large Enterprises are investing heavily in these tools to optimize their workflows and maintain a competitive edge. While the market benefits from strong growth drivers, certain restraints such as data security concerns and the initial cost of implementation for some advanced features could temper the pace of adoption in specific segments. Nevertheless, the overarching trend points towards an increasingly integrated and intelligent future for team collaboration, with a focus on AI-driven features, enhanced analytics, and a more personalized user experience. Key players like Atlassian, Microsoft, and Slack are at the forefront, continuously innovating to meet the evolving demands of the global workforce.
Gain unparalleled insights into the dynamic team collaboration software market with this comprehensive report, covering the period from 2019 to 2033, with a base year of 2025. This analysis dives deep into the critical factors driving growth, market segmentation, and future trends in workplace collaboration tools, project management software, and communication platforms. Essential for industry professionals, strategists, and investors seeking to understand the evolving landscape of digital teamwork solutions, this report provides data-driven forecasts and actionable intelligence. Explore how leading players like Atlassian Corporation PLC, Slack Technologies Inc., Smartsheet Inc., Microsoft Corporation, and Asana Inc. are shaping the future of remote work tools and online collaboration.
Team Collaboration Tools Industry Market Dynamics & Structure
The team collaboration tools industry exhibits a moderately concentrated market, characterized by the strategic dominance of a few key players alongside a growing number of specialized niche providers. Technological innovation serves as a primary driver, with continuous advancements in AI-powered features, integrated workflows, and enhanced security protocols pushing the boundaries of team productivity software. Regulatory frameworks are evolving, particularly concerning data privacy and cross-border collaboration, influencing platform development and adoption. Competitive product substitutes are abundant, ranging from basic messaging apps to comprehensive enterprise solutions, necessitating strong value propositions and differentiated offerings. End-user demographics are increasingly diverse, encompassing individuals, small and medium enterprises (SMEs), and large enterprises, each with distinct collaboration needs and adoption patterns. Mergers and acquisitions (M&A) are a significant trend, as larger companies strategically acquire innovative startups to expand their feature sets and market reach, consolidating market share.
- Market Concentration: Dominated by a few major vendors, but with emerging competitive pressure from innovative startups.
- Technological Innovation Drivers: AI integration, enhanced workflow automation, real-time communication enhancements, and advanced security features.
- Regulatory Frameworks: Growing importance of data privacy (e.g., GDPR, CCPA), cybersecurity compliance, and inter-organizational data sharing policies.
- Competitive Product Substitutes: Messaging apps, video conferencing tools, file-sharing services, and traditional project management software.
- End-User Demographics: Spanning freelancers, SMEs, and global enterprises, with a significant shift towards hybrid and remote work models.
- M&A Trends: Strategic acquisitions for feature enhancement, market expansion, and competitive consolidation. For example, the acquisition of Huddle (Ninian Solutions Limited) by a larger entity would significantly impact market share.
Team Collaboration Tools Industry Growth Trends & Insights
The team collaboration tools market is poised for robust expansion, driven by the pervasive adoption of hybrid and remote work models. The market size is projected to experience substantial growth, fueled by increasing demand for integrated solutions that streamline communication, enhance project management, and foster seamless teamwork. Adoption rates for advanced collaboration platforms are accelerating across all organization sizes, as businesses recognize the critical role of efficient digital collaboration in maintaining productivity and competitive edge. Technological disruptions, such as the integration of AI for task automation, intelligent insights, and personalized user experiences, are reshaping the competitive landscape. Consumer behavior shifts are evident, with a growing preference for user-friendly interfaces, mobile accessibility, and robust security features in online team tools. The compound annual growth rate (CAGR) is expected to be significant, reflecting a sustained demand for solutions that empower distributed workforces. Market penetration is deepening, moving beyond early adopters to become an essential component of operational infrastructure for businesses worldwide.
Dominant Regions, Countries, or Segments in Team Collaboration Tools Industry
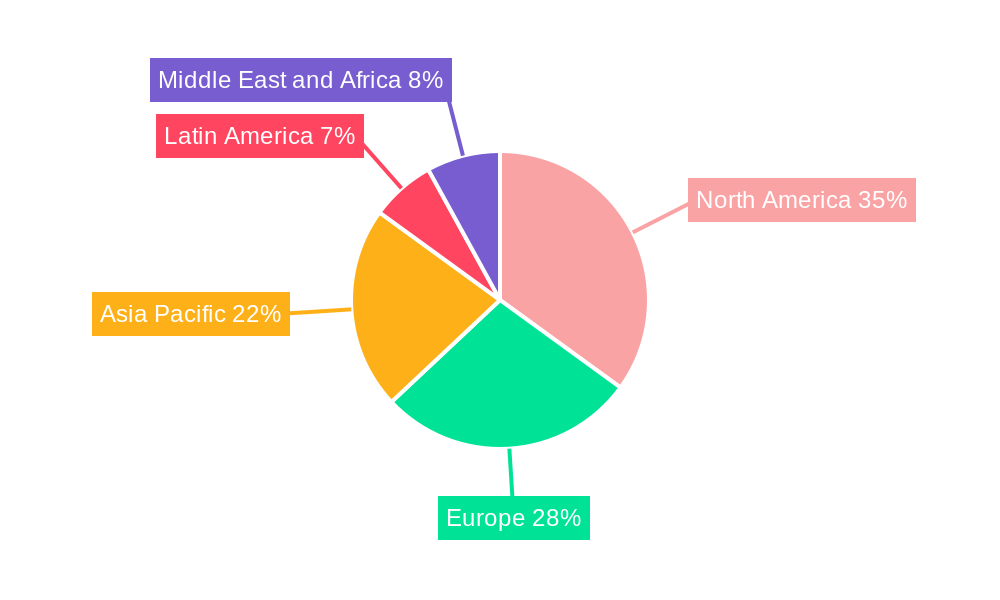
The Cloud deployment model is the undisputed leader in the team collaboration tools industry, driven by its inherent scalability, cost-effectiveness, and accessibility. This segment's dominance is further amplified by the global shift towards digital transformation and the increasing reliance on remote and hybrid work environments. North America, particularly the United States, stands out as the leading region due to its early adoption of advanced technologies, a robust ecosystem of tech companies, and significant investment in digital infrastructure. The presence of major players like Microsoft Corporation and Atlassian Corporation PLC in this region further solidifies its position.
For Organization Size, the Large Enterprises segment is a significant growth driver, characterized by substantial budgets allocated for comprehensive collaboration solutions and the complex coordination needs of distributed global teams. However, Small and Medium Enterprises (SMEs) are increasingly adopting these tools to compete effectively and scale their operations, representing a rapidly growing and crucial market segment. The agility and cost-consciousness of SMEs make cloud-based solutions particularly attractive.
- Dominant Deployment Type:
- Cloud: Superior scalability, flexibility, reduced IT overhead, and seamless remote access are key drivers. Market share is estimated to be around 85% of the total deployment market in the forecast period.
- Dominant Organization Size:
- Large Enterprises: Higher spending capacity, complex project management needs, and global workforce management requirements fuel demand. Projected to account for approximately 60% of the total market value in 2025.
- Small and Medium Enterprises (SMEs): Rapidly growing segment due to increasing digital adoption and cost-effective cloud solutions. Expected to witness a CAGR of xx% during the forecast period.
- Key Drivers in Dominant Segments:
- Economic Policies: Government initiatives promoting digital transformation and remote work infrastructure.
- Infrastructure: Widespread availability of high-speed internet and cloud computing resources.
- Technological Advancement: Continuous innovation in cloud-native collaboration features.
- Competitive Pressure: SMEs adopting tools to enhance productivity and compete with larger organizations.
Team Collaboration Tools Industry Product Landscape
The team collaboration tools industry is characterized by a dynamic product landscape focused on delivering integrated, intuitive, and intelligent solutions. Innovations center on enhancing real-time communication with advanced video conferencing and AI-powered transcription, streamlining project management through visual task boards and automated workflows, and fostering seamless information sharing with robust document management and version control. Unique selling propositions often lie in the depth of integrations with other business applications, the customization capabilities for specific workflows, and the advanced security features protecting sensitive organizational data. Technological advancements are moving towards hyper-personalization, predictive analytics for team performance, and immersive virtual collaboration environments.
Key Drivers, Barriers & Challenges in Team Collaboration Tools Industry
Key Drivers: The primary forces propelling the team collaboration tools market include the sustained global adoption of remote and hybrid work models, necessitating efficient digital communication and coordination. Advancements in AI and machine learning are enabling more intelligent task automation and personalized user experiences, significantly boosting productivity. The increasing need for cross-functional team synergy and project visibility across geographically dispersed teams is a critical driver, alongside the growing awareness of the ROI associated with effective collaboration tools.
Barriers & Challenges: Significant challenges include data security concerns and privacy compliance, especially with the increasing volume of sensitive information being shared. The integration complexity with existing legacy systems and diverse IT infrastructures can be a hurdle for adoption. Resistance to change and the need for comprehensive employee training to maximize tool utilization present another barrier. Furthermore, the highly competitive landscape, characterized by rapid feature development and price pressures, challenges established players and emerging startups alike, with estimated market pressure from new entrants potentially impacting growth by xx%.
Emerging Opportunities in Team Collaboration Tools Industry
Emerging opportunities in the team collaboration tools industry lie in the development of more sophisticated AI-driven insights for team performance optimization and the creation of truly immersive virtual collaboration spaces, akin to the metaverse. Untapped markets exist in emerging economies with rapidly growing digital infrastructure and a burgeoning remote workforce. Innovative applications leveraging blockchain for secure data sharing and enhanced trust within collaborative environments are also gaining traction. Evolving consumer preferences are driving demand for highly customizable and user-centric platforms that cater to niche industry-specific workflows, offering a significant avenue for differentiation.
Growth Accelerators in the Team Collaboration Tools Industry Industry
Catalysts driving long-term growth in the team collaboration tools industry include continuous technological breakthroughs in areas like natural language processing for enhanced communication analysis and generative AI for content creation within collaborative projects. Strategic partnerships between software providers and hardware manufacturers are creating more integrated and seamless user experiences. Market expansion strategies targeting underserved industries and geographies, alongside a focus on developing specialized solutions for specific professional fields (e.g., healthcare, legal), are crucial growth accelerators. The increasing investment in employee experience and digital transformation initiatives by businesses globally further fuels this expansion.
Key Players Shaping the Team Collaboration Tools Industry Market
- Atlassian Corporation PLC
- Slack Technologies Inc.
- Huddle (Ninian Solutions Limited)
- Smartsheet Inc.
- Microsoft Corporation
- TigerConnect Inc.
- Symphony Communication Services LLC
- Wrike Inc.
- Asana Inc.
- Cybozu Inc.
Notable Milestones in Team Collaboration Tools Industry Sector
- April 2022: Slack Technologies Inc., in partnership with Salesforce, launched new tools to enhance team performance, including the "digital HQ" for extensive customization, workflow automation, and workspace adaptation.
- February 2022: Asana Inc. unveiled Asana Flow, a suite of workflow tools designed for automated work movement within and between teams. This innovation allows project managers to create reusable workflows, manage handoffs, and integrate various tools and cross-functional team collaborations.
In-Depth Team Collaboration Tools Industry Market Outlook
The future outlook for the team collaboration tools industry is exceptionally promising, underpinned by a convergence of sustained remote work trends and relentless technological innovation. Future market potential is immense, driven by the increasing demand for integrated solutions that not only facilitate communication but also enhance productivity, foster innovation, and improve employee engagement. Strategic opportunities lie in the development of intelligent platforms that leverage AI to predict team needs, automate mundane tasks, and provide actionable insights for continuous improvement. The focus will increasingly shift towards creating unified digital workplaces that seamlessly blend communication, project management, and knowledge sharing, making these tools indispensable for organizational success in the evolving global business landscape.
Team Collaboration Tools Industry Segmentation
-
1. Type of Deployment
- 1.1. Cloud
- 1.2. On-premise
-
2. Organization Size
- 2.1. Small and Medium Enterprises
- 2.2. Large Enterprises
Team Collaboration Tools Industry Segmentation By Geography
-
1. North America
- 1.1. United States
- 1.2. Canada
-
2. Europe
- 2.1. Germany
- 2.2. United Kingdom
- 2.3. France
- 2.4. Rest of Europe
-
3. Asia Pacific
- 3.1. India
- 3.2. China
- 3.3. Japan
- 3.4. Rest of Asia Pacific
-
4. Latin America
- 4.1. Brazil
- 4.2. Argentina
- 4.3. Rest of Latin America
-
5. Middle East and Africa
- 5.1. United Arab Emirates
- 5.2. Saudi Arabia
- 5.3. Africa
- 5.4. Rest of Middle East and Africa
Team Collaboration Tools Industry REPORT HIGHLIGHTS
| Aspects | Details |
|---|---|
| Study Period | 2019-2033 |
| Base Year | 2024 |
| Estimated Year | 2025 |
| Forecast Period | 2025-2033 |
| Historical Period | 2019-2024 |
| Growth Rate | CAGR of 18.00% from 2019-2033 |
| Segmentation |
|
Table of Contents
- 1. Introduction
- 1.1. Research Scope
- 1.2. Market Segmentation
- 1.3. Research Methodology
- 1.4. Definitions and Assumptions
- 2. Executive Summary
- 2.1. Introduction
- 3. Market Dynamics
- 3.1. Introduction
- 3.2. Market Drivers
- 3.2.1. Increasing Need for Tools to Make Work Seamless and Agile; Continuous Innovation in Team Collaborative Tool Offerings
- 3.3. Market Restrains
- 3.3.1. Compliance and Governance Issues
- 3.4. Market Trends
- 3.4.1. Continuous Innovation in Team Collaboration Tool Offerings to Increase Market Growth
- 4. Market Factor Analysis
- 4.1. Porters Five Forces
- 4.2. Supply/Value Chain
- 4.3. PESTEL analysis
- 4.4. Market Entropy
- 4.5. Patent/Trademark Analysis
- 5. Global Team Collaboration Tools Industry Analysis, Insights and Forecast, 2019-2031
- 5.1. Market Analysis, Insights and Forecast - by Type of Deployment
- 5.1.1. Cloud
- 5.1.2. On-premise
- 5.2. Market Analysis, Insights and Forecast - by Organization Size
- 5.2.1. Small and Medium Enterprises
- 5.2.2. Large Enterprises
- 5.3. Market Analysis, Insights and Forecast - by Region
- 5.3.1. North America
- 5.3.2. Europe
- 5.3.3. Asia Pacific
- 5.3.4. Latin America
- 5.3.5. Middle East and Africa
- 5.1. Market Analysis, Insights and Forecast - by Type of Deployment
- 6. North America Team Collaboration Tools Industry Analysis, Insights and Forecast, 2019-2031
- 6.1. Market Analysis, Insights and Forecast - by Type of Deployment
- 6.1.1. Cloud
- 6.1.2. On-premise
- 6.2. Market Analysis, Insights and Forecast - by Organization Size
- 6.2.1. Small and Medium Enterprises
- 6.2.2. Large Enterprises
- 6.1. Market Analysis, Insights and Forecast - by Type of Deployment
- 7. Europe Team Collaboration Tools Industry Analysis, Insights and Forecast, 2019-2031
- 7.1. Market Analysis, Insights and Forecast - by Type of Deployment
- 7.1.1. Cloud
- 7.1.2. On-premise
- 7.2. Market Analysis, Insights and Forecast - by Organization Size
- 7.2.1. Small and Medium Enterprises
- 7.2.2. Large Enterprises
- 7.1. Market Analysis, Insights and Forecast - by Type of Deployment
- 8. Asia Pacific Team Collaboration Tools Industry Analysis, Insights and Forecast, 2019-2031
- 8.1. Market Analysis, Insights and Forecast - by Type of Deployment
- 8.1.1. Cloud
- 8.1.2. On-premise
- 8.2. Market Analysis, Insights and Forecast - by Organization Size
- 8.2.1. Small and Medium Enterprises
- 8.2.2. Large Enterprises
- 8.1. Market Analysis, Insights and Forecast - by Type of Deployment
- 9. Latin America Team Collaboration Tools Industry Analysis, Insights and Forecast, 2019-2031
- 9.1. Market Analysis, Insights and Forecast - by Type of Deployment
- 9.1.1. Cloud
- 9.1.2. On-premise
- 9.2. Market Analysis, Insights and Forecast - by Organization Size
- 9.2.1. Small and Medium Enterprises
- 9.2.2. Large Enterprises
- 9.1. Market Analysis, Insights and Forecast - by Type of Deployment
- 10. Middle East and Africa Team Collaboration Tools Industry Analysis, Insights and Forecast, 2019-2031
- 10.1. Market Analysis, Insights and Forecast - by Type of Deployment
- 10.1.1. Cloud
- 10.1.2. On-premise
- 10.2. Market Analysis, Insights and Forecast - by Organization Size
- 10.2.1. Small and Medium Enterprises
- 10.2.2. Large Enterprises
- 10.1. Market Analysis, Insights and Forecast - by Type of Deployment
- 11. North America Team Collaboration Tools Industry Analysis, Insights and Forecast, 2019-2031
- 11.1. Market Analysis, Insights and Forecast - By Country/Sub-region
- 11.1.1 United States
- 11.1.2 Canada
- 12. Europe Team Collaboration Tools Industry Analysis, Insights and Forecast, 2019-2031
- 12.1. Market Analysis, Insights and Forecast - By Country/Sub-region
- 12.1.1 Germany
- 12.1.2 United Kingdom
- 12.1.3 France
- 12.1.4 Rest of Europe
- 13. Asia Pacific Team Collaboration Tools Industry Analysis, Insights and Forecast, 2019-2031
- 13.1. Market Analysis, Insights and Forecast - By Country/Sub-region
- 13.1.1 India
- 13.1.2 China
- 13.1.3 Japan
- 13.1.4 Rest of Asia Pacific
- 14. Latin America Team Collaboration Tools Industry Analysis, Insights and Forecast, 2019-2031
- 14.1. Market Analysis, Insights and Forecast - By Country/Sub-region
- 14.1.1 Brazil
- 14.1.2 Argentina
- 14.1.3 Rest of Latin America
- 15. Middle East and Africa Team Collaboration Tools Industry Analysis, Insights and Forecast, 2019-2031
- 15.1. Market Analysis, Insights and Forecast - By Country/Sub-region
- 15.1.1 United Arab Emirates
- 15.1.2 Saudi Arabia
- 15.1.3 Africa
- 15.1.4 Rest of Middle East and Africa
- 16. Competitive Analysis
- 16.1. Global Market Share Analysis 2024
- 16.2. Company Profiles
- 16.2.1 Atlassian Corporation PLC
- 16.2.1.1. Overview
- 16.2.1.2. Products
- 16.2.1.3. SWOT Analysis
- 16.2.1.4. Recent Developments
- 16.2.1.5. Financials (Based on Availability)
- 16.2.2 Slack Technologies Inc
- 16.2.2.1. Overview
- 16.2.2.2. Products
- 16.2.2.3. SWOT Analysis
- 16.2.2.4. Recent Developments
- 16.2.2.5. Financials (Based on Availability)
- 16.2.3 Huddle (Ninian Solutions Limited)
- 16.2.3.1. Overview
- 16.2.3.2. Products
- 16.2.3.3. SWOT Analysis
- 16.2.3.4. Recent Developments
- 16.2.3.5. Financials (Based on Availability)
- 16.2.4 Smartsheet Inc
- 16.2.4.1. Overview
- 16.2.4.2. Products
- 16.2.4.3. SWOT Analysis
- 16.2.4.4. Recent Developments
- 16.2.4.5. Financials (Based on Availability)
- 16.2.5 Microsoft Corporation
- 16.2.5.1. Overview
- 16.2.5.2. Products
- 16.2.5.3. SWOT Analysis
- 16.2.5.4. Recent Developments
- 16.2.5.5. Financials (Based on Availability)
- 16.2.6 TigerConnect Inc
- 16.2.6.1. Overview
- 16.2.6.2. Products
- 16.2.6.3. SWOT Analysis
- 16.2.6.4. Recent Developments
- 16.2.6.5. Financials (Based on Availability)
- 16.2.7 Symphony Communication Services LLC
- 16.2.7.1. Overview
- 16.2.7.2. Products
- 16.2.7.3. SWOT Analysis
- 16.2.7.4. Recent Developments
- 16.2.7.5. Financials (Based on Availability)
- 16.2.8 Wrike Inc
- 16.2.8.1. Overview
- 16.2.8.2. Products
- 16.2.8.3. SWOT Analysis
- 16.2.8.4. Recent Developments
- 16.2.8.5. Financials (Based on Availability)
- 16.2.9 Asana Inc
- 16.2.9.1. Overview
- 16.2.9.2. Products
- 16.2.9.3. SWOT Analysis
- 16.2.9.4. Recent Developments
- 16.2.9.5. Financials (Based on Availability)
- 16.2.10 Cybozu Inc *List Not Exhaustive
- 16.2.10.1. Overview
- 16.2.10.2. Products
- 16.2.10.3. SWOT Analysis
- 16.2.10.4. Recent Developments
- 16.2.10.5. Financials (Based on Availability)
- 16.2.1 Atlassian Corporation PLC
List of Figures
- Figure 1: Global Team Collaboration Tools Industry Revenue Breakdown (Million, %) by Region 2024 & 2032
- Figure 2: North America Team Collaboration Tools Industry Revenue (Million), by Country 2024 & 2032
- Figure 3: North America Team Collaboration Tools Industry Revenue Share (%), by Country 2024 & 2032
- Figure 4: Europe Team Collaboration Tools Industry Revenue (Million), by Country 2024 & 2032
- Figure 5: Europe Team Collaboration Tools Industry Revenue Share (%), by Country 2024 & 2032
- Figure 6: Asia Pacific Team Collaboration Tools Industry Revenue (Million), by Country 2024 & 2032
- Figure 7: Asia Pacific Team Collaboration Tools Industry Revenue Share (%), by Country 2024 & 2032
- Figure 8: Latin America Team Collaboration Tools Industry Revenue (Million), by Country 2024 & 2032
- Figure 9: Latin America Team Collaboration Tools Industry Revenue Share (%), by Country 2024 & 2032
- Figure 10: Middle East and Africa Team Collaboration Tools Industry Revenue (Million), by Country 2024 & 2032
- Figure 11: Middle East and Africa Team Collaboration Tools Industry Revenue Share (%), by Country 2024 & 2032
- Figure 12: North America Team Collaboration Tools Industry Revenue (Million), by Type of Deployment 2024 & 2032
- Figure 13: North America Team Collaboration Tools Industry Revenue Share (%), by Type of Deployment 2024 & 2032
- Figure 14: North America Team Collaboration Tools Industry Revenue (Million), by Organization Size 2024 & 2032
- Figure 15: North America Team Collaboration Tools Industry Revenue Share (%), by Organization Size 2024 & 2032
- Figure 16: North America Team Collaboration Tools Industry Revenue (Million), by Country 2024 & 2032
- Figure 17: North America Team Collaboration Tools Industry Revenue Share (%), by Country 2024 & 2032
- Figure 18: Europe Team Collaboration Tools Industry Revenue (Million), by Type of Deployment 2024 & 2032
- Figure 19: Europe Team Collaboration Tools Industry Revenue Share (%), by Type of Deployment 2024 & 2032
- Figure 20: Europe Team Collaboration Tools Industry Revenue (Million), by Organization Size 2024 & 2032
- Figure 21: Europe Team Collaboration Tools Industry Revenue Share (%), by Organization Size 2024 & 2032
- Figure 22: Europe Team Collaboration Tools Industry Revenue (Million), by Country 2024 & 2032
- Figure 23: Europe Team Collaboration Tools Industry Revenue Share (%), by Country 2024 & 2032
- Figure 24: Asia Pacific Team Collaboration Tools Industry Revenue (Million), by Type of Deployment 2024 & 2032
- Figure 25: Asia Pacific Team Collaboration Tools Industry Revenue Share (%), by Type of Deployment 2024 & 2032
- Figure 26: Asia Pacific Team Collaboration Tools Industry Revenue (Million), by Organization Size 2024 & 2032
- Figure 27: Asia Pacific Team Collaboration Tools Industry Revenue Share (%), by Organization Size 2024 & 2032
- Figure 28: Asia Pacific Team Collaboration Tools Industry Revenue (Million), by Country 2024 & 2032
- Figure 29: Asia Pacific Team Collaboration Tools Industry Revenue Share (%), by Country 2024 & 2032
- Figure 30: Latin America Team Collaboration Tools Industry Revenue (Million), by Type of Deployment 2024 & 2032
- Figure 31: Latin America Team Collaboration Tools Industry Revenue Share (%), by Type of Deployment 2024 & 2032
- Figure 32: Latin America Team Collaboration Tools Industry Revenue (Million), by Organization Size 2024 & 2032
- Figure 33: Latin America Team Collaboration Tools Industry Revenue Share (%), by Organization Size 2024 & 2032
- Figure 34: Latin America Team Collaboration Tools Industry Revenue (Million), by Country 2024 & 2032
- Figure 35: Latin America Team Collaboration Tools Industry Revenue Share (%), by Country 2024 & 2032
- Figure 36: Middle East and Africa Team Collaboration Tools Industry Revenue (Million), by Type of Deployment 2024 & 2032
- Figure 37: Middle East and Africa Team Collaboration Tools Industry Revenue Share (%), by Type of Deployment 2024 & 2032
- Figure 38: Middle East and Africa Team Collaboration Tools Industry Revenue (Million), by Organization Size 2024 & 2032
- Figure 39: Middle East and Africa Team Collaboration Tools Industry Revenue Share (%), by Organization Size 2024 & 2032
- Figure 40: Middle East and Africa Team Collaboration Tools Industry Revenue (Million), by Country 2024 & 2032
- Figure 41: Middle East and Africa Team Collaboration Tools Industry Revenue Share (%), by Country 2024 & 2032
List of Tables
- Table 1: Global Team Collaboration Tools Industry Revenue Million Forecast, by Region 2019 & 2032
- Table 2: Global Team Collaboration Tools Industry Revenue Million Forecast, by Type of Deployment 2019 & 2032
- Table 3: Global Team Collaboration Tools Industry Revenue Million Forecast, by Organization Size 2019 & 2032
- Table 4: Global Team Collaboration Tools Industry Revenue Million Forecast, by Region 2019 & 2032
- Table 5: Global Team Collaboration Tools Industry Revenue Million Forecast, by Country 2019 & 2032
- Table 6: United States Team Collaboration Tools Industry Revenue (Million) Forecast, by Application 2019 & 2032
- Table 7: Canada Team Collaboration Tools Industry Revenue (Million) Forecast, by Application 2019 & 2032
- Table 8: Global Team Collaboration Tools Industry Revenue Million Forecast, by Country 2019 & 2032
- Table 9: Germany Team Collaboration Tools Industry Revenue (Million) Forecast, by Application 2019 & 2032
- Table 10: United Kingdom Team Collaboration Tools Industry Revenue (Million) Forecast, by Application 2019 & 2032
- Table 11: France Team Collaboration Tools Industry Revenue (Million) Forecast, by Application 2019 & 2032
- Table 12: Rest of Europe Team Collaboration Tools Industry Revenue (Million) Forecast, by Application 2019 & 2032
- Table 13: Global Team Collaboration Tools Industry Revenue Million Forecast, by Country 2019 & 2032
- Table 14: India Team Collaboration Tools Industry Revenue (Million) Forecast, by Application 2019 & 2032
- Table 15: China Team Collaboration Tools Industry Revenue (Million) Forecast, by Application 2019 & 2032
- Table 16: Japan Team Collaboration Tools Industry Revenue (Million) Forecast, by Application 2019 & 2032
- Table 17: Rest of Asia Pacific Team Collaboration Tools Industry Revenue (Million) Forecast, by Application 2019 & 2032
- Table 18: Global Team Collaboration Tools Industry Revenue Million Forecast, by Country 2019 & 2032
- Table 19: Brazil Team Collaboration Tools Industry Revenue (Million) Forecast, by Application 2019 & 2032
- Table 20: Argentina Team Collaboration Tools Industry Revenue (Million) Forecast, by Application 2019 & 2032
- Table 21: Rest of Latin America Team Collaboration Tools Industry Revenue (Million) Forecast, by Application 2019 & 2032
- Table 22: Global Team Collaboration Tools Industry Revenue Million Forecast, by Country 2019 & 2032
- Table 23: United Arab Emirates Team Collaboration Tools Industry Revenue (Million) Forecast, by Application 2019 & 2032
- Table 24: Saudi Arabia Team Collaboration Tools Industry Revenue (Million) Forecast, by Application 2019 & 2032
- Table 25: Africa Team Collaboration Tools Industry Revenue (Million) Forecast, by Application 2019 & 2032
- Table 26: Rest of Middle East and Africa Team Collaboration Tools Industry Revenue (Million) Forecast, by Application 2019 & 2032
- Table 27: Global Team Collaboration Tools Industry Revenue Million Forecast, by Type of Deployment 2019 & 2032
- Table 28: Global Team Collaboration Tools Industry Revenue Million Forecast, by Organization Size 2019 & 2032
- Table 29: Global Team Collaboration Tools Industry Revenue Million Forecast, by Country 2019 & 2032
- Table 30: United States Team Collaboration Tools Industry Revenue (Million) Forecast, by Application 2019 & 2032
- Table 31: Canada Team Collaboration Tools Industry Revenue (Million) Forecast, by Application 2019 & 2032
- Table 32: Global Team Collaboration Tools Industry Revenue Million Forecast, by Type of Deployment 2019 & 2032
- Table 33: Global Team Collaboration Tools Industry Revenue Million Forecast, by Organization Size 2019 & 2032
- Table 34: Global Team Collaboration Tools Industry Revenue Million Forecast, by Country 2019 & 2032
- Table 35: Germany Team Collaboration Tools Industry Revenue (Million) Forecast, by Application 2019 & 2032
- Table 36: United Kingdom Team Collaboration Tools Industry Revenue (Million) Forecast, by Application 2019 & 2032
- Table 37: France Team Collaboration Tools Industry Revenue (Million) Forecast, by Application 2019 & 2032
- Table 38: Rest of Europe Team Collaboration Tools Industry Revenue (Million) Forecast, by Application 2019 & 2032
- Table 39: Global Team Collaboration Tools Industry Revenue Million Forecast, by Type of Deployment 2019 & 2032
- Table 40: Global Team Collaboration Tools Industry Revenue Million Forecast, by Organization Size 2019 & 2032
- Table 41: Global Team Collaboration Tools Industry Revenue Million Forecast, by Country 2019 & 2032
- Table 42: India Team Collaboration Tools Industry Revenue (Million) Forecast, by Application 2019 & 2032
- Table 43: China Team Collaboration Tools Industry Revenue (Million) Forecast, by Application 2019 & 2032
- Table 44: Japan Team Collaboration Tools Industry Revenue (Million) Forecast, by Application 2019 & 2032
- Table 45: Rest of Asia Pacific Team Collaboration Tools Industry Revenue (Million) Forecast, by Application 2019 & 2032
- Table 46: Global Team Collaboration Tools Industry Revenue Million Forecast, by Type of Deployment 2019 & 2032
- Table 47: Global Team Collaboration Tools Industry Revenue Million Forecast, by Organization Size 2019 & 2032
- Table 48: Global Team Collaboration Tools Industry Revenue Million Forecast, by Country 2019 & 2032
- Table 49: Brazil Team Collaboration Tools Industry Revenue (Million) Forecast, by Application 2019 & 2032
- Table 50: Argentina Team Collaboration Tools Industry Revenue (Million) Forecast, by Application 2019 & 2032
- Table 51: Rest of Latin America Team Collaboration Tools Industry Revenue (Million) Forecast, by Application 2019 & 2032
- Table 52: Global Team Collaboration Tools Industry Revenue Million Forecast, by Type of Deployment 2019 & 2032
- Table 53: Global Team Collaboration Tools Industry Revenue Million Forecast, by Organization Size 2019 & 2032
- Table 54: Global Team Collaboration Tools Industry Revenue Million Forecast, by Country 2019 & 2032
- Table 55: United Arab Emirates Team Collaboration Tools Industry Revenue (Million) Forecast, by Application 2019 & 2032
- Table 56: Saudi Arabia Team Collaboration Tools Industry Revenue (Million) Forecast, by Application 2019 & 2032
- Table 57: Africa Team Collaboration Tools Industry Revenue (Million) Forecast, by Application 2019 & 2032
- Table 58: Rest of Middle East and Africa Team Collaboration Tools Industry Revenue (Million) Forecast, by Application 2019 & 2032
Frequently Asked Questions
1. What is the projected Compound Annual Growth Rate (CAGR) of the Team Collaboration Tools Industry?
The projected CAGR is approximately 18.00%.
2. Which companies are prominent players in the Team Collaboration Tools Industry?
Key companies in the market include Atlassian Corporation PLC, Slack Technologies Inc, Huddle (Ninian Solutions Limited), Smartsheet Inc, Microsoft Corporation, TigerConnect Inc, Symphony Communication Services LLC, Wrike Inc, Asana Inc, Cybozu Inc *List Not Exhaustive.
3. What are the main segments of the Team Collaboration Tools Industry?
The market segments include Type of Deployment, Organization Size.
4. Can you provide details about the market size?
The market size is estimated to be USD XX Million as of 2022.
5. What are some drivers contributing to market growth?
Increasing Need for Tools to Make Work Seamless and Agile; Continuous Innovation in Team Collaborative Tool Offerings.
6. What are the notable trends driving market growth?
Continuous Innovation in Team Collaboration Tool Offerings to Increase Market Growth.
7. Are there any restraints impacting market growth?
Compliance and Governance Issues.
8. Can you provide examples of recent developments in the market?
April 2022: Slack Technologies Inc., along with Salesforce, announced the release of new tools to accelerate team performance. This includes the digital HQ to give customers unlimited ways to customize Slack, automate workflows, and adapt their workspaces to meet the specific needs of their teams.
9. What pricing options are available for accessing the report?
Pricing options include single-user, multi-user, and enterprise licenses priced at USD 4750, USD 5250, and USD 8750 respectively.
10. Is the market size provided in terms of value or volume?
The market size is provided in terms of value, measured in Million.
11. Are there any specific market keywords associated with the report?
Yes, the market keyword associated with the report is "Team Collaboration Tools Industry," which aids in identifying and referencing the specific market segment covered.
12. How do I determine which pricing option suits my needs best?
The pricing options vary based on user requirements and access needs. Individual users may opt for single-user licenses, while businesses requiring broader access may choose multi-user or enterprise licenses for cost-effective access to the report.
13. Are there any additional resources or data provided in the Team Collaboration Tools Industry report?
While the report offers comprehensive insights, it's advisable to review the specific contents or supplementary materials provided to ascertain if additional resources or data are available.
14. How can I stay updated on further developments or reports in the Team Collaboration Tools Industry?
To stay informed about further developments, trends, and reports in the Team Collaboration Tools Industry, consider subscribing to industry newsletters, following relevant companies and organizations, or regularly checking reputable industry news sources and publications.
Methodology
Step 1 - Identification of Relevant Samples Size from Population Database


Step 2 - Approaches for Defining Global Market Size (Value, Volume* & Price*)

Note*: In applicable scenarios
Step 3 - Data Sources
Primary Research
- Web Analytics
- Survey Reports
- Research Institute
- Latest Research Reports
- Opinion Leaders
Secondary Research
- Annual Reports
- White Paper
- Latest Press Release
- Industry Association
- Paid Database
- Investor Presentations

Step 4 - Data Triangulation
Involves using different sources of information in order to increase the validity of a study
These sources are likely to be stakeholders in a program - participants, other researchers, program staff, other community members, and so on.
Then we put all data in single framework & apply various statistical tools to find out the dynamic on the market.
During the analysis stage, feedback from the stakeholder groups would be compared to determine areas of agreement as well as areas of divergence


