
Key Insights
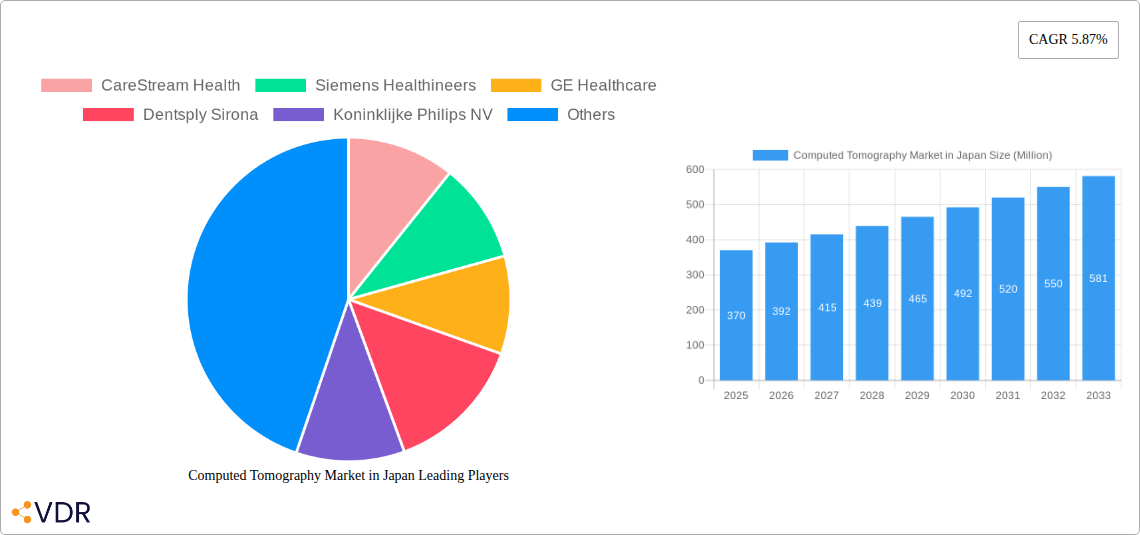
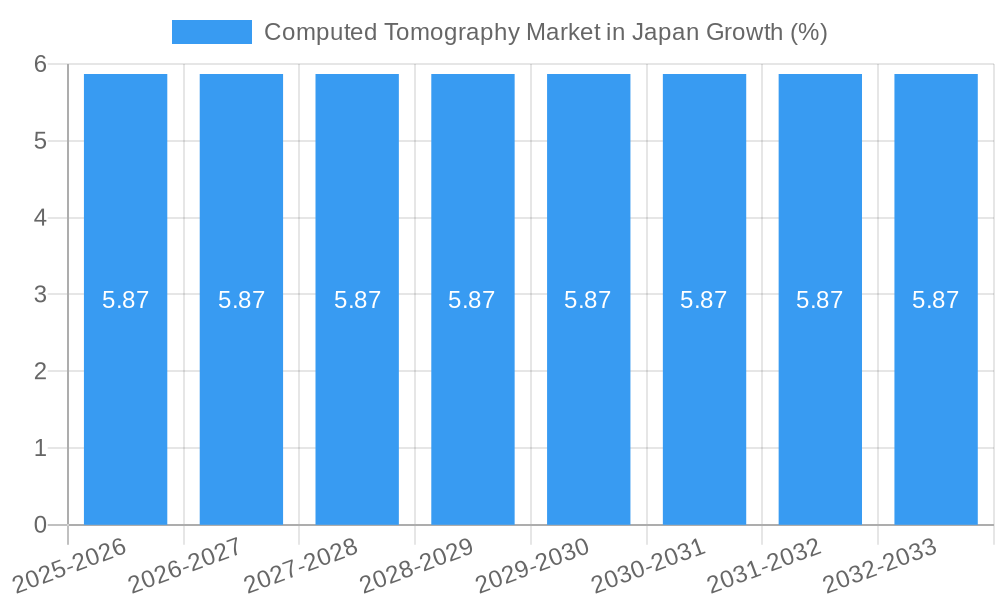
The Japanese Computed Tomography (CT) market is poised for robust expansion, driven by an increasing prevalence of chronic diseases and an aging population, both significant factors contributing to a higher demand for advanced diagnostic imaging. With a current estimated market size of approximately USD 370 million in 2025, the market is projected to witness a Compound Annual Growth Rate (CAGR) of 5.87% through 2033. This growth is propelled by advancements in CT technology, including the development of multi-detector CT (MDCT) scanners that offer superior image resolution and reduced scan times. Key application segments such as oncology and cardiovascular imaging are expected to lead the market, owing to the critical role of CT in early detection, diagnosis, and treatment monitoring for these conditions. Furthermore, the rising adoption of AI-powered CT solutions for image analysis and workflow optimization is contributing to enhanced diagnostic accuracy and efficiency, further fueling market growth.
The competitive landscape of the Japanese CT market is characterized by the presence of major global players alongside established domestic manufacturers, fostering innovation and a diverse product portfolio. While the market benefits from strong government initiatives supporting healthcare infrastructure development and technological adoption, it faces certain restraints. These include the high capital expenditure associated with advanced CT systems and the stringent regulatory approval processes for new medical devices. Nevertheless, the increasing demand for minimally invasive diagnostic procedures, coupled with a growing awareness among healthcare providers and patients about the benefits of CT imaging, are expected to sustain the market's upward trajectory. The market segmentation by slice type, with a pronounced demand for medium and high-slice CT scanners, reflects the need for detailed anatomical visualization, while hospitals and diagnostic centers remain the primary end-users, leveraging these technologies for comprehensive patient care.
This comprehensive report offers an in-depth analysis of the Computed Tomography (CT) market in Japan, exploring its dynamics, growth trajectories, and future potential. Delve into the intricacies of low slice CT, medium slice CT, and high slice CT, alongside critical applications such as oncology CT scans, neurology CT imaging, cardiovascular CT diagnostics, and musculoskeletal CT evaluation. Understand the market's structure, key players, and emerging opportunities, crucial for stakeholders in the Japanese healthcare industry. All market values are presented in Million units.
Computed Tomography Market in Japan Market Dynamics & Structure
The Japanese CT scan market exhibits a moderately concentrated structure, with a few dominant global players and established local manufacturers vying for market share. Technological innovation is the primary driver, with continuous advancements in scanner resolution, speed, and radiation dose reduction significantly influencing market adoption. Regulatory frameworks, guided by organizations like the Pharmaceuticals and Medical Devices Agency (PMDA), play a crucial role in ensuring safety and efficacy, impacting product approvals and market entry strategies. The competitive landscape features ongoing innovation, with companies focusing on developing advanced imaging techniques and AI-powered solutions. End-user demographics are shifting, driven by an aging population and a growing demand for advanced diagnostic tools. Mergers and acquisitions (M&A) are less frequent but strategic, often aimed at expanding product portfolios or gaining access to new technologies and markets.
- Market Concentration: Dominated by a few key global and domestic players, with strategic partnerships and R&D collaborations shaping competitive dynamics.
- Technological Innovation Drivers: Advancements in detector technology, AI integration for image reconstruction and analysis, and development of lower-dose scanning protocols.
- Regulatory Frameworks: Stringent PMDA approvals ensure product quality and patient safety, influencing market entry timelines and research investments.
- Competitive Product Substitutes: While CT remains a cornerstone, advancements in MRI and Ultrasound offer partial substitutes in specific diagnostic scenarios.
- End-User Demographics: An aging population and increasing prevalence of chronic diseases drive demand for advanced diagnostic imaging solutions.
- M&A Trends: Predominantly strategic acquisitions aimed at enhancing technological capabilities or market reach, rather than broad consolidation.
Computed Tomography Market in Japan Growth Trends & Insights
The Japanese Computed Tomography (CT) market is poised for robust growth, driven by an escalating demand for advanced diagnostic imaging solutions. AI technology for early disease detection is a significant disruptor, enhancing diagnostic accuracy and patient outcomes. The adoption rates of next-generation CT systems, including those utilizing photon-counting computed tomography (PCCT), are expected to rise steadily, fueled by their superior image quality and reduced radiation exposure. Consumer behavior is increasingly influenced by the accessibility and accuracy of diagnostic imaging, leading to a preference for facilities equipped with the latest CT technology. Market penetration is driven by government initiatives promoting early disease screening and the increasing healthcare expenditure by the aging Japanese population. The projected CAGR for the forecast period is XX%, indicating a healthy expansion of the market. The market size is estimated to reach XX Million units by 2033.
- Market Size Evolution: The Japanese CT market has witnessed consistent growth, driven by technological advancements and increasing healthcare infrastructure investments.
- Adoption Rates: Growing adoption of AI-powered CT systems and photon-counting CT technology is accelerating market expansion.
- Technological Disruptions: AI integration for image analysis, personalized imaging protocols, and dose reduction technologies are reshaping the diagnostic landscape.
- Consumer Behavior Shifts: Increased patient awareness regarding the benefits of early and accurate diagnosis is driving demand for advanced CT imaging.
- Market Penetration: Driven by national health screening programs and the rising prevalence of age-related diseases.
- Projected CAGR (2025-2033): XX%
- Estimated Market Size (2025): XX Million units
- Forecasted Market Size (2033): XX Million units
Dominant Regions, Countries, or Segments in Computed Tomography Market in Japan
Within the Japanese CT scan market, the Hospitals segment stands as the dominant end-user, accounting for a significant portion of market share. This dominance is attributed to the centralized nature of healthcare delivery in Japan, where hospitals serve as primary diagnostic hubs, equipped with advanced medical technology and a high volume of patient throughput. The increasing prevalence of chronic diseases and an aging population necessitate advanced diagnostic capabilities, which hospitals are best positioned to provide.
Dominant End-User: Hospitals
- Market Share: Hospitals account for an estimated XX% of the total Japanese CT market in 2025.
- Growth Potential: Driven by ongoing investments in upgrading imaging infrastructure and the need for comprehensive diagnostic services for complex conditions.
- Key Drivers: High patient volume, specialized medical departments (oncology, neurology, cardiology), and government initiatives to enhance hospital diagnostic capabilities.
- Impact of Economic Policies: Government healthcare spending and reimbursement policies directly influence hospital purchasing decisions for high-end CT equipment.
- Infrastructure: The well-established network of public and private hospitals across Japan ensures widespread access to CT imaging.
Dominant Application: Oncology
- Market Share: Oncology applications represent an estimated XX% of the total CT market revenue in 2025.
- Growth Potential: Fueled by advancements in cancer detection, staging, and treatment monitoring.
- Key Drivers: Rising cancer incidence rates, adoption of early cancer screening programs, and the demand for precise tumor visualization for treatment planning.
- Technological Advancements: Innovations in contrast enhancement techniques and functional imaging are crucial for oncology diagnostics.
- Market Penetration: High penetration due to the critical role of CT in detecting and managing various types of cancer.
Dominant Type: High Slice CT
- Market Share: High slice CT scanners contribute an estimated XX% to the market value in 2025.
- Growth Potential: Driven by the need for detailed anatomical visualization, particularly in complex cardiovascular and neurological examinations.
- Key Drivers: Superior spatial resolution, faster scan times, and the ability to reconstruct high-quality 3D images.
- Technological Advancements: Continuous improvements in detector technology and imaging reconstruction algorithms.
- Adoption Trends: Increasing adoption in specialized medical centers and research institutions.
Computed Tomography Market in Japan Product Landscape
The Japanese CT market is characterized by a diverse product landscape featuring innovative technologies that enhance diagnostic accuracy and patient safety. Key product innovations include the integration of photon-counting CT (PCCT), which offers superior spectral information and dose reduction capabilities, and the widespread adoption of AI-driven image reconstruction and analysis software. These advancements enable faster scanning times, reduced radiation exposure, and improved visualization of subtle pathologies across various applications, including oncology, neurology, and cardiovascular imaging. Unique selling propositions revolve around higher spatial and temporal resolution, expanded field of view, and advanced dose modulation techniques, catering to the growing demand for precise and efficient diagnostic solutions.
Key Drivers, Barriers & Challenges in Computed Tomography Market in Japan
Key Drivers: The Japanese CT market is propelled by an aging demographic with an increased incidence of chronic diseases, a robust healthcare infrastructure, and continuous technological innovation, particularly in AI and low-dose CT. Government initiatives promoting early disease detection and screening further fuel market expansion.
Barriers & Challenges: High initial investment costs for advanced CT systems pose a significant barrier for smaller healthcare providers. Stringent regulatory approval processes, while ensuring quality, can lead to longer market entry times. The shortage of skilled radiographers and technicians trained on advanced CT technologies also presents a challenge. Competitive pressures from alternative imaging modalities and the need for continuous software updates and maintenance add to operational complexities.
Emerging Opportunities in Computed Tomography Market in Japan
Emerging opportunities in the Japanese CT market lie in the expansion of AI-powered diagnostic tools for automated image analysis and anomaly detection, particularly in areas like early cancer screening and stroke detection. The growing demand for portable and compact CT scanners for point-of-care diagnostics and remote healthcare delivery presents another avenue. Furthermore, the increasing focus on personalized medicine is driving the development of functional CT imaging techniques and tailored imaging protocols, creating niche market segments. The untapped potential in smaller clinics and rural healthcare facilities for adopting advanced yet cost-effective CT solutions also represents a significant opportunity.
Growth Accelerators in the Computed Tomography Market in Japan Industry
The long-term growth of the Japanese CT market is significantly accelerated by breakthroughs in detector technology, leading to higher resolution and lower radiation doses. Strategic partnerships between technology providers and research institutions, as exemplified by the collaboration on photon-counting CT, are crucial for driving innovation and clinical validation. Furthermore, market expansion strategies focusing on integrated imaging solutions that combine CT with other modalities and AI platforms will play a pivotal role in capturing market share and enhancing diagnostic workflows.
Key Players Shaping the Computed Tomography Market in Japan Market
- CareStream Health
- Siemens Healthineers
- GE Healthcare
- Dentsply Sirona
- Koninklijke Philips NV
- J Morita Corporation
- Canon Medical Systems Corporation
- Planmed Oy
- Fujifilm Holdings Corporation
Notable Milestones in Computed Tomography Market in Japan Sector
- April 2023: Canon Inc. announced that Canon and the National Cancer Center Japan (NCC) have begun clinical research employing a next-generation X-ray CT system with photon-counting computed tomography (photon-counting CT, PCCT).
- April 2022: Fujitsu and the Southern Tohoku General Hospital announced the launch of a joint research project with Fujitsu Japan Limited and FCOM CORPORATION on AI technology for the early detection of pancreatic cancer from computed tomography (CT) scans without contrast agent (non-contrast CT scans).
In-Depth Computed Tomography Market in Japan Market Outlook
The future outlook for the Japanese CT market is highly promising, driven by ongoing technological advancements and a sustained demand for sophisticated diagnostic imaging. The widespread integration of AI, coupled with the adoption of cutting-edge technologies like PCCT, will redefine diagnostic accuracy and efficiency. Strategic collaborations, such as those focused on photon-counting CT and AI-driven early detection, are poised to unlock new clinical applications and improve patient outcomes. The market is expected to witness significant growth in specialized segments like oncology and neurology, further bolstered by an aging population and a commitment to advanced healthcare. This presents substantial opportunities for stakeholders to invest in innovative solutions and expand their market presence in Japan.
Computed Tomography Market in Japan Segmentation
-
1. Type
- 1.1. Low Slice
- 1.2. Medium Slice
- 1.3. High Slice
-
2. Application
- 2.1. Oncology
- 2.2. Neurology
- 2.3. Cardiovascular
- 2.4. Musculoskeletal
- 2.5. Other Applications
-
3. End-User
- 3.1. Hospitals
- 3.2. Diagnostic Centers
- 3.3. Other End-Users
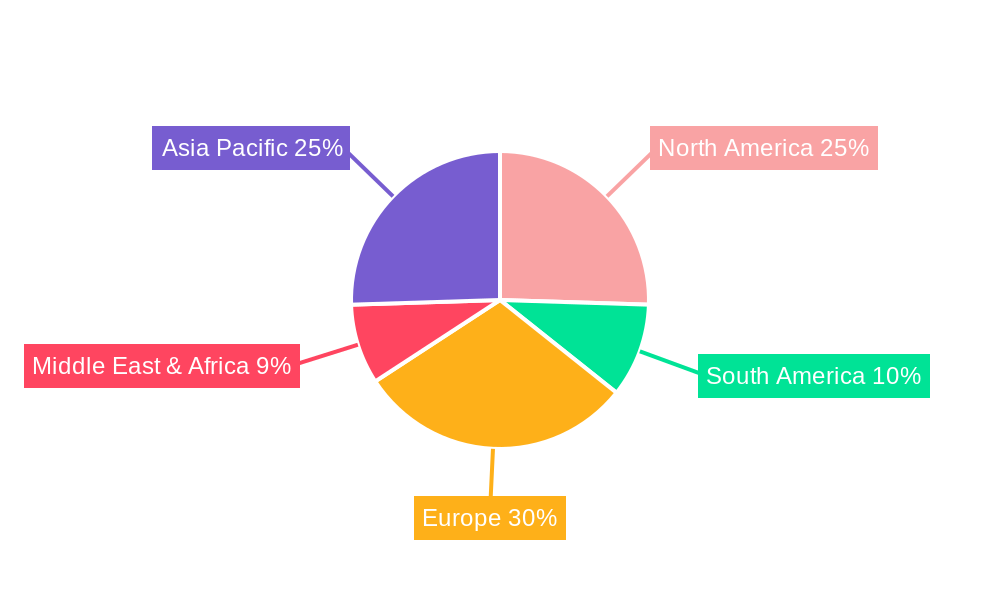
Computed Tomography Market in Japan Segmentation By Geography
-
1. North America
- 1.1. United States
- 1.2. Canada
- 1.3. Mexico
-
2. South America
- 2.1. Brazil
- 2.2. Argentina
- 2.3. Rest of South America
-
3. Europe
- 3.1. United Kingdom
- 3.2. Germany
- 3.3. France
- 3.4. Italy
- 3.5. Spain
- 3.6. Russia
- 3.7. Benelux
- 3.8. Nordics
- 3.9. Rest of Europe
-
4. Middle East & Africa
- 4.1. Turkey
- 4.2. Israel
- 4.3. GCC
- 4.4. North Africa
- 4.5. South Africa
- 4.6. Rest of Middle East & Africa
-
5. Asia Pacific
- 5.1. China
- 5.2. India
- 5.3. Japan
- 5.4. South Korea
- 5.5. ASEAN
- 5.6. Oceania
- 5.7. Rest of Asia Pacific
Computed Tomography Market in Japan REPORT HIGHLIGHTS
| Aspects | Details |
|---|---|
| Study Period | 2019-2033 |
| Base Year | 2024 |
| Estimated Year | 2025 |
| Forecast Period | 2025-2033 |
| Historical Period | 2019-2024 |
| Growth Rate | CAGR of 5.87% from 2019-2033 |
| Segmentation |
|
Table of Contents
- 1. Introduction
- 1.1. Research Scope
- 1.2. Market Segmentation
- 1.3. Research Methodology
- 1.4. Definitions and Assumptions
- 2. Executive Summary
- 2.1. Introduction
- 3. Market Dynamics
- 3.1. Introduction
- 3.2. Market Drivers
- 3.2.1. Increasing Geriatric Population and Chronic Disease Burden; Technological Advancements in Computed Tomography
- 3.3. Market Restrains
- 3.3.1. High Cost Associated With CT Scan Procedure and Equipment
- 3.4. Market Trends
- 3.4.1. The Diagnostic Centers Segment is Expected to Witness Significant Growth in End Users
- 4. Market Factor Analysis
- 4.1. Porters Five Forces
- 4.2. Supply/Value Chain
- 4.3. PESTEL analysis
- 4.4. Market Entropy
- 4.5. Patent/Trademark Analysis
- 5. Global Computed Tomography Market in Japan Analysis, Insights and Forecast, 2019-2031
- 5.1. Market Analysis, Insights and Forecast - by Type
- 5.1.1. Low Slice
- 5.1.2. Medium Slice
- 5.1.3. High Slice
- 5.2. Market Analysis, Insights and Forecast - by Application
- 5.2.1. Oncology
- 5.2.2. Neurology
- 5.2.3. Cardiovascular
- 5.2.4. Musculoskeletal
- 5.2.5. Other Applications
- 5.3. Market Analysis, Insights and Forecast - by End-User
- 5.3.1. Hospitals
- 5.3.2. Diagnostic Centers
- 5.3.3. Other End-Users
- 5.4. Market Analysis, Insights and Forecast - by Region
- 5.4.1. North America
- 5.4.2. South America
- 5.4.3. Europe
- 5.4.4. Middle East & Africa
- 5.4.5. Asia Pacific
- 5.1. Market Analysis, Insights and Forecast - by Type
- 6. North America Computed Tomography Market in Japan Analysis, Insights and Forecast, 2019-2031
- 6.1. Market Analysis, Insights and Forecast - by Type
- 6.1.1. Low Slice
- 6.1.2. Medium Slice
- 6.1.3. High Slice
- 6.2. Market Analysis, Insights and Forecast - by Application
- 6.2.1. Oncology
- 6.2.2. Neurology
- 6.2.3. Cardiovascular
- 6.2.4. Musculoskeletal
- 6.2.5. Other Applications
- 6.3. Market Analysis, Insights and Forecast - by End-User
- 6.3.1. Hospitals
- 6.3.2. Diagnostic Centers
- 6.3.3. Other End-Users
- 6.1. Market Analysis, Insights and Forecast - by Type
- 7. South America Computed Tomography Market in Japan Analysis, Insights and Forecast, 2019-2031
- 7.1. Market Analysis, Insights and Forecast - by Type
- 7.1.1. Low Slice
- 7.1.2. Medium Slice
- 7.1.3. High Slice
- 7.2. Market Analysis, Insights and Forecast - by Application
- 7.2.1. Oncology
- 7.2.2. Neurology
- 7.2.3. Cardiovascular
- 7.2.4. Musculoskeletal
- 7.2.5. Other Applications
- 7.3. Market Analysis, Insights and Forecast - by End-User
- 7.3.1. Hospitals
- 7.3.2. Diagnostic Centers
- 7.3.3. Other End-Users
- 7.1. Market Analysis, Insights and Forecast - by Type
- 8. Europe Computed Tomography Market in Japan Analysis, Insights and Forecast, 2019-2031
- 8.1. Market Analysis, Insights and Forecast - by Type
- 8.1.1. Low Slice
- 8.1.2. Medium Slice
- 8.1.3. High Slice
- 8.2. Market Analysis, Insights and Forecast - by Application
- 8.2.1. Oncology
- 8.2.2. Neurology
- 8.2.3. Cardiovascular
- 8.2.4. Musculoskeletal
- 8.2.5. Other Applications
- 8.3. Market Analysis, Insights and Forecast - by End-User
- 8.3.1. Hospitals
- 8.3.2. Diagnostic Centers
- 8.3.3. Other End-Users
- 8.1. Market Analysis, Insights and Forecast - by Type
- 9. Middle East & Africa Computed Tomography Market in Japan Analysis, Insights and Forecast, 2019-2031
- 9.1. Market Analysis, Insights and Forecast - by Type
- 9.1.1. Low Slice
- 9.1.2. Medium Slice
- 9.1.3. High Slice
- 9.2. Market Analysis, Insights and Forecast - by Application
- 9.2.1. Oncology
- 9.2.2. Neurology
- 9.2.3. Cardiovascular
- 9.2.4. Musculoskeletal
- 9.2.5. Other Applications
- 9.3. Market Analysis, Insights and Forecast - by End-User
- 9.3.1. Hospitals
- 9.3.2. Diagnostic Centers
- 9.3.3. Other End-Users
- 9.1. Market Analysis, Insights and Forecast - by Type
- 10. Asia Pacific Computed Tomography Market in Japan Analysis, Insights and Forecast, 2019-2031
- 10.1. Market Analysis, Insights and Forecast - by Type
- 10.1.1. Low Slice
- 10.1.2. Medium Slice
- 10.1.3. High Slice
- 10.2. Market Analysis, Insights and Forecast - by Application
- 10.2.1. Oncology
- 10.2.2. Neurology
- 10.2.3. Cardiovascular
- 10.2.4. Musculoskeletal
- 10.2.5. Other Applications
- 10.3. Market Analysis, Insights and Forecast - by End-User
- 10.3.1. Hospitals
- 10.3.2. Diagnostic Centers
- 10.3.3. Other End-Users
- 10.1. Market Analysis, Insights and Forecast - by Type
- 11. Kanto Computed Tomography Market in Japan Analysis, Insights and Forecast, 2019-2031
- 12. Kansai Computed Tomography Market in Japan Analysis, Insights and Forecast, 2019-2031
- 13. Chubu Computed Tomography Market in Japan Analysis, Insights and Forecast, 2019-2031
- 14. Kyushu Computed Tomography Market in Japan Analysis, Insights and Forecast, 2019-2031
- 15. Tohoku Computed Tomography Market in Japan Analysis, Insights and Forecast, 2019-2031
- 16. Competitive Analysis
- 16.1. Global Market Share Analysis 2024
- 16.2. Company Profiles
- 16.2.1 CareStream Health
- 16.2.1.1. Overview
- 16.2.1.2. Products
- 16.2.1.3. SWOT Analysis
- 16.2.1.4. Recent Developments
- 16.2.1.5. Financials (Based on Availability)
- 16.2.2 Siemens Healthineers
- 16.2.2.1. Overview
- 16.2.2.2. Products
- 16.2.2.3. SWOT Analysis
- 16.2.2.4. Recent Developments
- 16.2.2.5. Financials (Based on Availability)
- 16.2.3 GE Healthcare
- 16.2.3.1. Overview
- 16.2.3.2. Products
- 16.2.3.3. SWOT Analysis
- 16.2.3.4. Recent Developments
- 16.2.3.5. Financials (Based on Availability)
- 16.2.4 Dentsply Sirona
- 16.2.4.1. Overview
- 16.2.4.2. Products
- 16.2.4.3. SWOT Analysis
- 16.2.4.4. Recent Developments
- 16.2.4.5. Financials (Based on Availability)
- 16.2.5 Koninklijke Philips NV
- 16.2.5.1. Overview
- 16.2.5.2. Products
- 16.2.5.3. SWOT Analysis
- 16.2.5.4. Recent Developments
- 16.2.5.5. Financials (Based on Availability)
- 16.2.6 J Morita Corporation
- 16.2.6.1. Overview
- 16.2.6.2. Products
- 16.2.6.3. SWOT Analysis
- 16.2.6.4. Recent Developments
- 16.2.6.5. Financials (Based on Availability)
- 16.2.7 Canon Medical Systems Corporation
- 16.2.7.1. Overview
- 16.2.7.2. Products
- 16.2.7.3. SWOT Analysis
- 16.2.7.4. Recent Developments
- 16.2.7.5. Financials (Based on Availability)
- 16.2.8 Planmed Oy
- 16.2.8.1. Overview
- 16.2.8.2. Products
- 16.2.8.3. SWOT Analysis
- 16.2.8.4. Recent Developments
- 16.2.8.5. Financials (Based on Availability)
- 16.2.9 Fujifilm Holdings Corporation
- 16.2.9.1. Overview
- 16.2.9.2. Products
- 16.2.9.3. SWOT Analysis
- 16.2.9.4. Recent Developments
- 16.2.9.5. Financials (Based on Availability)
- 16.2.1 CareStream Health
List of Figures
- Figure 1: Global Computed Tomography Market in Japan Revenue Breakdown (Million, %) by Region 2024 & 2032
- Figure 2: Japan Computed Tomography Market in Japan Revenue (Million), by Country 2024 & 2032
- Figure 3: Japan Computed Tomography Market in Japan Revenue Share (%), by Country 2024 & 2032
- Figure 4: North America Computed Tomography Market in Japan Revenue (Million), by Type 2024 & 2032
- Figure 5: North America Computed Tomography Market in Japan Revenue Share (%), by Type 2024 & 2032
- Figure 6: North America Computed Tomography Market in Japan Revenue (Million), by Application 2024 & 2032
- Figure 7: North America Computed Tomography Market in Japan Revenue Share (%), by Application 2024 & 2032
- Figure 8: North America Computed Tomography Market in Japan Revenue (Million), by End-User 2024 & 2032
- Figure 9: North America Computed Tomography Market in Japan Revenue Share (%), by End-User 2024 & 2032
- Figure 10: North America Computed Tomography Market in Japan Revenue (Million), by Country 2024 & 2032
- Figure 11: North America Computed Tomography Market in Japan Revenue Share (%), by Country 2024 & 2032
- Figure 12: South America Computed Tomography Market in Japan Revenue (Million), by Type 2024 & 2032
- Figure 13: South America Computed Tomography Market in Japan Revenue Share (%), by Type 2024 & 2032
- Figure 14: South America Computed Tomography Market in Japan Revenue (Million), by Application 2024 & 2032
- Figure 15: South America Computed Tomography Market in Japan Revenue Share (%), by Application 2024 & 2032
- Figure 16: South America Computed Tomography Market in Japan Revenue (Million), by End-User 2024 & 2032
- Figure 17: South America Computed Tomography Market in Japan Revenue Share (%), by End-User 2024 & 2032
- Figure 18: South America Computed Tomography Market in Japan Revenue (Million), by Country 2024 & 2032
- Figure 19: South America Computed Tomography Market in Japan Revenue Share (%), by Country 2024 & 2032
- Figure 20: Europe Computed Tomography Market in Japan Revenue (Million), by Type 2024 & 2032
- Figure 21: Europe Computed Tomography Market in Japan Revenue Share (%), by Type 2024 & 2032
- Figure 22: Europe Computed Tomography Market in Japan Revenue (Million), by Application 2024 & 2032
- Figure 23: Europe Computed Tomography Market in Japan Revenue Share (%), by Application 2024 & 2032
- Figure 24: Europe Computed Tomography Market in Japan Revenue (Million), by End-User 2024 & 2032
- Figure 25: Europe Computed Tomography Market in Japan Revenue Share (%), by End-User 2024 & 2032
- Figure 26: Europe Computed Tomography Market in Japan Revenue (Million), by Country 2024 & 2032
- Figure 27: Europe Computed Tomography Market in Japan Revenue Share (%), by Country 2024 & 2032
- Figure 28: Middle East & Africa Computed Tomography Market in Japan Revenue (Million), by Type 2024 & 2032
- Figure 29: Middle East & Africa Computed Tomography Market in Japan Revenue Share (%), by Type 2024 & 2032
- Figure 30: Middle East & Africa Computed Tomography Market in Japan Revenue (Million), by Application 2024 & 2032
- Figure 31: Middle East & Africa Computed Tomography Market in Japan Revenue Share (%), by Application 2024 & 2032
- Figure 32: Middle East & Africa Computed Tomography Market in Japan Revenue (Million), by End-User 2024 & 2032
- Figure 33: Middle East & Africa Computed Tomography Market in Japan Revenue Share (%), by End-User 2024 & 2032
- Figure 34: Middle East & Africa Computed Tomography Market in Japan Revenue (Million), by Country 2024 & 2032
- Figure 35: Middle East & Africa Computed Tomography Market in Japan Revenue Share (%), by Country 2024 & 2032
- Figure 36: Asia Pacific Computed Tomography Market in Japan Revenue (Million), by Type 2024 & 2032
- Figure 37: Asia Pacific Computed Tomography Market in Japan Revenue Share (%), by Type 2024 & 2032
- Figure 38: Asia Pacific Computed Tomography Market in Japan Revenue (Million), by Application 2024 & 2032
- Figure 39: Asia Pacific Computed Tomography Market in Japan Revenue Share (%), by Application 2024 & 2032
- Figure 40: Asia Pacific Computed Tomography Market in Japan Revenue (Million), by End-User 2024 & 2032
- Figure 41: Asia Pacific Computed Tomography Market in Japan Revenue Share (%), by End-User 2024 & 2032
- Figure 42: Asia Pacific Computed Tomography Market in Japan Revenue (Million), by Country 2024 & 2032
- Figure 43: Asia Pacific Computed Tomography Market in Japan Revenue Share (%), by Country 2024 & 2032
List of Tables
- Table 1: Global Computed Tomography Market in Japan Revenue Million Forecast, by Region 2019 & 2032
- Table 2: Global Computed Tomography Market in Japan Revenue Million Forecast, by Type 2019 & 2032
- Table 3: Global Computed Tomography Market in Japan Revenue Million Forecast, by Application 2019 & 2032
- Table 4: Global Computed Tomography Market in Japan Revenue Million Forecast, by End-User 2019 & 2032
- Table 5: Global Computed Tomography Market in Japan Revenue Million Forecast, by Region 2019 & 2032
- Table 6: Global Computed Tomography Market in Japan Revenue Million Forecast, by Country 2019 & 2032
- Table 7: Kanto Computed Tomography Market in Japan Revenue (Million) Forecast, by Application 2019 & 2032
- Table 8: Kansai Computed Tomography Market in Japan Revenue (Million) Forecast, by Application 2019 & 2032
- Table 9: Chubu Computed Tomography Market in Japan Revenue (Million) Forecast, by Application 2019 & 2032
- Table 10: Kyushu Computed Tomography Market in Japan Revenue (Million) Forecast, by Application 2019 & 2032
- Table 11: Tohoku Computed Tomography Market in Japan Revenue (Million) Forecast, by Application 2019 & 2032
- Table 12: Global Computed Tomography Market in Japan Revenue Million Forecast, by Type 2019 & 2032
- Table 13: Global Computed Tomography Market in Japan Revenue Million Forecast, by Application 2019 & 2032
- Table 14: Global Computed Tomography Market in Japan Revenue Million Forecast, by End-User 2019 & 2032
- Table 15: Global Computed Tomography Market in Japan Revenue Million Forecast, by Country 2019 & 2032
- Table 16: United States Computed Tomography Market in Japan Revenue (Million) Forecast, by Application 2019 & 2032
- Table 17: Canada Computed Tomography Market in Japan Revenue (Million) Forecast, by Application 2019 & 2032
- Table 18: Mexico Computed Tomography Market in Japan Revenue (Million) Forecast, by Application 2019 & 2032
- Table 19: Global Computed Tomography Market in Japan Revenue Million Forecast, by Type 2019 & 2032
- Table 20: Global Computed Tomography Market in Japan Revenue Million Forecast, by Application 2019 & 2032
- Table 21: Global Computed Tomography Market in Japan Revenue Million Forecast, by End-User 2019 & 2032
- Table 22: Global Computed Tomography Market in Japan Revenue Million Forecast, by Country 2019 & 2032
- Table 23: Brazil Computed Tomography Market in Japan Revenue (Million) Forecast, by Application 2019 & 2032
- Table 24: Argentina Computed Tomography Market in Japan Revenue (Million) Forecast, by Application 2019 & 2032
- Table 25: Rest of South America Computed Tomography Market in Japan Revenue (Million) Forecast, by Application 2019 & 2032
- Table 26: Global Computed Tomography Market in Japan Revenue Million Forecast, by Type 2019 & 2032
- Table 27: Global Computed Tomography Market in Japan Revenue Million Forecast, by Application 2019 & 2032
- Table 28: Global Computed Tomography Market in Japan Revenue Million Forecast, by End-User 2019 & 2032
- Table 29: Global Computed Tomography Market in Japan Revenue Million Forecast, by Country 2019 & 2032
- Table 30: United Kingdom Computed Tomography Market in Japan Revenue (Million) Forecast, by Application 2019 & 2032
- Table 31: Germany Computed Tomography Market in Japan Revenue (Million) Forecast, by Application 2019 & 2032
- Table 32: France Computed Tomography Market in Japan Revenue (Million) Forecast, by Application 2019 & 2032
- Table 33: Italy Computed Tomography Market in Japan Revenue (Million) Forecast, by Application 2019 & 2032
- Table 34: Spain Computed Tomography Market in Japan Revenue (Million) Forecast, by Application 2019 & 2032
- Table 35: Russia Computed Tomography Market in Japan Revenue (Million) Forecast, by Application 2019 & 2032
- Table 36: Benelux Computed Tomography Market in Japan Revenue (Million) Forecast, by Application 2019 & 2032
- Table 37: Nordics Computed Tomography Market in Japan Revenue (Million) Forecast, by Application 2019 & 2032
- Table 38: Rest of Europe Computed Tomography Market in Japan Revenue (Million) Forecast, by Application 2019 & 2032
- Table 39: Global Computed Tomography Market in Japan Revenue Million Forecast, by Type 2019 & 2032
- Table 40: Global Computed Tomography Market in Japan Revenue Million Forecast, by Application 2019 & 2032
- Table 41: Global Computed Tomography Market in Japan Revenue Million Forecast, by End-User 2019 & 2032
- Table 42: Global Computed Tomography Market in Japan Revenue Million Forecast, by Country 2019 & 2032
- Table 43: Turkey Computed Tomography Market in Japan Revenue (Million) Forecast, by Application 2019 & 2032
- Table 44: Israel Computed Tomography Market in Japan Revenue (Million) Forecast, by Application 2019 & 2032
- Table 45: GCC Computed Tomography Market in Japan Revenue (Million) Forecast, by Application 2019 & 2032
- Table 46: North Africa Computed Tomography Market in Japan Revenue (Million) Forecast, by Application 2019 & 2032
- Table 47: South Africa Computed Tomography Market in Japan Revenue (Million) Forecast, by Application 2019 & 2032
- Table 48: Rest of Middle East & Africa Computed Tomography Market in Japan Revenue (Million) Forecast, by Application 2019 & 2032
- Table 49: Global Computed Tomography Market in Japan Revenue Million Forecast, by Type 2019 & 2032
- Table 50: Global Computed Tomography Market in Japan Revenue Million Forecast, by Application 2019 & 2032
- Table 51: Global Computed Tomography Market in Japan Revenue Million Forecast, by End-User 2019 & 2032
- Table 52: Global Computed Tomography Market in Japan Revenue Million Forecast, by Country 2019 & 2032
- Table 53: China Computed Tomography Market in Japan Revenue (Million) Forecast, by Application 2019 & 2032
- Table 54: India Computed Tomography Market in Japan Revenue (Million) Forecast, by Application 2019 & 2032
- Table 55: Japan Computed Tomography Market in Japan Revenue (Million) Forecast, by Application 2019 & 2032
- Table 56: South Korea Computed Tomography Market in Japan Revenue (Million) Forecast, by Application 2019 & 2032
- Table 57: ASEAN Computed Tomography Market in Japan Revenue (Million) Forecast, by Application 2019 & 2032
- Table 58: Oceania Computed Tomography Market in Japan Revenue (Million) Forecast, by Application 2019 & 2032
- Table 59: Rest of Asia Pacific Computed Tomography Market in Japan Revenue (Million) Forecast, by Application 2019 & 2032
Frequently Asked Questions
1. What is the projected Compound Annual Growth Rate (CAGR) of the Computed Tomography Market in Japan?
The projected CAGR is approximately 5.87%.
2. Which companies are prominent players in the Computed Tomography Market in Japan?
Key companies in the market include CareStream Health, Siemens Healthineers, GE Healthcare, Dentsply Sirona, Koninklijke Philips NV, J Morita Corporation, Canon Medical Systems Corporation, Planmed Oy, Fujifilm Holdings Corporation.
3. What are the main segments of the Computed Tomography Market in Japan?
The market segments include Type, Application, End-User.
4. Can you provide details about the market size?
The market size is estimated to be USD 0.37 Million as of 2022.
5. What are some drivers contributing to market growth?
Increasing Geriatric Population and Chronic Disease Burden; Technological Advancements in Computed Tomography.
6. What are the notable trends driving market growth?
The Diagnostic Centers Segment is Expected to Witness Significant Growth in End Users.
7. Are there any restraints impacting market growth?
High Cost Associated With CT Scan Procedure and Equipment.
8. Can you provide examples of recent developments in the market?
April 2023: Canon Inc. announced that Canon and the National Cancer Center Japan (NCC) have begun clinical research employing a next-generation X-ray CT system with photon-counting computed tomography (photon-counting CT, PCCT).
9. What pricing options are available for accessing the report?
Pricing options include single-user, multi-user, and enterprise licenses priced at USD 3800, USD 4500, and USD 5800 respectively.
10. Is the market size provided in terms of value or volume?
The market size is provided in terms of value, measured in Million.
11. Are there any specific market keywords associated with the report?
Yes, the market keyword associated with the report is "Computed Tomography Market in Japan," which aids in identifying and referencing the specific market segment covered.
12. How do I determine which pricing option suits my needs best?
The pricing options vary based on user requirements and access needs. Individual users may opt for single-user licenses, while businesses requiring broader access may choose multi-user or enterprise licenses for cost-effective access to the report.
13. Are there any additional resources or data provided in the Computed Tomography Market in Japan report?
While the report offers comprehensive insights, it's advisable to review the specific contents or supplementary materials provided to ascertain if additional resources or data are available.
14. How can I stay updated on further developments or reports in the Computed Tomography Market in Japan?
To stay informed about further developments, trends, and reports in the Computed Tomography Market in Japan, consider subscribing to industry newsletters, following relevant companies and organizations, or regularly checking reputable industry news sources and publications.
Methodology
Step 1 - Identification of Relevant Samples Size from Population Database


Step 2 - Approaches for Defining Global Market Size (Value, Volume* & Price*)

Note*: In applicable scenarios
Step 3 - Data Sources
Primary Research
- Web Analytics
- Survey Reports
- Research Institute
- Latest Research Reports
- Opinion Leaders
Secondary Research
- Annual Reports
- White Paper
- Latest Press Release
- Industry Association
- Paid Database
- Investor Presentations

Step 4 - Data Triangulation
Involves using different sources of information in order to increase the validity of a study
These sources are likely to be stakeholders in a program - participants, other researchers, program staff, other community members, and so on.
Then we put all data in single framework & apply various statistical tools to find out the dynamic on the market.
During the analysis stage, feedback from the stakeholder groups would be compared to determine areas of agreement as well as areas of divergence


