
Key Insights
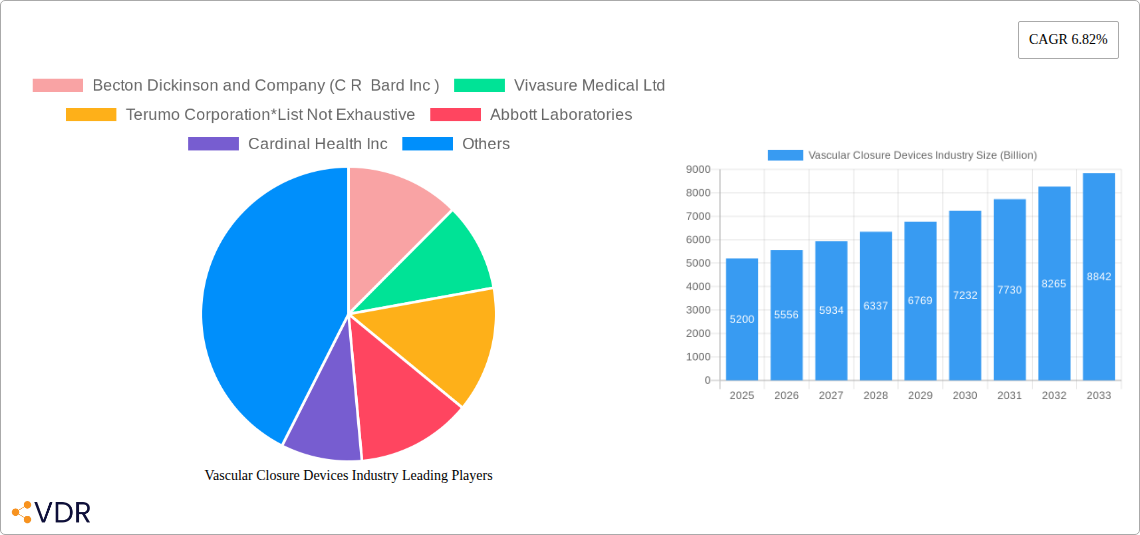
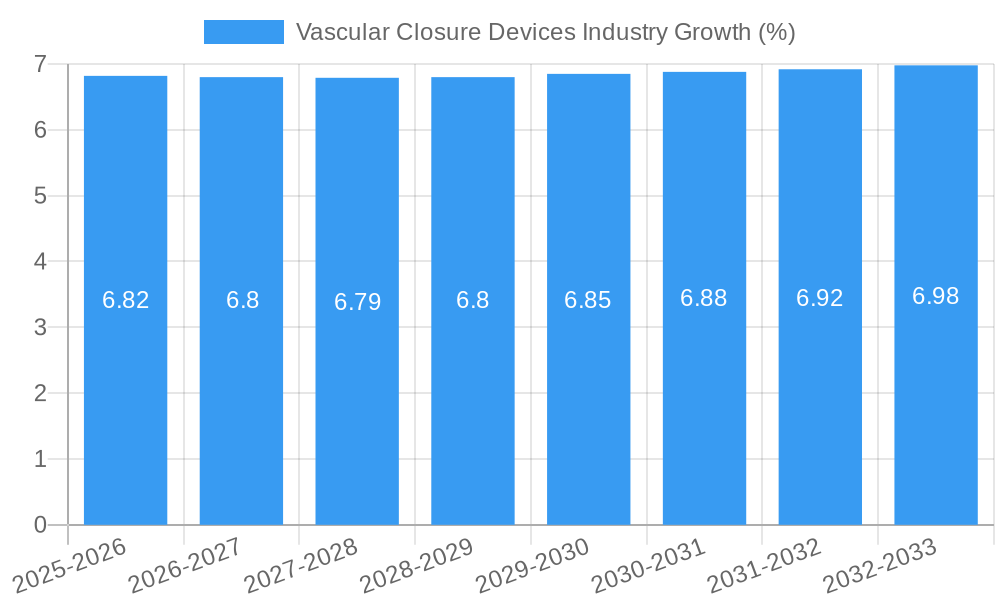
The global Vascular Closure Devices (VCD) market is poised for significant expansion, projected to reach an estimated USD 5.20 billion in 2025 and grow at a robust Compound Annual Growth Rate (CAGR) of 6.82% through 2033. This growth is primarily propelled by the increasing prevalence of cardiovascular diseases and the rising demand for minimally invasive procedures. Technological advancements are continuously refining VCDs, leading to improved patient outcomes, reduced complication rates, and shorter recovery times, all of which contribute to their wider adoption in hospitals and ambulatory surgical centers. The market is segmented into Active Approximators, including clip-based, suture-based, and plug-based devices, and Passive Approximators, such as hemostatic pads, patches, and compression devices, catering to diverse procedural needs.
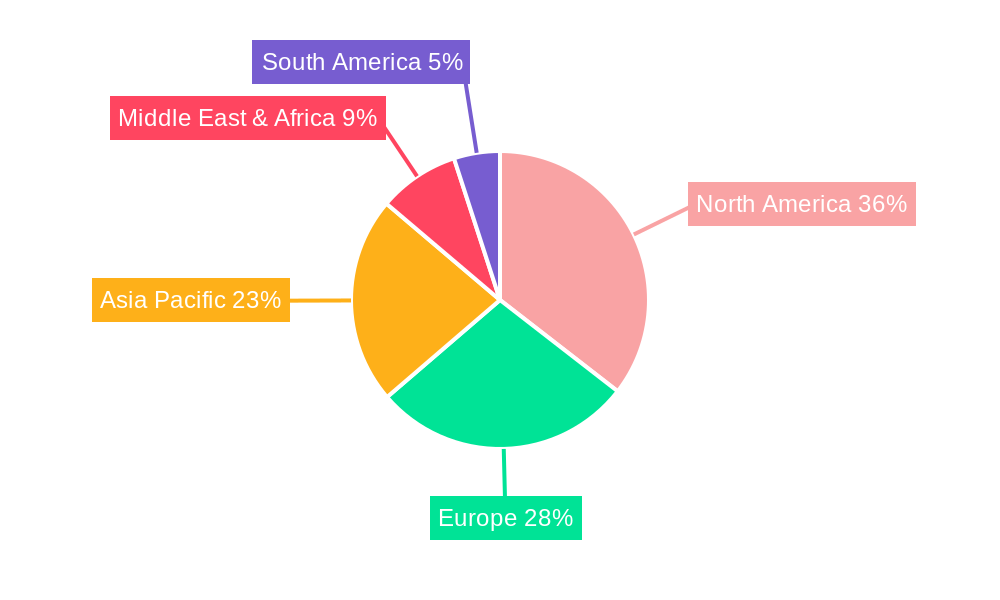
The rising volume of interventional cardiology procedures, including percutaneous coronary interventions (PCI) and diagnostic angiographies, directly fuels the demand for effective VCDs. Furthermore, the shift towards radial access for these procedures, known for its safety and patient comfort, is a significant market driver. While the market demonstrates strong growth potential, certain restraints, such as the relatively higher cost of some advanced VCDs and the need for skilled personnel for optimal deployment, could temper immediate adoption rates in certain regions. However, ongoing research and development efforts, coupled with increasing healthcare expenditure globally, are expected to mitigate these challenges, solidifying the VCD market's upward trajectory. North America is anticipated to lead the market in terms of revenue, followed by Europe, with the Asia Pacific region showcasing the highest growth potential due to its burgeoning healthcare infrastructure and increasing awareness of advanced medical technologies.
This in-depth report provides a definitive analysis of the global Vascular Closure Devices (VCD) market, offering a strategic roadmap for stakeholders navigating this dynamic sector. Covering the period from 2019 to 2033, with a base year of 2025 and a focus on the forecast period 2025–2033, this report delves into intricate market dynamics, growth trajectories, and competitive landscapes. We meticulously examine parent and child markets, providing unparalleled insights into opportunities for innovation, strategic investment, and market penetration. All monetary values are presented in Billion USD.
Vascular Closure Devices Industry Market Dynamics & Structure
The Vascular Closure Devices market is characterized by a moderate to high concentration, driven by significant technological advancements and stringent regulatory frameworks. Key players are heavily invested in research and development, pushing the boundaries of vascular access closure and hemostasis solutions. The competitive landscape is shaped by the interplay of innovation, product differentiation, and strategic mergers and acquisitions. End-user demographics, particularly the increasing demand for minimally invasive procedures, are profoundly influencing market direction.
- Technological Innovation Drivers: Miniaturization of devices, improved biocompatibility, and development of advanced sealing mechanisms are paramount. The focus is on reducing complications like bleeding, hematoma, and pseudoaneurysm.
- Regulatory Frameworks: Strict adherence to FDA, CE, and other regional regulatory approvals is critical for market entry and product commercialization. Post-market surveillance and quality management systems are essential.
- Competitive Product Substitutes: While VCDs are dominant, traditional manual compression and suturing techniques remain viable alternatives in certain scenarios, necessitating continuous innovation in VCD efficacy and cost-effectiveness.
- End-User Demographics: The rising prevalence of cardiovascular diseases, increased adoption of interventional cardiology and radiology procedures, and an aging global population are key drivers of demand for VCDs.
- M&A Trends: Strategic acquisitions are common, with larger companies seeking to expand their product portfolios and market reach by acquiring innovative VCD startups or established players. For instance, the acquisition of Cardiva Medical, Inc. by Haemonetics Corporation highlights this trend.
- Market Concentration: Leading companies like Becton Dickinson and Company (C R Bard Inc), Abbott Laboratories, and Medtronic PLC hold significant market shares, but niche players are emerging with specialized technologies. The estimated market share for active approximators is xx%, and for passive approximators, it is xx%.
Vascular Closure Devices Industry Growth Trends & Insights
The Vascular Closure Devices market size is projected to witness robust expansion, fueled by an escalating volume of percutaneous cardiovascular interventions and peripheral vascular procedures. The increasing preference for radial access over femoral access is a significant trend, driven by patient comfort and reduced complication rates, which directly impacts the demand for specific VCD types. Technological disruptions, such as the development of smart VCDs with integrated monitoring capabilities and bioabsorbable materials, are expected to revolutionize patient care and drive adoption rates. Consumer behavior shifts are evident, with patients and physicians increasingly prioritizing rapid recovery and early ambulation post-procedure.
The market is also experiencing a surge in demand for devices that offer enhanced safety profiles, minimizing the risk of vascular complications. This includes innovations in clip-based devices, suture-based devices, and plug-based devices, each catering to specific anatomical and procedural needs. The growing emphasis on cost-effectiveness in healthcare systems worldwide is spurring the development of more affordable yet effective VCD solutions. Moreover, the expanding healthcare infrastructure in emerging economies is creating new avenues for market penetration, further accelerating the growth of the Vascular Closure Devices industry.
The market penetration of VCDs is steadily increasing as awareness of their benefits, such as reduced procedure time and improved patient outcomes, grows among healthcare professionals. The projected Compound Annual Growth Rate (CAGR) for the Vascular Closure Devices market is estimated to be in the range of xx% to xx% over the forecast period. This growth trajectory is underpinned by continuous innovation and a widening array of applications for these devices across various medical specialties.
Dominant Regions, Countries, or Segments in Vascular Closure Devices Industry
North America currently stands as the dominant region in the Vascular Closure Devices market, propelled by a high prevalence of cardiovascular diseases, advanced healthcare infrastructure, and widespread adoption of interventional procedures. The United States, in particular, represents a substantial market share due to its robust healthcare spending and a well-established ecosystem for medical device innovation and commercialization. The femoral access segment has historically been a major revenue generator, but the growing preference for radial access in procedures like percutaneous coronary intervention (PCI) is rapidly reshaping the market landscape.
In terms of product type, Active Approximators continue to command a significant market share, with suture-based devices and clip-based devices being particularly prominent. These devices offer reliable and precise closure, crucial for preventing complications in high-risk patients. However, Passive Approximators, including hemostatic pads and patches and compression devices, are gaining traction due to their ease of use and cost-effectiveness, especially in less complex cases.
The Hospitals segment remains the largest end-user, driven by the high volume of vascular access procedures performed within these institutions. Ambulatory Surgical Centres are also emerging as significant contributors, reflecting the trend towards outpatient procedures and increased efficiency in healthcare delivery. The growth in these segments is further amplified by supportive economic policies aimed at improving healthcare access and quality, along with substantial investments in medical infrastructure.
- North America: Dominates due to high procedural volumes, advanced technology adoption, and favorable reimbursement policies.
- Europe: A strong secondary market driven by increasing adoption of interventional cardiology and a growing elderly population.
- Asia Pacific: Poised for significant growth, fueled by expanding healthcare infrastructure, rising disposable incomes, and increasing awareness of advanced medical technologies.
- Femoral Access: While still substantial, its dominance is being challenged by the rise of radial access.
- Radial Access: Experiencing rapid growth due to improved patient outcomes and physician preference.
- Active Approximators (Clip-based, Suture-based, Plug-based): Key segments offering robust and reliable closure solutions.
- Passive Approximators (Hemostatic Pads, Compression Devices): Growing in popularity due to ease of use and cost-effectiveness.
- Hospitals: The primary end-user segment, accounting for the largest share of VCD utilization.
- Ambulatory Surgical Centres: An increasingly important segment for VCDs, reflecting the shift towards outpatient care.
Vascular Closure Devices Industry Product Landscape
The Vascular Closure Devices product landscape is characterized by continuous innovation aimed at enhancing efficacy, safety, and user-friendliness. Key product advancements include the development of bioabsorbable materials that naturally dissolve in the body, reducing the risk of long-term complications. Miniaturization of devices allows for application through smaller access sites, leading to improved patient comfort and faster recovery times. Innovations in plug-based devices offer rapid sealing with minimal tissue manipulation, while advanced clip-based devices provide secure approximation of the vessel wall. The performance metrics of these devices are rigorously evaluated for hemostatic efficacy, complication rates (e.g., bleeding, hematoma), ease of deployment, and patient comfort, driving the competitive advantage for manufacturers.
Key Drivers, Barriers & Challenges in Vascular Closure Devices Industry
Key Drivers:
- Rising Prevalence of Cardiovascular Diseases: The global increase in heart-related conditions necessitates more interventional procedures, directly boosting demand for VCDs.
- Technological Advancements: Development of smaller, safer, and more effective devices, including bioabsorbable options, is a significant growth catalyst.
- Preference for Minimally Invasive Procedures: Patients and physicians favor procedures with quicker recovery and reduced complications, aligning perfectly with VCD benefits.
- Expansion of Radial Access: The increasing adoption of radial artery access for cardiovascular interventions is driving the demand for specialized VCDs.
Barriers & Challenges:
- High Cost of Advanced Devices: Some innovative VCDs can be expensive, posing a barrier to adoption in cost-sensitive healthcare systems.
- Physician Training and Learning Curve: Proper training is essential for optimal VCD utilization, and a lack of widespread, consistent training can hinder adoption.
- Regulatory Hurdles: Obtaining approvals from regulatory bodies like the FDA and EMA can be a lengthy and complex process, delaying market entry.
- Competition from Manual Compression: Traditional manual compression, though less efficient, remains a cost-effective alternative in some settings, posing a competitive challenge. Supply chain disruptions for critical components can also impact market availability.
Emerging Opportunities in Vascular Closure Devices Industry
Emerging opportunities in the Vascular Closure Devices market lie in the development of smart VCDs with integrated sensing capabilities for real-time monitoring of hemostasis. Furthermore, the untapped potential in emerging economies, particularly in the Asia Pacific and Latin America regions, presents significant growth avenues as healthcare infrastructure and patient awareness increase. The development of cost-effective VCDs tailored for resource-limited settings is another key opportunity. The application of VCDs in novel interventional procedures beyond cardiology, such as neurovascular and peripheral interventions, also holds considerable promise.
Growth Accelerators in the Vascular Closure Devices Industry Industry
Catalysts driving long-term growth in the Vascular Closure Devices industry include ongoing technological breakthroughs in biomaterials and device design, leading to superior performance and reduced patient invasiveness. Strategic partnerships between VCD manufacturers and interventional device companies are crucial for synergistic product development and market penetration. Furthermore, aggressive market expansion strategies, including direct sales forces and distributor networks in underserved regions, will be pivotal in capitalizing on the global demand for effective vascular closure solutions.
Key Players Shaping the Vascular Closure Devices Industry Market
- Becton Dickinson and Company (C R Bard Inc)
- Abbott Laboratories
- Medtronic PLC
- Terumo Corporation
- Cardinal Health Inc
- B Braun Melsungen AG
- Vivasure Medical Ltd
- Biotronik SE & Co KG
- Cardiva Medical Inc
- Advanced Vascular Dynamics
Notable Milestones in Vascular Closure Devices Industry Sector
- July 2021: Vivasure Medical reported the commencement of the development program for PerQseal Blue, an advancement based on their European-approved vascular closure device for femoral arteries.
- January 2021: Haemonetics Corporation announced a definitive agreement to acquire Cardiva Medical, Inc., a prominent manufacturer of vascular closure systems, enhancing its portfolio in the vascular access management space.
In-Depth Vascular Closure Devices Industry Market Outlook
The Vascular Closure Devices market is on a strong upward trajectory, driven by a confluence of factors including an aging global population, increasing incidence of cardiovascular diseases, and a clear shift towards minimally invasive surgical techniques. Future growth will be significantly accelerated by innovations in bioresorbable materials and smart device technologies that offer enhanced safety and efficacy. Strategic collaborations and a focused approach to penetrating emerging markets will be critical for sustained expansion. The industry is poised for substantial growth, with a focus on providing seamless, patient-centric vascular access closure solutions.
Vascular Closure Devices Industry Segmentation
-
1. Product Type
-
1.1. Active Approximators
- 1.1.1. Clip-based Devices
- 1.1.2. Suture-based Devices
- 1.1.3. Plug-based Devices
-
1.2. Passive Approximators
- 1.2.1. Hemostatic Pads and Patches
- 1.2.2. Compression Devices
-
1.1. Active Approximators
-
2. Mode of Access
- 2.1. Femoral Access
- 2.2. Radial Access
-
3. End User
- 3.1. Hospitals
- 3.2. Ambulatory Surgical Centres
- 3.3. Other End Users
Vascular Closure Devices Industry Segmentation By Geography
-
1. North America
- 1.1. United States
- 1.2. Canada
- 1.3. Mexico
-
2. Europe
- 2.1. Germany
- 2.2. United Kingdom
- 2.3. France
- 2.4. Italy
- 2.5. Spain
- 2.6. Rest of Europe
-
3. Asia Pacific
- 3.1. China
- 3.2. Japan
- 3.3. India
- 3.4. Australia
- 3.5. South korea
- 3.6. Rest of Asia Pacific
- 4. Middle East
-
5. GCC
- 5.1. South Africa
- 5.2. Rest of Middle East
-
6. South America
- 6.1. Brazil
- 6.2. Argentina
- 6.3. Rest of South America
Vascular Closure Devices Industry REPORT HIGHLIGHTS
| Aspects | Details |
|---|---|
| Study Period | 2019-2033 |
| Base Year | 2024 |
| Estimated Year | 2025 |
| Forecast Period | 2025-2033 |
| Historical Period | 2019-2024 |
| Growth Rate | CAGR of 6.82% from 2019-2033 |
| Segmentation |
|
Table of Contents
- 1. Introduction
- 1.1. Research Scope
- 1.2. Market Segmentation
- 1.3. Research Methodology
- 1.4. Definitions and Assumptions
- 2. Executive Summary
- 2.1. Introduction
- 3. Market Dynamics
- 3.1. Introduction
- 3.2. Market Drivers
- 3.2.1. Increase in Catheterization-related Procedures; Increase in Demand for Minimally Invasive Solutions; Ease of Use of VCDs
- 3.3. Market Restrains
- 3.3.1. High Cost of Products; Complications Associated with VCDs
- 3.4. Market Trends
- 3.4.1. Femoral Access Segment is Expected to Show Significant Growth Over the Forecast Period
- 4. Market Factor Analysis
- 4.1. Porters Five Forces
- 4.2. Supply/Value Chain
- 4.3. PESTEL analysis
- 4.4. Market Entropy
- 4.5. Patent/Trademark Analysis
- 5. Global Vascular Closure Devices Industry Analysis, Insights and Forecast, 2019-2031
- 5.1. Market Analysis, Insights and Forecast - by Product Type
- 5.1.1. Active Approximators
- 5.1.1.1. Clip-based Devices
- 5.1.1.2. Suture-based Devices
- 5.1.1.3. Plug-based Devices
- 5.1.2. Passive Approximators
- 5.1.2.1. Hemostatic Pads and Patches
- 5.1.2.2. Compression Devices
- 5.1.1. Active Approximators
- 5.2. Market Analysis, Insights and Forecast - by Mode of Access
- 5.2.1. Femoral Access
- 5.2.2. Radial Access
- 5.3. Market Analysis, Insights and Forecast - by End User
- 5.3.1. Hospitals
- 5.3.2. Ambulatory Surgical Centres
- 5.3.3. Other End Users
- 5.4. Market Analysis, Insights and Forecast - by Region
- 5.4.1. North America
- 5.4.2. Europe
- 5.4.3. Asia Pacific
- 5.4.4. Middle East
- 5.4.5. GCC
- 5.4.6. South America
- 5.1. Market Analysis, Insights and Forecast - by Product Type
- 6. North America Vascular Closure Devices Industry Analysis, Insights and Forecast, 2019-2031
- 6.1. Market Analysis, Insights and Forecast - by Product Type
- 6.1.1. Active Approximators
- 6.1.1.1. Clip-based Devices
- 6.1.1.2. Suture-based Devices
- 6.1.1.3. Plug-based Devices
- 6.1.2. Passive Approximators
- 6.1.2.1. Hemostatic Pads and Patches
- 6.1.2.2. Compression Devices
- 6.1.1. Active Approximators
- 6.2. Market Analysis, Insights and Forecast - by Mode of Access
- 6.2.1. Femoral Access
- 6.2.2. Radial Access
- 6.3. Market Analysis, Insights and Forecast - by End User
- 6.3.1. Hospitals
- 6.3.2. Ambulatory Surgical Centres
- 6.3.3. Other End Users
- 6.1. Market Analysis, Insights and Forecast - by Product Type
- 7. Europe Vascular Closure Devices Industry Analysis, Insights and Forecast, 2019-2031
- 7.1. Market Analysis, Insights and Forecast - by Product Type
- 7.1.1. Active Approximators
- 7.1.1.1. Clip-based Devices
- 7.1.1.2. Suture-based Devices
- 7.1.1.3. Plug-based Devices
- 7.1.2. Passive Approximators
- 7.1.2.1. Hemostatic Pads and Patches
- 7.1.2.2. Compression Devices
- 7.1.1. Active Approximators
- 7.2. Market Analysis, Insights and Forecast - by Mode of Access
- 7.2.1. Femoral Access
- 7.2.2. Radial Access
- 7.3. Market Analysis, Insights and Forecast - by End User
- 7.3.1. Hospitals
- 7.3.2. Ambulatory Surgical Centres
- 7.3.3. Other End Users
- 7.1. Market Analysis, Insights and Forecast - by Product Type
- 8. Asia Pacific Vascular Closure Devices Industry Analysis, Insights and Forecast, 2019-2031
- 8.1. Market Analysis, Insights and Forecast - by Product Type
- 8.1.1. Active Approximators
- 8.1.1.1. Clip-based Devices
- 8.1.1.2. Suture-based Devices
- 8.1.1.3. Plug-based Devices
- 8.1.2. Passive Approximators
- 8.1.2.1. Hemostatic Pads and Patches
- 8.1.2.2. Compression Devices
- 8.1.1. Active Approximators
- 8.2. Market Analysis, Insights and Forecast - by Mode of Access
- 8.2.1. Femoral Access
- 8.2.2. Radial Access
- 8.3. Market Analysis, Insights and Forecast - by End User
- 8.3.1. Hospitals
- 8.3.2. Ambulatory Surgical Centres
- 8.3.3. Other End Users
- 8.1. Market Analysis, Insights and Forecast - by Product Type
- 9. Middle East Vascular Closure Devices Industry Analysis, Insights and Forecast, 2019-2031
- 9.1. Market Analysis, Insights and Forecast - by Product Type
- 9.1.1. Active Approximators
- 9.1.1.1. Clip-based Devices
- 9.1.1.2. Suture-based Devices
- 9.1.1.3. Plug-based Devices
- 9.1.2. Passive Approximators
- 9.1.2.1. Hemostatic Pads and Patches
- 9.1.2.2. Compression Devices
- 9.1.1. Active Approximators
- 9.2. Market Analysis, Insights and Forecast - by Mode of Access
- 9.2.1. Femoral Access
- 9.2.2. Radial Access
- 9.3. Market Analysis, Insights and Forecast - by End User
- 9.3.1. Hospitals
- 9.3.2. Ambulatory Surgical Centres
- 9.3.3. Other End Users
- 9.1. Market Analysis, Insights and Forecast - by Product Type
- 10. GCC Vascular Closure Devices Industry Analysis, Insights and Forecast, 2019-2031
- 10.1. Market Analysis, Insights and Forecast - by Product Type
- 10.1.1. Active Approximators
- 10.1.1.1. Clip-based Devices
- 10.1.1.2. Suture-based Devices
- 10.1.1.3. Plug-based Devices
- 10.1.2. Passive Approximators
- 10.1.2.1. Hemostatic Pads and Patches
- 10.1.2.2. Compression Devices
- 10.1.1. Active Approximators
- 10.2. Market Analysis, Insights and Forecast - by Mode of Access
- 10.2.1. Femoral Access
- 10.2.2. Radial Access
- 10.3. Market Analysis, Insights and Forecast - by End User
- 10.3.1. Hospitals
- 10.3.2. Ambulatory Surgical Centres
- 10.3.3. Other End Users
- 10.1. Market Analysis, Insights and Forecast - by Product Type
- 11. South America Vascular Closure Devices Industry Analysis, Insights and Forecast, 2019-2031
- 11.1. Market Analysis, Insights and Forecast - by Product Type
- 11.1.1. Active Approximators
- 11.1.1.1. Clip-based Devices
- 11.1.1.2. Suture-based Devices
- 11.1.1.3. Plug-based Devices
- 11.1.2. Passive Approximators
- 11.1.2.1. Hemostatic Pads and Patches
- 11.1.2.2. Compression Devices
- 11.1.1. Active Approximators
- 11.2. Market Analysis, Insights and Forecast - by Mode of Access
- 11.2.1. Femoral Access
- 11.2.2. Radial Access
- 11.3. Market Analysis, Insights and Forecast - by End User
- 11.3.1. Hospitals
- 11.3.2. Ambulatory Surgical Centres
- 11.3.3. Other End Users
- 11.1. Market Analysis, Insights and Forecast - by Product Type
- 12. North Americ Vascular Closure Devices Industry Analysis, Insights and Forecast, 2019-2031
- 12.1. Market Analysis, Insights and Forecast - By Country/Sub-region
- 12.1.1 United States
- 12.1.2 Canada
- 12.1.3 Mexico
- 13. South America Vascular Closure Devices Industry Analysis, Insights and Forecast, 2019-2031
- 13.1. Market Analysis, Insights and Forecast - By Country/Sub-region
- 13.1.1 Brazil
- 13.1.2 Mexico
- 13.1.3 Rest of South America
- 14. Europe Vascular Closure Devices Industry Analysis, Insights and Forecast, 2019-2031
- 14.1. Market Analysis, Insights and Forecast - By Country/Sub-region
- 14.1.1 Germany
- 14.1.2 United Kingdom
- 14.1.3 France
- 14.1.4 Italy
- 14.1.5 Spain
- 14.1.6 Rest of Europe
- 15. Asia Pacific Vascular Closure Devices Industry Analysis, Insights and Forecast, 2019-2031
- 15.1. Market Analysis, Insights and Forecast - By Country/Sub-region
- 15.1.1 China
- 15.1.2 Japan
- 15.1.3 India
- 15.1.4 South Korea
- 15.1.5 Taiwan
- 15.1.6 Australia
- 15.1.7 Rest of Asia-Pacific
- 16. MEA Vascular Closure Devices Industry Analysis, Insights and Forecast, 2019-2031
- 16.1. Market Analysis, Insights and Forecast - By Country/Sub-region
- 16.1.1 Middle East
- 16.1.2 Africa
- 17. Competitive Analysis
- 17.1. Global Market Share Analysis 2024
- 17.2. Company Profiles
- 17.2.1 Becton Dickinson and Company (C R Bard Inc )
- 17.2.1.1. Overview
- 17.2.1.2. Products
- 17.2.1.3. SWOT Analysis
- 17.2.1.4. Recent Developments
- 17.2.1.5. Financials (Based on Availability)
- 17.2.2 Vivasure Medical Ltd
- 17.2.2.1. Overview
- 17.2.2.2. Products
- 17.2.2.3. SWOT Analysis
- 17.2.2.4. Recent Developments
- 17.2.2.5. Financials (Based on Availability)
- 17.2.3 Terumo Corporation*List Not Exhaustive
- 17.2.3.1. Overview
- 17.2.3.2. Products
- 17.2.3.3. SWOT Analysis
- 17.2.3.4. Recent Developments
- 17.2.3.5. Financials (Based on Availability)
- 17.2.4 Abbott Laboratories
- 17.2.4.1. Overview
- 17.2.4.2. Products
- 17.2.4.3. SWOT Analysis
- 17.2.4.4. Recent Developments
- 17.2.4.5. Financials (Based on Availability)
- 17.2.5 Cardinal Health Inc
- 17.2.5.1. Overview
- 17.2.5.2. Products
- 17.2.5.3. SWOT Analysis
- 17.2.5.4. Recent Developments
- 17.2.5.5. Financials (Based on Availability)
- 17.2.6 Medtronic PLC
- 17.2.6.1. Overview
- 17.2.6.2. Products
- 17.2.6.3. SWOT Analysis
- 17.2.6.4. Recent Developments
- 17.2.6.5. Financials (Based on Availability)
- 17.2.7 Advanced Vascular Dynamics
- 17.2.7.1. Overview
- 17.2.7.2. Products
- 17.2.7.3. SWOT Analysis
- 17.2.7.4. Recent Developments
- 17.2.7.5. Financials (Based on Availability)
- 17.2.8 Cardiva Medical Inc
- 17.2.8.1. Overview
- 17.2.8.2. Products
- 17.2.8.3. SWOT Analysis
- 17.2.8.4. Recent Developments
- 17.2.8.5. Financials (Based on Availability)
- 17.2.9 Biotronik SE & Co KG
- 17.2.9.1. Overview
- 17.2.9.2. Products
- 17.2.9.3. SWOT Analysis
- 17.2.9.4. Recent Developments
- 17.2.9.5. Financials (Based on Availability)
- 17.2.10 B Braun Melsungen AG
- 17.2.10.1. Overview
- 17.2.10.2. Products
- 17.2.10.3. SWOT Analysis
- 17.2.10.4. Recent Developments
- 17.2.10.5. Financials (Based on Availability)
- 17.2.1 Becton Dickinson and Company (C R Bard Inc )
List of Figures
- Figure 1: Global Vascular Closure Devices Industry Revenue Breakdown (Billion, %) by Region 2024 & 2032
- Figure 2: Global Vascular Closure Devices Industry Volume Breakdown (K Units, %) by Region 2024 & 2032
- Figure 3: North Americ Vascular Closure Devices Industry Revenue (Billion), by Country 2024 & 2032
- Figure 4: North Americ Vascular Closure Devices Industry Volume (K Units), by Country 2024 & 2032
- Figure 5: North Americ Vascular Closure Devices Industry Revenue Share (%), by Country 2024 & 2032
- Figure 6: North Americ Vascular Closure Devices Industry Volume Share (%), by Country 2024 & 2032
- Figure 7: South America Vascular Closure Devices Industry Revenue (Billion), by Country 2024 & 2032
- Figure 8: South America Vascular Closure Devices Industry Volume (K Units), by Country 2024 & 2032
- Figure 9: South America Vascular Closure Devices Industry Revenue Share (%), by Country 2024 & 2032
- Figure 10: South America Vascular Closure Devices Industry Volume Share (%), by Country 2024 & 2032
- Figure 11: Europe Vascular Closure Devices Industry Revenue (Billion), by Country 2024 & 2032
- Figure 12: Europe Vascular Closure Devices Industry Volume (K Units), by Country 2024 & 2032
- Figure 13: Europe Vascular Closure Devices Industry Revenue Share (%), by Country 2024 & 2032
- Figure 14: Europe Vascular Closure Devices Industry Volume Share (%), by Country 2024 & 2032
- Figure 15: Asia Pacific Vascular Closure Devices Industry Revenue (Billion), by Country 2024 & 2032
- Figure 16: Asia Pacific Vascular Closure Devices Industry Volume (K Units), by Country 2024 & 2032
- Figure 17: Asia Pacific Vascular Closure Devices Industry Revenue Share (%), by Country 2024 & 2032
- Figure 18: Asia Pacific Vascular Closure Devices Industry Volume Share (%), by Country 2024 & 2032
- Figure 19: MEA Vascular Closure Devices Industry Revenue (Billion), by Country 2024 & 2032
- Figure 20: MEA Vascular Closure Devices Industry Volume (K Units), by Country 2024 & 2032
- Figure 21: MEA Vascular Closure Devices Industry Revenue Share (%), by Country 2024 & 2032
- Figure 22: MEA Vascular Closure Devices Industry Volume Share (%), by Country 2024 & 2032
- Figure 23: North America Vascular Closure Devices Industry Revenue (Billion), by Product Type 2024 & 2032
- Figure 24: North America Vascular Closure Devices Industry Volume (K Units), by Product Type 2024 & 2032
- Figure 25: North America Vascular Closure Devices Industry Revenue Share (%), by Product Type 2024 & 2032
- Figure 26: North America Vascular Closure Devices Industry Volume Share (%), by Product Type 2024 & 2032
- Figure 27: North America Vascular Closure Devices Industry Revenue (Billion), by Mode of Access 2024 & 2032
- Figure 28: North America Vascular Closure Devices Industry Volume (K Units), by Mode of Access 2024 & 2032
- Figure 29: North America Vascular Closure Devices Industry Revenue Share (%), by Mode of Access 2024 & 2032
- Figure 30: North America Vascular Closure Devices Industry Volume Share (%), by Mode of Access 2024 & 2032
- Figure 31: North America Vascular Closure Devices Industry Revenue (Billion), by End User 2024 & 2032
- Figure 32: North America Vascular Closure Devices Industry Volume (K Units), by End User 2024 & 2032
- Figure 33: North America Vascular Closure Devices Industry Revenue Share (%), by End User 2024 & 2032
- Figure 34: North America Vascular Closure Devices Industry Volume Share (%), by End User 2024 & 2032
- Figure 35: North America Vascular Closure Devices Industry Revenue (Billion), by Country 2024 & 2032
- Figure 36: North America Vascular Closure Devices Industry Volume (K Units), by Country 2024 & 2032
- Figure 37: North America Vascular Closure Devices Industry Revenue Share (%), by Country 2024 & 2032
- Figure 38: North America Vascular Closure Devices Industry Volume Share (%), by Country 2024 & 2032
- Figure 39: Europe Vascular Closure Devices Industry Revenue (Billion), by Product Type 2024 & 2032
- Figure 40: Europe Vascular Closure Devices Industry Volume (K Units), by Product Type 2024 & 2032
- Figure 41: Europe Vascular Closure Devices Industry Revenue Share (%), by Product Type 2024 & 2032
- Figure 42: Europe Vascular Closure Devices Industry Volume Share (%), by Product Type 2024 & 2032
- Figure 43: Europe Vascular Closure Devices Industry Revenue (Billion), by Mode of Access 2024 & 2032
- Figure 44: Europe Vascular Closure Devices Industry Volume (K Units), by Mode of Access 2024 & 2032
- Figure 45: Europe Vascular Closure Devices Industry Revenue Share (%), by Mode of Access 2024 & 2032
- Figure 46: Europe Vascular Closure Devices Industry Volume Share (%), by Mode of Access 2024 & 2032
- Figure 47: Europe Vascular Closure Devices Industry Revenue (Billion), by End User 2024 & 2032
- Figure 48: Europe Vascular Closure Devices Industry Volume (K Units), by End User 2024 & 2032
- Figure 49: Europe Vascular Closure Devices Industry Revenue Share (%), by End User 2024 & 2032
- Figure 50: Europe Vascular Closure Devices Industry Volume Share (%), by End User 2024 & 2032
- Figure 51: Europe Vascular Closure Devices Industry Revenue (Billion), by Country 2024 & 2032
- Figure 52: Europe Vascular Closure Devices Industry Volume (K Units), by Country 2024 & 2032
- Figure 53: Europe Vascular Closure Devices Industry Revenue Share (%), by Country 2024 & 2032
- Figure 54: Europe Vascular Closure Devices Industry Volume Share (%), by Country 2024 & 2032
- Figure 55: Asia Pacific Vascular Closure Devices Industry Revenue (Billion), by Product Type 2024 & 2032
- Figure 56: Asia Pacific Vascular Closure Devices Industry Volume (K Units), by Product Type 2024 & 2032
- Figure 57: Asia Pacific Vascular Closure Devices Industry Revenue Share (%), by Product Type 2024 & 2032
- Figure 58: Asia Pacific Vascular Closure Devices Industry Volume Share (%), by Product Type 2024 & 2032
- Figure 59: Asia Pacific Vascular Closure Devices Industry Revenue (Billion), by Mode of Access 2024 & 2032
- Figure 60: Asia Pacific Vascular Closure Devices Industry Volume (K Units), by Mode of Access 2024 & 2032
- Figure 61: Asia Pacific Vascular Closure Devices Industry Revenue Share (%), by Mode of Access 2024 & 2032
- Figure 62: Asia Pacific Vascular Closure Devices Industry Volume Share (%), by Mode of Access 2024 & 2032
- Figure 63: Asia Pacific Vascular Closure Devices Industry Revenue (Billion), by End User 2024 & 2032
- Figure 64: Asia Pacific Vascular Closure Devices Industry Volume (K Units), by End User 2024 & 2032
- Figure 65: Asia Pacific Vascular Closure Devices Industry Revenue Share (%), by End User 2024 & 2032
- Figure 66: Asia Pacific Vascular Closure Devices Industry Volume Share (%), by End User 2024 & 2032
- Figure 67: Asia Pacific Vascular Closure Devices Industry Revenue (Billion), by Country 2024 & 2032
- Figure 68: Asia Pacific Vascular Closure Devices Industry Volume (K Units), by Country 2024 & 2032
- Figure 69: Asia Pacific Vascular Closure Devices Industry Revenue Share (%), by Country 2024 & 2032
- Figure 70: Asia Pacific Vascular Closure Devices Industry Volume Share (%), by Country 2024 & 2032
- Figure 71: Middle East Vascular Closure Devices Industry Revenue (Billion), by Product Type 2024 & 2032
- Figure 72: Middle East Vascular Closure Devices Industry Volume (K Units), by Product Type 2024 & 2032
- Figure 73: Middle East Vascular Closure Devices Industry Revenue Share (%), by Product Type 2024 & 2032
- Figure 74: Middle East Vascular Closure Devices Industry Volume Share (%), by Product Type 2024 & 2032
- Figure 75: Middle East Vascular Closure Devices Industry Revenue (Billion), by Mode of Access 2024 & 2032
- Figure 76: Middle East Vascular Closure Devices Industry Volume (K Units), by Mode of Access 2024 & 2032
- Figure 77: Middle East Vascular Closure Devices Industry Revenue Share (%), by Mode of Access 2024 & 2032
- Figure 78: Middle East Vascular Closure Devices Industry Volume Share (%), by Mode of Access 2024 & 2032
- Figure 79: Middle East Vascular Closure Devices Industry Revenue (Billion), by End User 2024 & 2032
- Figure 80: Middle East Vascular Closure Devices Industry Volume (K Units), by End User 2024 & 2032
- Figure 81: Middle East Vascular Closure Devices Industry Revenue Share (%), by End User 2024 & 2032
- Figure 82: Middle East Vascular Closure Devices Industry Volume Share (%), by End User 2024 & 2032
- Figure 83: Middle East Vascular Closure Devices Industry Revenue (Billion), by Country 2024 & 2032
- Figure 84: Middle East Vascular Closure Devices Industry Volume (K Units), by Country 2024 & 2032
- Figure 85: Middle East Vascular Closure Devices Industry Revenue Share (%), by Country 2024 & 2032
- Figure 86: Middle East Vascular Closure Devices Industry Volume Share (%), by Country 2024 & 2032
- Figure 87: GCC Vascular Closure Devices Industry Revenue (Billion), by Product Type 2024 & 2032
- Figure 88: GCC Vascular Closure Devices Industry Volume (K Units), by Product Type 2024 & 2032
- Figure 89: GCC Vascular Closure Devices Industry Revenue Share (%), by Product Type 2024 & 2032
- Figure 90: GCC Vascular Closure Devices Industry Volume Share (%), by Product Type 2024 & 2032
- Figure 91: GCC Vascular Closure Devices Industry Revenue (Billion), by Mode of Access 2024 & 2032
- Figure 92: GCC Vascular Closure Devices Industry Volume (K Units), by Mode of Access 2024 & 2032
- Figure 93: GCC Vascular Closure Devices Industry Revenue Share (%), by Mode of Access 2024 & 2032
- Figure 94: GCC Vascular Closure Devices Industry Volume Share (%), by Mode of Access 2024 & 2032
- Figure 95: GCC Vascular Closure Devices Industry Revenue (Billion), by End User 2024 & 2032
- Figure 96: GCC Vascular Closure Devices Industry Volume (K Units), by End User 2024 & 2032
- Figure 97: GCC Vascular Closure Devices Industry Revenue Share (%), by End User 2024 & 2032
- Figure 98: GCC Vascular Closure Devices Industry Volume Share (%), by End User 2024 & 2032
- Figure 99: GCC Vascular Closure Devices Industry Revenue (Billion), by Country 2024 & 2032
- Figure 100: GCC Vascular Closure Devices Industry Volume (K Units), by Country 2024 & 2032
- Figure 101: GCC Vascular Closure Devices Industry Revenue Share (%), by Country 2024 & 2032
- Figure 102: GCC Vascular Closure Devices Industry Volume Share (%), by Country 2024 & 2032
- Figure 103: South America Vascular Closure Devices Industry Revenue (Billion), by Product Type 2024 & 2032
- Figure 104: South America Vascular Closure Devices Industry Volume (K Units), by Product Type 2024 & 2032
- Figure 105: South America Vascular Closure Devices Industry Revenue Share (%), by Product Type 2024 & 2032
- Figure 106: South America Vascular Closure Devices Industry Volume Share (%), by Product Type 2024 & 2032
- Figure 107: South America Vascular Closure Devices Industry Revenue (Billion), by Mode of Access 2024 & 2032
- Figure 108: South America Vascular Closure Devices Industry Volume (K Units), by Mode of Access 2024 & 2032
- Figure 109: South America Vascular Closure Devices Industry Revenue Share (%), by Mode of Access 2024 & 2032
- Figure 110: South America Vascular Closure Devices Industry Volume Share (%), by Mode of Access 2024 & 2032
- Figure 111: South America Vascular Closure Devices Industry Revenue (Billion), by End User 2024 & 2032
- Figure 112: South America Vascular Closure Devices Industry Volume (K Units), by End User 2024 & 2032
- Figure 113: South America Vascular Closure Devices Industry Revenue Share (%), by End User 2024 & 2032
- Figure 114: South America Vascular Closure Devices Industry Volume Share (%), by End User 2024 & 2032
- Figure 115: South America Vascular Closure Devices Industry Revenue (Billion), by Country 2024 & 2032
- Figure 116: South America Vascular Closure Devices Industry Volume (K Units), by Country 2024 & 2032
- Figure 117: South America Vascular Closure Devices Industry Revenue Share (%), by Country 2024 & 2032
- Figure 118: South America Vascular Closure Devices Industry Volume Share (%), by Country 2024 & 2032
List of Tables
- Table 1: Global Vascular Closure Devices Industry Revenue Billion Forecast, by Region 2019 & 2032
- Table 2: Global Vascular Closure Devices Industry Volume K Units Forecast, by Region 2019 & 2032
- Table 3: Global Vascular Closure Devices Industry Revenue Billion Forecast, by Product Type 2019 & 2032
- Table 4: Global Vascular Closure Devices Industry Volume K Units Forecast, by Product Type 2019 & 2032
- Table 5: Global Vascular Closure Devices Industry Revenue Billion Forecast, by Mode of Access 2019 & 2032
- Table 6: Global Vascular Closure Devices Industry Volume K Units Forecast, by Mode of Access 2019 & 2032
- Table 7: Global Vascular Closure Devices Industry Revenue Billion Forecast, by End User 2019 & 2032
- Table 8: Global Vascular Closure Devices Industry Volume K Units Forecast, by End User 2019 & 2032
- Table 9: Global Vascular Closure Devices Industry Revenue Billion Forecast, by Region 2019 & 2032
- Table 10: Global Vascular Closure Devices Industry Volume K Units Forecast, by Region 2019 & 2032
- Table 11: Global Vascular Closure Devices Industry Revenue Billion Forecast, by Country 2019 & 2032
- Table 12: Global Vascular Closure Devices Industry Volume K Units Forecast, by Country 2019 & 2032
- Table 13: United States Vascular Closure Devices Industry Revenue (Billion) Forecast, by Application 2019 & 2032
- Table 14: United States Vascular Closure Devices Industry Volume (K Units) Forecast, by Application 2019 & 2032
- Table 15: Canada Vascular Closure Devices Industry Revenue (Billion) Forecast, by Application 2019 & 2032
- Table 16: Canada Vascular Closure Devices Industry Volume (K Units) Forecast, by Application 2019 & 2032
- Table 17: Mexico Vascular Closure Devices Industry Revenue (Billion) Forecast, by Application 2019 & 2032
- Table 18: Mexico Vascular Closure Devices Industry Volume (K Units) Forecast, by Application 2019 & 2032
- Table 19: Global Vascular Closure Devices Industry Revenue Billion Forecast, by Country 2019 & 2032
- Table 20: Global Vascular Closure Devices Industry Volume K Units Forecast, by Country 2019 & 2032
- Table 21: Brazil Vascular Closure Devices Industry Revenue (Billion) Forecast, by Application 2019 & 2032
- Table 22: Brazil Vascular Closure Devices Industry Volume (K Units) Forecast, by Application 2019 & 2032
- Table 23: Mexico Vascular Closure Devices Industry Revenue (Billion) Forecast, by Application 2019 & 2032
- Table 24: Mexico Vascular Closure Devices Industry Volume (K Units) Forecast, by Application 2019 & 2032
- Table 25: Rest of South America Vascular Closure Devices Industry Revenue (Billion) Forecast, by Application 2019 & 2032
- Table 26: Rest of South America Vascular Closure Devices Industry Volume (K Units) Forecast, by Application 2019 & 2032
- Table 27: Global Vascular Closure Devices Industry Revenue Billion Forecast, by Country 2019 & 2032
- Table 28: Global Vascular Closure Devices Industry Volume K Units Forecast, by Country 2019 & 2032
- Table 29: Germany Vascular Closure Devices Industry Revenue (Billion) Forecast, by Application 2019 & 2032
- Table 30: Germany Vascular Closure Devices Industry Volume (K Units) Forecast, by Application 2019 & 2032
- Table 31: United Kingdom Vascular Closure Devices Industry Revenue (Billion) Forecast, by Application 2019 & 2032
- Table 32: United Kingdom Vascular Closure Devices Industry Volume (K Units) Forecast, by Application 2019 & 2032
- Table 33: France Vascular Closure Devices Industry Revenue (Billion) Forecast, by Application 2019 & 2032
- Table 34: France Vascular Closure Devices Industry Volume (K Units) Forecast, by Application 2019 & 2032
- Table 35: Italy Vascular Closure Devices Industry Revenue (Billion) Forecast, by Application 2019 & 2032
- Table 36: Italy Vascular Closure Devices Industry Volume (K Units) Forecast, by Application 2019 & 2032
- Table 37: Spain Vascular Closure Devices Industry Revenue (Billion) Forecast, by Application 2019 & 2032
- Table 38: Spain Vascular Closure Devices Industry Volume (K Units) Forecast, by Application 2019 & 2032
- Table 39: Rest of Europe Vascular Closure Devices Industry Revenue (Billion) Forecast, by Application 2019 & 2032
- Table 40: Rest of Europe Vascular Closure Devices Industry Volume (K Units) Forecast, by Application 2019 & 2032
- Table 41: Global Vascular Closure Devices Industry Revenue Billion Forecast, by Country 2019 & 2032
- Table 42: Global Vascular Closure Devices Industry Volume K Units Forecast, by Country 2019 & 2032
- Table 43: China Vascular Closure Devices Industry Revenue (Billion) Forecast, by Application 2019 & 2032
- Table 44: China Vascular Closure Devices Industry Volume (K Units) Forecast, by Application 2019 & 2032
- Table 45: Japan Vascular Closure Devices Industry Revenue (Billion) Forecast, by Application 2019 & 2032
- Table 46: Japan Vascular Closure Devices Industry Volume (K Units) Forecast, by Application 2019 & 2032
- Table 47: India Vascular Closure Devices Industry Revenue (Billion) Forecast, by Application 2019 & 2032
- Table 48: India Vascular Closure Devices Industry Volume (K Units) Forecast, by Application 2019 & 2032
- Table 49: South Korea Vascular Closure Devices Industry Revenue (Billion) Forecast, by Application 2019 & 2032
- Table 50: South Korea Vascular Closure Devices Industry Volume (K Units) Forecast, by Application 2019 & 2032
- Table 51: Taiwan Vascular Closure Devices Industry Revenue (Billion) Forecast, by Application 2019 & 2032
- Table 52: Taiwan Vascular Closure Devices Industry Volume (K Units) Forecast, by Application 2019 & 2032
- Table 53: Australia Vascular Closure Devices Industry Revenue (Billion) Forecast, by Application 2019 & 2032
- Table 54: Australia Vascular Closure Devices Industry Volume (K Units) Forecast, by Application 2019 & 2032
- Table 55: Rest of Asia-Pacific Vascular Closure Devices Industry Revenue (Billion) Forecast, by Application 2019 & 2032
- Table 56: Rest of Asia-Pacific Vascular Closure Devices Industry Volume (K Units) Forecast, by Application 2019 & 2032
- Table 57: Global Vascular Closure Devices Industry Revenue Billion Forecast, by Country 2019 & 2032
- Table 58: Global Vascular Closure Devices Industry Volume K Units Forecast, by Country 2019 & 2032
- Table 59: Middle East Vascular Closure Devices Industry Revenue (Billion) Forecast, by Application 2019 & 2032
- Table 60: Middle East Vascular Closure Devices Industry Volume (K Units) Forecast, by Application 2019 & 2032
- Table 61: Africa Vascular Closure Devices Industry Revenue (Billion) Forecast, by Application 2019 & 2032
- Table 62: Africa Vascular Closure Devices Industry Volume (K Units) Forecast, by Application 2019 & 2032
- Table 63: Global Vascular Closure Devices Industry Revenue Billion Forecast, by Product Type 2019 & 2032
- Table 64: Global Vascular Closure Devices Industry Volume K Units Forecast, by Product Type 2019 & 2032
- Table 65: Global Vascular Closure Devices Industry Revenue Billion Forecast, by Mode of Access 2019 & 2032
- Table 66: Global Vascular Closure Devices Industry Volume K Units Forecast, by Mode of Access 2019 & 2032
- Table 67: Global Vascular Closure Devices Industry Revenue Billion Forecast, by End User 2019 & 2032
- Table 68: Global Vascular Closure Devices Industry Volume K Units Forecast, by End User 2019 & 2032
- Table 69: Global Vascular Closure Devices Industry Revenue Billion Forecast, by Country 2019 & 2032
- Table 70: Global Vascular Closure Devices Industry Volume K Units Forecast, by Country 2019 & 2032
- Table 71: United States Vascular Closure Devices Industry Revenue (Billion) Forecast, by Application 2019 & 2032
- Table 72: United States Vascular Closure Devices Industry Volume (K Units) Forecast, by Application 2019 & 2032
- Table 73: Canada Vascular Closure Devices Industry Revenue (Billion) Forecast, by Application 2019 & 2032
- Table 74: Canada Vascular Closure Devices Industry Volume (K Units) Forecast, by Application 2019 & 2032
- Table 75: Mexico Vascular Closure Devices Industry Revenue (Billion) Forecast, by Application 2019 & 2032
- Table 76: Mexico Vascular Closure Devices Industry Volume (K Units) Forecast, by Application 2019 & 2032
- Table 77: Global Vascular Closure Devices Industry Revenue Billion Forecast, by Product Type 2019 & 2032
- Table 78: Global Vascular Closure Devices Industry Volume K Units Forecast, by Product Type 2019 & 2032
- Table 79: Global Vascular Closure Devices Industry Revenue Billion Forecast, by Mode of Access 2019 & 2032
- Table 80: Global Vascular Closure Devices Industry Volume K Units Forecast, by Mode of Access 2019 & 2032
- Table 81: Global Vascular Closure Devices Industry Revenue Billion Forecast, by End User 2019 & 2032
- Table 82: Global Vascular Closure Devices Industry Volume K Units Forecast, by End User 2019 & 2032
- Table 83: Global Vascular Closure Devices Industry Revenue Billion Forecast, by Country 2019 & 2032
- Table 84: Global Vascular Closure Devices Industry Volume K Units Forecast, by Country 2019 & 2032
- Table 85: Germany Vascular Closure Devices Industry Revenue (Billion) Forecast, by Application 2019 & 2032
- Table 86: Germany Vascular Closure Devices Industry Volume (K Units) Forecast, by Application 2019 & 2032
- Table 87: United Kingdom Vascular Closure Devices Industry Revenue (Billion) Forecast, by Application 2019 & 2032
- Table 88: United Kingdom Vascular Closure Devices Industry Volume (K Units) Forecast, by Application 2019 & 2032
- Table 89: France Vascular Closure Devices Industry Revenue (Billion) Forecast, by Application 2019 & 2032
- Table 90: France Vascular Closure Devices Industry Volume (K Units) Forecast, by Application 2019 & 2032
- Table 91: Italy Vascular Closure Devices Industry Revenue (Billion) Forecast, by Application 2019 & 2032
- Table 92: Italy Vascular Closure Devices Industry Volume (K Units) Forecast, by Application 2019 & 2032
- Table 93: Spain Vascular Closure Devices Industry Revenue (Billion) Forecast, by Application 2019 & 2032
- Table 94: Spain Vascular Closure Devices Industry Volume (K Units) Forecast, by Application 2019 & 2032
- Table 95: Rest of Europe Vascular Closure Devices Industry Revenue (Billion) Forecast, by Application 2019 & 2032
- Table 96: Rest of Europe Vascular Closure Devices Industry Volume (K Units) Forecast, by Application 2019 & 2032
- Table 97: Global Vascular Closure Devices Industry Revenue Billion Forecast, by Product Type 2019 & 2032
- Table 98: Global Vascular Closure Devices Industry Volume K Units Forecast, by Product Type 2019 & 2032
- Table 99: Global Vascular Closure Devices Industry Revenue Billion Forecast, by Mode of Access 2019 & 2032
- Table 100: Global Vascular Closure Devices Industry Volume K Units Forecast, by Mode of Access 2019 & 2032
- Table 101: Global Vascular Closure Devices Industry Revenue Billion Forecast, by End User 2019 & 2032
- Table 102: Global Vascular Closure Devices Industry Volume K Units Forecast, by End User 2019 & 2032
- Table 103: Global Vascular Closure Devices Industry Revenue Billion Forecast, by Country 2019 & 2032
- Table 104: Global Vascular Closure Devices Industry Volume K Units Forecast, by Country 2019 & 2032
- Table 105: China Vascular Closure Devices Industry Revenue (Billion) Forecast, by Application 2019 & 2032
- Table 106: China Vascular Closure Devices Industry Volume (K Units) Forecast, by Application 2019 & 2032
- Table 107: Japan Vascular Closure Devices Industry Revenue (Billion) Forecast, by Application 2019 & 2032
- Table 108: Japan Vascular Closure Devices Industry Volume (K Units) Forecast, by Application 2019 & 2032
- Table 109: India Vascular Closure Devices Industry Revenue (Billion) Forecast, by Application 2019 & 2032
- Table 110: India Vascular Closure Devices Industry Volume (K Units) Forecast, by Application 2019 & 2032
- Table 111: Australia Vascular Closure Devices Industry Revenue (Billion) Forecast, by Application 2019 & 2032
- Table 112: Australia Vascular Closure Devices Industry Volume (K Units) Forecast, by Application 2019 & 2032
- Table 113: South korea Vascular Closure Devices Industry Revenue (Billion) Forecast, by Application 2019 & 2032
- Table 114: South korea Vascular Closure Devices Industry Volume (K Units) Forecast, by Application 2019 & 2032
- Table 115: Rest of Asia Pacific Vascular Closure Devices Industry Revenue (Billion) Forecast, by Application 2019 & 2032
- Table 116: Rest of Asia Pacific Vascular Closure Devices Industry Volume (K Units) Forecast, by Application 2019 & 2032
- Table 117: Global Vascular Closure Devices Industry Revenue Billion Forecast, by Product Type 2019 & 2032
- Table 118: Global Vascular Closure Devices Industry Volume K Units Forecast, by Product Type 2019 & 2032
- Table 119: Global Vascular Closure Devices Industry Revenue Billion Forecast, by Mode of Access 2019 & 2032
- Table 120: Global Vascular Closure Devices Industry Volume K Units Forecast, by Mode of Access 2019 & 2032
- Table 121: Global Vascular Closure Devices Industry Revenue Billion Forecast, by End User 2019 & 2032
- Table 122: Global Vascular Closure Devices Industry Volume K Units Forecast, by End User 2019 & 2032
- Table 123: Global Vascular Closure Devices Industry Revenue Billion Forecast, by Country 2019 & 2032
- Table 124: Global Vascular Closure Devices Industry Volume K Units Forecast, by Country 2019 & 2032
- Table 125: Global Vascular Closure Devices Industry Revenue Billion Forecast, by Product Type 2019 & 2032
- Table 126: Global Vascular Closure Devices Industry Volume K Units Forecast, by Product Type 2019 & 2032
- Table 127: Global Vascular Closure Devices Industry Revenue Billion Forecast, by Mode of Access 2019 & 2032
- Table 128: Global Vascular Closure Devices Industry Volume K Units Forecast, by Mode of Access 2019 & 2032
- Table 129: Global Vascular Closure Devices Industry Revenue Billion Forecast, by End User 2019 & 2032
- Table 130: Global Vascular Closure Devices Industry Volume K Units Forecast, by End User 2019 & 2032
- Table 131: Global Vascular Closure Devices Industry Revenue Billion Forecast, by Country 2019 & 2032
- Table 132: Global Vascular Closure Devices Industry Volume K Units Forecast, by Country 2019 & 2032
- Table 133: South Africa Vascular Closure Devices Industry Revenue (Billion) Forecast, by Application 2019 & 2032
- Table 134: South Africa Vascular Closure Devices Industry Volume (K Units) Forecast, by Application 2019 & 2032
- Table 135: Rest of Middle East Vascular Closure Devices Industry Revenue (Billion) Forecast, by Application 2019 & 2032
- Table 136: Rest of Middle East Vascular Closure Devices Industry Volume (K Units) Forecast, by Application 2019 & 2032
- Table 137: Global Vascular Closure Devices Industry Revenue Billion Forecast, by Product Type 2019 & 2032
- Table 138: Global Vascular Closure Devices Industry Volume K Units Forecast, by Product Type 2019 & 2032
- Table 139: Global Vascular Closure Devices Industry Revenue Billion Forecast, by Mode of Access 2019 & 2032
- Table 140: Global Vascular Closure Devices Industry Volume K Units Forecast, by Mode of Access 2019 & 2032
- Table 141: Global Vascular Closure Devices Industry Revenue Billion Forecast, by End User 2019 & 2032
- Table 142: Global Vascular Closure Devices Industry Volume K Units Forecast, by End User 2019 & 2032
- Table 143: Global Vascular Closure Devices Industry Revenue Billion Forecast, by Country 2019 & 2032
- Table 144: Global Vascular Closure Devices Industry Volume K Units Forecast, by Country 2019 & 2032
- Table 145: Brazil Vascular Closure Devices Industry Revenue (Billion) Forecast, by Application 2019 & 2032
- Table 146: Brazil Vascular Closure Devices Industry Volume (K Units) Forecast, by Application 2019 & 2032
- Table 147: Argentina Vascular Closure Devices Industry Revenue (Billion) Forecast, by Application 2019 & 2032
- Table 148: Argentina Vascular Closure Devices Industry Volume (K Units) Forecast, by Application 2019 & 2032
- Table 149: Rest of South America Vascular Closure Devices Industry Revenue (Billion) Forecast, by Application 2019 & 2032
- Table 150: Rest of South America Vascular Closure Devices Industry Volume (K Units) Forecast, by Application 2019 & 2032
Frequently Asked Questions
1. What is the projected Compound Annual Growth Rate (CAGR) of the Vascular Closure Devices Industry?
The projected CAGR is approximately 6.82%.
2. Which companies are prominent players in the Vascular Closure Devices Industry?
Key companies in the market include Becton Dickinson and Company (C R Bard Inc ), Vivasure Medical Ltd, Terumo Corporation*List Not Exhaustive, Abbott Laboratories, Cardinal Health Inc, Medtronic PLC, Advanced Vascular Dynamics, Cardiva Medical Inc, Biotronik SE & Co KG, B Braun Melsungen AG.
3. What are the main segments of the Vascular Closure Devices Industry?
The market segments include Product Type, Mode of Access, End User.
4. Can you provide details about the market size?
The market size is estimated to be USD XX Billion as of 2022.
5. What are some drivers contributing to market growth?
Increase in Catheterization-related Procedures; Increase in Demand for Minimally Invasive Solutions; Ease of Use of VCDs.
6. What are the notable trends driving market growth?
Femoral Access Segment is Expected to Show Significant Growth Over the Forecast Period.
7. Are there any restraints impacting market growth?
High Cost of Products; Complications Associated with VCDs.
8. Can you provide examples of recent developments in the market?
In July 2021, Vivasure Medical reported that it would start the development program for PerQseal Blue. The PerQseal Blue technology is based on PerQseal. The company's vascular closure device is approved in Europe for use in femoral arteries.
9. What pricing options are available for accessing the report?
Pricing options include single-user, multi-user, and enterprise licenses priced at USD 4750, USD 5250, and USD 8750 respectively.
10. Is the market size provided in terms of value or volume?
The market size is provided in terms of value, measured in Billion and volume, measured in K Units.
11. Are there any specific market keywords associated with the report?
Yes, the market keyword associated with the report is "Vascular Closure Devices Industry," which aids in identifying and referencing the specific market segment covered.
12. How do I determine which pricing option suits my needs best?
The pricing options vary based on user requirements and access needs. Individual users may opt for single-user licenses, while businesses requiring broader access may choose multi-user or enterprise licenses for cost-effective access to the report.
13. Are there any additional resources or data provided in the Vascular Closure Devices Industry report?
While the report offers comprehensive insights, it's advisable to review the specific contents or supplementary materials provided to ascertain if additional resources or data are available.
14. How can I stay updated on further developments or reports in the Vascular Closure Devices Industry?
To stay informed about further developments, trends, and reports in the Vascular Closure Devices Industry, consider subscribing to industry newsletters, following relevant companies and organizations, or regularly checking reputable industry news sources and publications.
Methodology
Step 1 - Identification of Relevant Samples Size from Population Database


Step 2 - Approaches for Defining Global Market Size (Value, Volume* & Price*)

Note*: In applicable scenarios
Step 3 - Data Sources
Primary Research
- Web Analytics
- Survey Reports
- Research Institute
- Latest Research Reports
- Opinion Leaders
Secondary Research
- Annual Reports
- White Paper
- Latest Press Release
- Industry Association
- Paid Database
- Investor Presentations

Step 4 - Data Triangulation
Involves using different sources of information in order to increase the validity of a study
These sources are likely to be stakeholders in a program - participants, other researchers, program staff, other community members, and so on.
Then we put all data in single framework & apply various statistical tools to find out the dynamic on the market.
During the analysis stage, feedback from the stakeholder groups would be compared to determine areas of agreement as well as areas of divergence


