

Key Insights
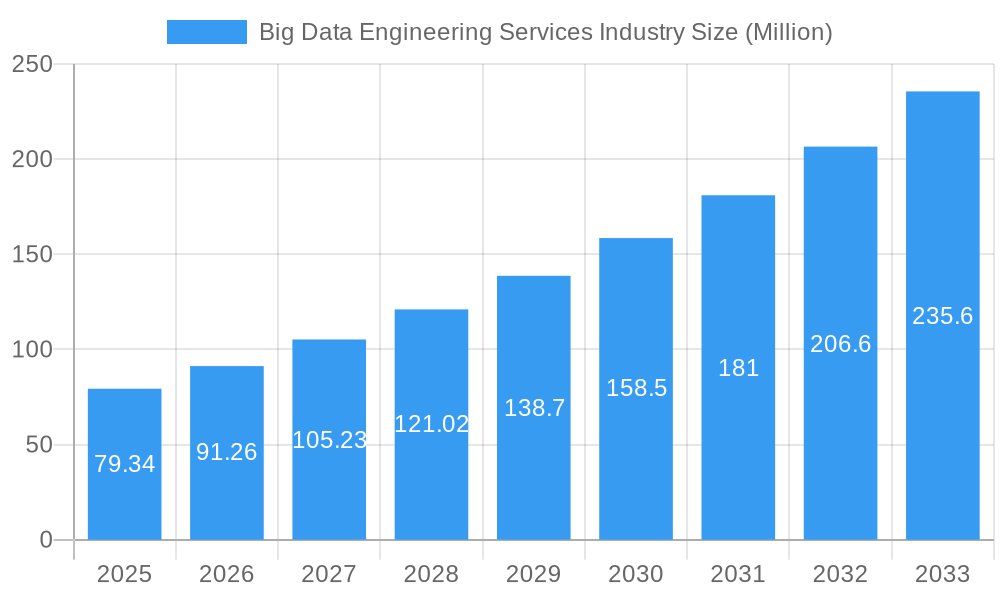
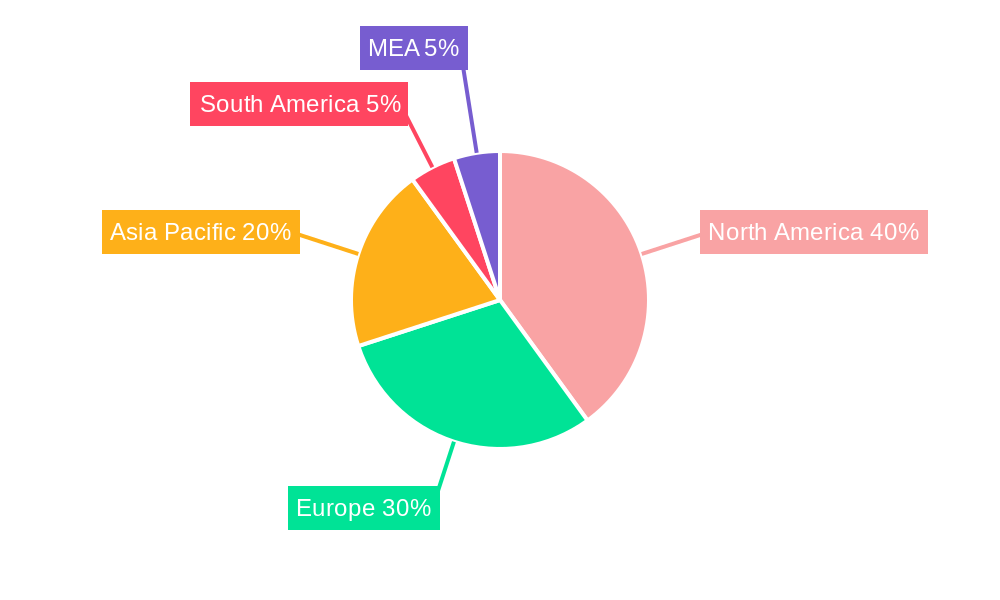
The Big Data Engineering Services market is experiencing robust growth, projected to reach $79.34 million in 2025 and exhibiting a Compound Annual Growth Rate (CAGR) of 15.38% from 2025 to 2033. This expansion is fueled by several key drivers. The increasing volume and complexity of data generated across various industries—BFSI, government, media & telecommunications, retail, manufacturing, and healthcare—necessitates sophisticated data engineering solutions. Businesses are adopting cloud-based deployments to enhance scalability and cost-effectiveness, significantly contributing to market growth. Furthermore, the rising demand for advanced analytics and data-driven decision-making across diverse business functions (marketing & sales, finance, operations, and human resources) is driving investment in robust data engineering infrastructure. The market is segmented by end-user industry, data type (modeling, integration, quality, analytics), business function, organization size (SMEs and large enterprises), and deployment type (cloud and on-premise), reflecting the varied needs and adoption strategies across sectors. Competition is intense, with established players like Genpact, L&T Technology Services, Mphasis, Infosys, Accenture, Capgemini, and NTT Data vying for market share alongside specialized analytics firms like LatentView Analytics. Geographical distribution shows strong performance in North America and Europe, while the Asia-Pacific region is poised for significant future growth due to increasing digitalization and data adoption.
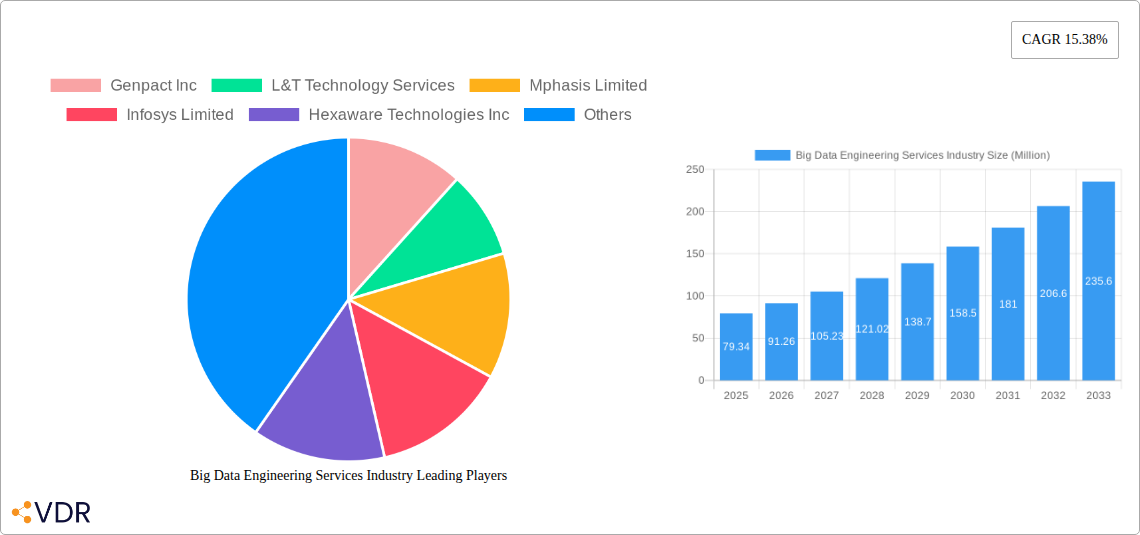
Big Data Engineering Services Industry Market Size (In Million)
The continued growth trajectory is expected to be propelled by several ongoing trends. The increasing adoption of AI and machine learning in data engineering workflows will enhance efficiency and predictive capabilities. The emergence of new data sources, such as IoT devices, will further fuel data volume and complexity, requiring more advanced engineering solutions. Furthermore, the growing focus on data governance and regulatory compliance will drive demand for robust data quality and security measures. However, potential restraints include the scarcity of skilled data engineers, the high initial investment costs associated with implementing big data solutions, and the complexity of integrating diverse data sources and systems. Overcoming these challenges will be crucial for sustaining the market's impressive growth rate in the coming years. The market’s evolution toward more integrated and automated solutions, leveraging advancements in cloud computing and AI, will be a key factor shaping its future landscape.
Big Data Engineering Services Industry Company Market Share
Big Data Engineering Services Market Report: 2019-2033
This comprehensive report provides a detailed analysis of the Big Data Engineering Services market, encompassing market dynamics, growth trends, regional dominance, product landscape, key players, and future outlook. The study period covers 2019-2033, with 2025 as the base and estimated year. The forecast period is 2025-2033, and the historical period is 2019-2024. The market is segmented by end-user industry, type, business function, organization size, and deployment type. The total market size in 2025 is estimated at xx Million.
Big Data Engineering Services Industry Market Dynamics & Structure
The Big Data Engineering Services market is characterized by moderate concentration, with several large players vying for market share. Technological innovation, particularly in areas like AI and machine learning, is a significant driver, while evolving regulatory frameworks (e.g., GDPR) influence data handling practices. Competitive substitutes include cloud-based data warehousing solutions. The end-user demographic spans diverse industries, with a growing demand from BFSI and healthcare. M&A activity is frequent, reflecting the consolidation and expansion strategies of market participants.
- Market Concentration: Moderately concentrated, with top 10 players holding approximately xx% of the market share in 2025.
- Technological Innovation: AI, ML, and edge computing are key innovation drivers, enabling advanced analytics and real-time insights.
- Regulatory Frameworks: GDPR and similar regulations influence data governance practices and compliance requirements.
- Competitive Substitutes: Cloud-based data warehousing and managed services pose competitive pressure.
- End-User Demographics: BFSI, healthcare, and government sectors exhibit the highest growth potential.
- M&A Trends: High volume of M&A activity, particularly among mid-sized players seeking expansion. In 2024, xx M&A deals were recorded, representing a xx% increase from 2023.
Big Data Engineering Services Industry Growth Trends & Insights
The Big Data Engineering Services market is experiencing robust growth, driven by the increasing volume and variety of data generated across industries. Adoption rates are rising rapidly, especially amongst large enterprises. Technological advancements, such as real-time analytics and cloud-based solutions, are disrupting traditional data management practices. Consumer behavior shifts towards data-driven decision-making are further fueling market demand. The market is expected to achieve a CAGR of xx% during the forecast period (2025-2033), reaching xx Million by 2033. Market penetration is currently at xx% and is projected to reach xx% by 2033. The shift towards cloud-based deployment models is a key trend, contributing significantly to the market's expansion. This trend is driven by factors such as scalability, cost-effectiveness, and improved accessibility. The increasing adoption of advanced analytics techniques such as machine learning and AI further contributes to growth.
Dominant Regions, Countries, or Segments in Big Data Engineering Services Industry
North America currently dominates the Big Data Engineering Services market, driven by high technology adoption rates and the presence of major players. However, Asia-Pacific is expected to witness the fastest growth due to rapid digitalization and increasing government investment in infrastructure. Within industry segments, BFSI holds the largest market share, followed by the healthcare and manufacturing sectors. Data integration and analytics are the leading service types. Large enterprises represent the primary user base due to their higher data volumes and more complex needs. Cloud deployment is the favored approach, owing to its flexibility and scalability.
- Leading Region: North America (Market Share: xx% in 2025)
- Fastest-Growing Region: Asia-Pacific (CAGR: xx% during 2025-2033)
- Leading End-user Industry: BFSI (Market Share: xx% in 2025)
- Leading Service Type: Data Integration (Market Share: xx% in 2025)
- Leading Organization Size: Large Enterprises (Market Share: xx% in 2025)
- Leading Deployment Type: Cloud (Market Share: xx% in 2025)
Big Data Engineering Services Industry Product Landscape
The Big Data Engineering Services market offers a range of solutions tailored to specific industry needs. These include data modeling tools, data integration platforms, data quality management solutions, and advanced analytics platforms. Key product innovations revolve around AI-powered automation, real-time analytics capabilities, and enhanced security features. Products are differentiated by their ease of use, scalability, integration capabilities, and the specific analytical capabilities they offer. Many vendors are focused on building pre-built connectors and integrations to popular business applications to improve ease of implementation and reduce the complexity of projects.
Key Drivers, Barriers & Challenges in Big Data Engineering Services Industry
Key Drivers:
- Growing data volumes across industries.
- Increased demand for real-time insights and data-driven decision-making.
- Advancements in AI, ML, and cloud computing technologies.
- Government initiatives promoting digital transformation.
Challenges & Restraints:
- Data security and privacy concerns.
- Lack of skilled professionals.
- High implementation costs for advanced analytics solutions.
- Difficulty in integrating disparate data sources.
- The complex and ever-changing regulatory landscape.
Emerging Opportunities in Big Data Engineering Services Industry
- Expanding into emerging markets with high growth potential.
- Development of specialized solutions for niche industries (e.g., IoT, genomics).
- Leveraging AI and ML for advanced predictive analytics.
- Focus on data governance and compliance solutions.
- Creating hybrid cloud solutions that combine the benefits of cloud and on-premise deployments.
Growth Accelerators in the Big Data Engineering Services Industry
The long-term growth of the Big Data Engineering Services market will be significantly influenced by ongoing technological innovations, strategic partnerships and collaborations between technology vendors, and expansion into new and untapped markets. The increasing adoption of cloud-based solutions and the focus on providing managed services will continue to drive adoption. Furthermore, the ongoing evolution of regulatory landscapes will necessitate the development of advanced data governance and compliance solutions.
Key Players Shaping the Big Data Engineering Services Market
Notable Milestones in Big Data Engineering Services Industry Sector
- August 2023: Five9 acquires Aceyus, expanding its data integration and analytics capabilities.
- April 2023: Siemens and IBM expand their partnership to create an integrated software solution for product lifecycle management.
In-Depth Big Data Engineering Services Industry Market Outlook
The Big Data Engineering Services market is poised for continued robust growth, driven by the factors mentioned previously. Strategic opportunities exist for companies that can offer innovative solutions tailored to specific industry needs, particularly in emerging markets and for niche applications. The focus on data security, governance, and compliance will be crucial for success in this evolving market landscape. The continued development and adoption of AI-powered solutions will offer further expansion opportunities.
Big Data Engineering Services Industry Segmentation
-
1. Type
- 1.1. Data Modelling
- 1.2. Data Integration
- 1.3. Data Quality
- 1.4. Analytics
-
2. Business Function
- 2.1. Marketing and Sales
- 2.2. Finance
- 2.3. Operations
- 2.4. Human Resource
-
3. Organization Size
- 3.1. Small and Medium Enterprizes
- 3.2. Large Enterprises
-
4. Deployement Type
- 4.1. Cloud
- 4.2. On-premise
-
5. End-user Industry
- 5.1. BFSI
- 5.2. Government
- 5.3. Media and Telecommunication
- 5.4. Retail
- 5.5. Manufacturing
- 5.6. Healthcare
- 5.7. Other End-user Verticals
Big Data Engineering Services Industry Segmentation By Geography
- 1. North America
- 2. Europe
- 3. Asia Pacific
- 4. Latin America
- 5. Middle East
Big Data Engineering Services Industry Regional Market Share
Geographic Coverage of Big Data Engineering Services Industry
Big Data Engineering Services Industry REPORT HIGHLIGHTS
| Aspects | Details |
|---|---|
| Study Period | 2020-2034 |
| Base Year | 2025 |
| Estimated Year | 2026 |
| Forecast Period | 2026-2034 |
| Historical Period | 2020-2025 |
| Growth Rate | CAGR of 15.38% from 2020-2034 |
| Segmentation |
|
Table of Contents
- 1. Introduction
- 1.1. Research Scope
- 1.2. Market Segmentation
- 1.3. Research Objective
- 1.4. Definitions and Assumptions
- 2. Executive Summary
- 2.1. Market Snapshot
- 3. Market Dynamics
- 3.1. Market Drivers
- 3.2. Market Restrains
- 3.3. Market Trends
- 3.4. Market Opportunities
- 4. Market Factor Analysis
- 4.1. Porters Five Forces
- 4.1.1. Bargaining Power of Suppliers
- 4.1.2. Bargaining Power of Buyers
- 4.1.3. Threat of New Entrants
- 4.1.4. Threat of Substitutes
- 4.1.5. Competitive Rivalry
- 4.2. PESTEL analysis
- 4.3. BCG Analysis
- 4.3.1. Stars (High Growth, High Market Share)
- 4.3.2. Cash Cows (Low Growth, High Market Share)
- 4.3.3. Question Mark (High Growth, Low Market Share)
- 4.3.4. Dogs (Low Growth, Low Market Share)
- 4.4. Ansoff Matrix Analysis
- 4.5. Supply Chain Analysis
- 4.6. Regulatory Landscape
- 4.7. Current Market Potential and Opportunity Assessment (TAM–SAM–SOM Framework)
- 4.8. VDR Analyst Note
- 4.1. Porters Five Forces
- 5. Market Analysis, Insights and Forecast 2021-2033
- 5.1. Market Analysis, Insights and Forecast - by Type
- 5.1.1. Data Modelling
- 5.1.2. Data Integration
- 5.1.3. Data Quality
- 5.1.4. Analytics
- 5.2. Market Analysis, Insights and Forecast - by Business Function
- 5.2.1. Marketing and Sales
- 5.2.2. Finance
- 5.2.3. Operations
- 5.2.4. Human Resource
- 5.3. Market Analysis, Insights and Forecast - by Organization Size
- 5.3.1. Small and Medium Enterprizes
- 5.3.2. Large Enterprises
- 5.4. Market Analysis, Insights and Forecast - by Deployement Type
- 5.4.1. Cloud
- 5.4.2. On-premise
- 5.5. Market Analysis, Insights and Forecast - by End-user Industry
- 5.5.1. BFSI
- 5.5.2. Government
- 5.5.3. Media and Telecommunication
- 5.5.4. Retail
- 5.5.5. Manufacturing
- 5.5.6. Healthcare
- 5.5.7. Other End-user Verticals
- 5.6. Market Analysis, Insights and Forecast - by Region
- 5.6.1. North America
- 5.6.2. Europe
- 5.6.3. Asia Pacific
- 5.6.4. Latin America
- 5.6.5. Middle East
- 5.1. Market Analysis, Insights and Forecast - by Type
- 6. Global Big Data Engineering Services Industry Analysis, Insights and Forecast, 2021-2033
- 6.1. Market Analysis, Insights and Forecast - by Type
- 6.1.1. Data Modelling
- 6.1.2. Data Integration
- 6.1.3. Data Quality
- 6.1.4. Analytics
- 6.2. Market Analysis, Insights and Forecast - by Business Function
- 6.2.1. Marketing and Sales
- 6.2.2. Finance
- 6.2.3. Operations
- 6.2.4. Human Resource
- 6.3. Market Analysis, Insights and Forecast - by Organization Size
- 6.3.1. Small and Medium Enterprizes
- 6.3.2. Large Enterprises
- 6.4. Market Analysis, Insights and Forecast - by Deployement Type
- 6.4.1. Cloud
- 6.4.2. On-premise
- 6.5. Market Analysis, Insights and Forecast - by End-user Industry
- 6.5.1. BFSI
- 6.5.2. Government
- 6.5.3. Media and Telecommunication
- 6.5.4. Retail
- 6.5.5. Manufacturing
- 6.5.6. Healthcare
- 6.5.7. Other End-user Verticals
- 6.1. Market Analysis, Insights and Forecast - by Type
- 7. North America Big Data Engineering Services Industry Analysis, Insights and Forecast, 2021-2033
- 7.1. Market Analysis, Insights and Forecast - by Type
- 7.1.1. Data Modelling
- 7.1.2. Data Integration
- 7.1.3. Data Quality
- 7.1.4. Analytics
- 7.2. Market Analysis, Insights and Forecast - by Business Function
- 7.2.1. Marketing and Sales
- 7.2.2. Finance
- 7.2.3. Operations
- 7.2.4. Human Resource
- 7.3. Market Analysis, Insights and Forecast - by Organization Size
- 7.3.1. Small and Medium Enterprizes
- 7.3.2. Large Enterprises
- 7.4. Market Analysis, Insights and Forecast - by Deployement Type
- 7.4.1. Cloud
- 7.4.2. On-premise
- 7.5. Market Analysis, Insights and Forecast - by End-user Industry
- 7.5.1. BFSI
- 7.5.2. Government
- 7.5.3. Media and Telecommunication
- 7.5.4. Retail
- 7.5.5. Manufacturing
- 7.5.6. Healthcare
- 7.5.7. Other End-user Verticals
- 7.1. Market Analysis, Insights and Forecast - by Type
- 8. Europe Big Data Engineering Services Industry Analysis, Insights and Forecast, 2021-2033
- 8.1. Market Analysis, Insights and Forecast - by Type
- 8.1.1. Data Modelling
- 8.1.2. Data Integration
- 8.1.3. Data Quality
- 8.1.4. Analytics
- 8.2. Market Analysis, Insights and Forecast - by Business Function
- 8.2.1. Marketing and Sales
- 8.2.2. Finance
- 8.2.3. Operations
- 8.2.4. Human Resource
- 8.3. Market Analysis, Insights and Forecast - by Organization Size
- 8.3.1. Small and Medium Enterprizes
- 8.3.2. Large Enterprises
- 8.4. Market Analysis, Insights and Forecast - by Deployement Type
- 8.4.1. Cloud
- 8.4.2. On-premise
- 8.5. Market Analysis, Insights and Forecast - by End-user Industry
- 8.5.1. BFSI
- 8.5.2. Government
- 8.5.3. Media and Telecommunication
- 8.5.4. Retail
- 8.5.5. Manufacturing
- 8.5.6. Healthcare
- 8.5.7. Other End-user Verticals
- 8.1. Market Analysis, Insights and Forecast - by Type
- 9. Asia Pacific Big Data Engineering Services Industry Analysis, Insights and Forecast, 2021-2033
- 9.1. Market Analysis, Insights and Forecast - by Type
- 9.1.1. Data Modelling
- 9.1.2. Data Integration
- 9.1.3. Data Quality
- 9.1.4. Analytics
- 9.2. Market Analysis, Insights and Forecast - by Business Function
- 9.2.1. Marketing and Sales
- 9.2.2. Finance
- 9.2.3. Operations
- 9.2.4. Human Resource
- 9.3. Market Analysis, Insights and Forecast - by Organization Size
- 9.3.1. Small and Medium Enterprizes
- 9.3.2. Large Enterprises
- 9.4. Market Analysis, Insights and Forecast - by Deployement Type
- 9.4.1. Cloud
- 9.4.2. On-premise
- 9.5. Market Analysis, Insights and Forecast - by End-user Industry
- 9.5.1. BFSI
- 9.5.2. Government
- 9.5.3. Media and Telecommunication
- 9.5.4. Retail
- 9.5.5. Manufacturing
- 9.5.6. Healthcare
- 9.5.7. Other End-user Verticals
- 9.1. Market Analysis, Insights and Forecast - by Type
- 10. Latin America Big Data Engineering Services Industry Analysis, Insights and Forecast, 2021-2033
- 10.1. Market Analysis, Insights and Forecast - by Type
- 10.1.1. Data Modelling
- 10.1.2. Data Integration
- 10.1.3. Data Quality
- 10.1.4. Analytics
- 10.2. Market Analysis, Insights and Forecast - by Business Function
- 10.2.1. Marketing and Sales
- 10.2.2. Finance
- 10.2.3. Operations
- 10.2.4. Human Resource
- 10.3. Market Analysis, Insights and Forecast - by Organization Size
- 10.3.1. Small and Medium Enterprizes
- 10.3.2. Large Enterprises
- 10.4. Market Analysis, Insights and Forecast - by Deployement Type
- 10.4.1. Cloud
- 10.4.2. On-premise
- 10.5. Market Analysis, Insights and Forecast - by End-user Industry
- 10.5.1. BFSI
- 10.5.2. Government
- 10.5.3. Media and Telecommunication
- 10.5.4. Retail
- 10.5.5. Manufacturing
- 10.5.6. Healthcare
- 10.5.7. Other End-user Verticals
- 10.1. Market Analysis, Insights and Forecast - by Type
- 11. Middle East Big Data Engineering Services Industry Analysis, Insights and Forecast, 2021-2033
- 11.1. Market Analysis, Insights and Forecast - by Type
- 11.1.1. Data Modelling
- 11.1.2. Data Integration
- 11.1.3. Data Quality
- 11.1.4. Analytics
- 11.2. Market Analysis, Insights and Forecast - by Business Function
- 11.2.1. Marketing and Sales
- 11.2.2. Finance
- 11.2.3. Operations
- 11.2.4. Human Resource
- 11.3. Market Analysis, Insights and Forecast - by Organization Size
- 11.3.1. Small and Medium Enterprizes
- 11.3.2. Large Enterprises
- 11.4. Market Analysis, Insights and Forecast - by Deployement Type
- 11.4.1. Cloud
- 11.4.2. On-premise
- 11.5. Market Analysis, Insights and Forecast - by End-user Industry
- 11.5.1. BFSI
- 11.5.2. Government
- 11.5.3. Media and Telecommunication
- 11.5.4. Retail
- 11.5.5. Manufacturing
- 11.5.6. Healthcare
- 11.5.7. Other End-user Verticals
- 11.1. Market Analysis, Insights and Forecast - by Type
- 12. Competitive Analysis
- 12.1. Company Profiles
- 12.1.1 Genpact Inc
- 12.1.1.1. Company Overview
- 12.1.1.2. Products
- 12.1.1.3. Company Financials
- 12.1.1.4. SWOT Analysis
- 12.1.2 L&T Technology Services
- 12.1.2.1. Company Overview
- 12.1.2.2. Products
- 12.1.2.3. Company Financials
- 12.1.2.4. SWOT Analysis
- 12.1.3 Mphasis Limited
- 12.1.3.1. Company Overview
- 12.1.3.2. Products
- 12.1.3.3. Company Financials
- 12.1.3.4. SWOT Analysis
- 12.1.4 Infosys Limited
- 12.1.4.1. Company Overview
- 12.1.4.2. Products
- 12.1.4.3. Company Financials
- 12.1.4.4. SWOT Analysis
- 12.1.5 Hexaware Technologies Inc
- 12.1.5.1. Company Overview
- 12.1.5.2. Products
- 12.1.5.3. Company Financials
- 12.1.5.4. SWOT Analysis
- 12.1.6 Accenture PLC
- 12.1.6.1. Company Overview
- 12.1.6.2. Products
- 12.1.6.3. Company Financials
- 12.1.6.4. SWOT Analysis
- 12.1.7 Capgemini SE
- 12.1.7.1. Company Overview
- 12.1.7.2. Products
- 12.1.7.3. Company Financials
- 12.1.7.4. SWOT Analysis
- 12.1.8 NTT Data Inc
- 12.1.8.1. Company Overview
- 12.1.8.2. Products
- 12.1.8.3. Company Financials
- 12.1.8.4. SWOT Analysis
- 12.1.9 Ernst & Young LLP
- 12.1.9.1. Company Overview
- 12.1.9.2. Products
- 12.1.9.3. Company Financials
- 12.1.9.4. SWOT Analysis
- 12.1.10 KPMG LLP
- 12.1.10.1. Company Overview
- 12.1.10.2. Products
- 12.1.10.3. Company Financials
- 12.1.10.4. SWOT Analysis
- 12.1.11 Cognizant Technology Solutions Corporation
- 12.1.11.1. Company Overview
- 12.1.11.2. Products
- 12.1.11.3. Company Financials
- 12.1.11.4. SWOT Analysis
- 12.1.12 Latentview Analytics Corporatio
- 12.1.12.1. Company Overview
- 12.1.12.2. Products
- 12.1.12.3. Company Financials
- 12.1.12.4. SWOT Analysis
- 12.1.1 Genpact Inc
- 12.2. Market Entropy
- 12.2.1 Company's Key Areas Served
- 12.2.2 Recent Developments
- 12.3. Company Market Share Analysis 2025
- 12.3.1 Top 5 Companies Market Share Analysis
- 12.3.2 Top 3 Companies Market Share Analysis
- 12.4. List of Potential Customers
- 13. Research Methodology
List of Figures
- Figure 1: Global Big Data Engineering Services Industry Revenue Breakdown (Million, %) by Region 2025 & 2033
- Figure 2: Global Big Data Engineering Services Industry Volume Breakdown (K Unit, %) by Region 2025 & 2033
- Figure 3: North America Big Data Engineering Services Industry Revenue (Million), by Type 2025 & 2033
- Figure 4: North America Big Data Engineering Services Industry Volume (K Unit), by Type 2025 & 2033
- Figure 5: North America Big Data Engineering Services Industry Revenue Share (%), by Type 2025 & 2033
- Figure 6: North America Big Data Engineering Services Industry Volume Share (%), by Type 2025 & 2033
- Figure 7: North America Big Data Engineering Services Industry Revenue (Million), by Business Function 2025 & 2033
- Figure 8: North America Big Data Engineering Services Industry Volume (K Unit), by Business Function 2025 & 2033
- Figure 9: North America Big Data Engineering Services Industry Revenue Share (%), by Business Function 2025 & 2033
- Figure 10: North America Big Data Engineering Services Industry Volume Share (%), by Business Function 2025 & 2033
- Figure 11: North America Big Data Engineering Services Industry Revenue (Million), by Organization Size 2025 & 2033
- Figure 12: North America Big Data Engineering Services Industry Volume (K Unit), by Organization Size 2025 & 2033
- Figure 13: North America Big Data Engineering Services Industry Revenue Share (%), by Organization Size 2025 & 2033
- Figure 14: North America Big Data Engineering Services Industry Volume Share (%), by Organization Size 2025 & 2033
- Figure 15: North America Big Data Engineering Services Industry Revenue (Million), by Deployement Type 2025 & 2033
- Figure 16: North America Big Data Engineering Services Industry Volume (K Unit), by Deployement Type 2025 & 2033
- Figure 17: North America Big Data Engineering Services Industry Revenue Share (%), by Deployement Type 2025 & 2033
- Figure 18: North America Big Data Engineering Services Industry Volume Share (%), by Deployement Type 2025 & 2033
- Figure 19: North America Big Data Engineering Services Industry Revenue (Million), by End-user Industry 2025 & 2033
- Figure 20: North America Big Data Engineering Services Industry Volume (K Unit), by End-user Industry 2025 & 2033
- Figure 21: North America Big Data Engineering Services Industry Revenue Share (%), by End-user Industry 2025 & 2033
- Figure 22: North America Big Data Engineering Services Industry Volume Share (%), by End-user Industry 2025 & 2033
- Figure 23: North America Big Data Engineering Services Industry Revenue (Million), by Country 2025 & 2033
- Figure 24: North America Big Data Engineering Services Industry Volume (K Unit), by Country 2025 & 2033
- Figure 25: North America Big Data Engineering Services Industry Revenue Share (%), by Country 2025 & 2033
- Figure 26: North America Big Data Engineering Services Industry Volume Share (%), by Country 2025 & 2033
- Figure 27: Europe Big Data Engineering Services Industry Revenue (Million), by Type 2025 & 2033
- Figure 28: Europe Big Data Engineering Services Industry Volume (K Unit), by Type 2025 & 2033
- Figure 29: Europe Big Data Engineering Services Industry Revenue Share (%), by Type 2025 & 2033
- Figure 30: Europe Big Data Engineering Services Industry Volume Share (%), by Type 2025 & 2033
- Figure 31: Europe Big Data Engineering Services Industry Revenue (Million), by Business Function 2025 & 2033
- Figure 32: Europe Big Data Engineering Services Industry Volume (K Unit), by Business Function 2025 & 2033
- Figure 33: Europe Big Data Engineering Services Industry Revenue Share (%), by Business Function 2025 & 2033
- Figure 34: Europe Big Data Engineering Services Industry Volume Share (%), by Business Function 2025 & 2033
- Figure 35: Europe Big Data Engineering Services Industry Revenue (Million), by Organization Size 2025 & 2033
- Figure 36: Europe Big Data Engineering Services Industry Volume (K Unit), by Organization Size 2025 & 2033
- Figure 37: Europe Big Data Engineering Services Industry Revenue Share (%), by Organization Size 2025 & 2033
- Figure 38: Europe Big Data Engineering Services Industry Volume Share (%), by Organization Size 2025 & 2033
- Figure 39: Europe Big Data Engineering Services Industry Revenue (Million), by Deployement Type 2025 & 2033
- Figure 40: Europe Big Data Engineering Services Industry Volume (K Unit), by Deployement Type 2025 & 2033
- Figure 41: Europe Big Data Engineering Services Industry Revenue Share (%), by Deployement Type 2025 & 2033
- Figure 42: Europe Big Data Engineering Services Industry Volume Share (%), by Deployement Type 2025 & 2033
- Figure 43: Europe Big Data Engineering Services Industry Revenue (Million), by End-user Industry 2025 & 2033
- Figure 44: Europe Big Data Engineering Services Industry Volume (K Unit), by End-user Industry 2025 & 2033
- Figure 45: Europe Big Data Engineering Services Industry Revenue Share (%), by End-user Industry 2025 & 2033
- Figure 46: Europe Big Data Engineering Services Industry Volume Share (%), by End-user Industry 2025 & 2033
- Figure 47: Europe Big Data Engineering Services Industry Revenue (Million), by Country 2025 & 2033
- Figure 48: Europe Big Data Engineering Services Industry Volume (K Unit), by Country 2025 & 2033
- Figure 49: Europe Big Data Engineering Services Industry Revenue Share (%), by Country 2025 & 2033
- Figure 50: Europe Big Data Engineering Services Industry Volume Share (%), by Country 2025 & 2033
- Figure 51: Asia Pacific Big Data Engineering Services Industry Revenue (Million), by Type 2025 & 2033
- Figure 52: Asia Pacific Big Data Engineering Services Industry Volume (K Unit), by Type 2025 & 2033
- Figure 53: Asia Pacific Big Data Engineering Services Industry Revenue Share (%), by Type 2025 & 2033
- Figure 54: Asia Pacific Big Data Engineering Services Industry Volume Share (%), by Type 2025 & 2033
- Figure 55: Asia Pacific Big Data Engineering Services Industry Revenue (Million), by Business Function 2025 & 2033
- Figure 56: Asia Pacific Big Data Engineering Services Industry Volume (K Unit), by Business Function 2025 & 2033
- Figure 57: Asia Pacific Big Data Engineering Services Industry Revenue Share (%), by Business Function 2025 & 2033
- Figure 58: Asia Pacific Big Data Engineering Services Industry Volume Share (%), by Business Function 2025 & 2033
- Figure 59: Asia Pacific Big Data Engineering Services Industry Revenue (Million), by Organization Size 2025 & 2033
- Figure 60: Asia Pacific Big Data Engineering Services Industry Volume (K Unit), by Organization Size 2025 & 2033
- Figure 61: Asia Pacific Big Data Engineering Services Industry Revenue Share (%), by Organization Size 2025 & 2033
- Figure 62: Asia Pacific Big Data Engineering Services Industry Volume Share (%), by Organization Size 2025 & 2033
- Figure 63: Asia Pacific Big Data Engineering Services Industry Revenue (Million), by Deployement Type 2025 & 2033
- Figure 64: Asia Pacific Big Data Engineering Services Industry Volume (K Unit), by Deployement Type 2025 & 2033
- Figure 65: Asia Pacific Big Data Engineering Services Industry Revenue Share (%), by Deployement Type 2025 & 2033
- Figure 66: Asia Pacific Big Data Engineering Services Industry Volume Share (%), by Deployement Type 2025 & 2033
- Figure 67: Asia Pacific Big Data Engineering Services Industry Revenue (Million), by End-user Industry 2025 & 2033
- Figure 68: Asia Pacific Big Data Engineering Services Industry Volume (K Unit), by End-user Industry 2025 & 2033
- Figure 69: Asia Pacific Big Data Engineering Services Industry Revenue Share (%), by End-user Industry 2025 & 2033
- Figure 70: Asia Pacific Big Data Engineering Services Industry Volume Share (%), by End-user Industry 2025 & 2033
- Figure 71: Asia Pacific Big Data Engineering Services Industry Revenue (Million), by Country 2025 & 2033
- Figure 72: Asia Pacific Big Data Engineering Services Industry Volume (K Unit), by Country 2025 & 2033
- Figure 73: Asia Pacific Big Data Engineering Services Industry Revenue Share (%), by Country 2025 & 2033
- Figure 74: Asia Pacific Big Data Engineering Services Industry Volume Share (%), by Country 2025 & 2033
- Figure 75: Latin America Big Data Engineering Services Industry Revenue (Million), by Type 2025 & 2033
- Figure 76: Latin America Big Data Engineering Services Industry Volume (K Unit), by Type 2025 & 2033
- Figure 77: Latin America Big Data Engineering Services Industry Revenue Share (%), by Type 2025 & 2033
- Figure 78: Latin America Big Data Engineering Services Industry Volume Share (%), by Type 2025 & 2033
- Figure 79: Latin America Big Data Engineering Services Industry Revenue (Million), by Business Function 2025 & 2033
- Figure 80: Latin America Big Data Engineering Services Industry Volume (K Unit), by Business Function 2025 & 2033
- Figure 81: Latin America Big Data Engineering Services Industry Revenue Share (%), by Business Function 2025 & 2033
- Figure 82: Latin America Big Data Engineering Services Industry Volume Share (%), by Business Function 2025 & 2033
- Figure 83: Latin America Big Data Engineering Services Industry Revenue (Million), by Organization Size 2025 & 2033
- Figure 84: Latin America Big Data Engineering Services Industry Volume (K Unit), by Organization Size 2025 & 2033
- Figure 85: Latin America Big Data Engineering Services Industry Revenue Share (%), by Organization Size 2025 & 2033
- Figure 86: Latin America Big Data Engineering Services Industry Volume Share (%), by Organization Size 2025 & 2033
- Figure 87: Latin America Big Data Engineering Services Industry Revenue (Million), by Deployement Type 2025 & 2033
- Figure 88: Latin America Big Data Engineering Services Industry Volume (K Unit), by Deployement Type 2025 & 2033
- Figure 89: Latin America Big Data Engineering Services Industry Revenue Share (%), by Deployement Type 2025 & 2033
- Figure 90: Latin America Big Data Engineering Services Industry Volume Share (%), by Deployement Type 2025 & 2033
- Figure 91: Latin America Big Data Engineering Services Industry Revenue (Million), by End-user Industry 2025 & 2033
- Figure 92: Latin America Big Data Engineering Services Industry Volume (K Unit), by End-user Industry 2025 & 2033
- Figure 93: Latin America Big Data Engineering Services Industry Revenue Share (%), by End-user Industry 2025 & 2033
- Figure 94: Latin America Big Data Engineering Services Industry Volume Share (%), by End-user Industry 2025 & 2033
- Figure 95: Latin America Big Data Engineering Services Industry Revenue (Million), by Country 2025 & 2033
- Figure 96: Latin America Big Data Engineering Services Industry Volume (K Unit), by Country 2025 & 2033
- Figure 97: Latin America Big Data Engineering Services Industry Revenue Share (%), by Country 2025 & 2033
- Figure 98: Latin America Big Data Engineering Services Industry Volume Share (%), by Country 2025 & 2033
- Figure 99: Middle East Big Data Engineering Services Industry Revenue (Million), by Type 2025 & 2033
- Figure 100: Middle East Big Data Engineering Services Industry Volume (K Unit), by Type 2025 & 2033
- Figure 101: Middle East Big Data Engineering Services Industry Revenue Share (%), by Type 2025 & 2033
- Figure 102: Middle East Big Data Engineering Services Industry Volume Share (%), by Type 2025 & 2033
- Figure 103: Middle East Big Data Engineering Services Industry Revenue (Million), by Business Function 2025 & 2033
- Figure 104: Middle East Big Data Engineering Services Industry Volume (K Unit), by Business Function 2025 & 2033
- Figure 105: Middle East Big Data Engineering Services Industry Revenue Share (%), by Business Function 2025 & 2033
- Figure 106: Middle East Big Data Engineering Services Industry Volume Share (%), by Business Function 2025 & 2033
- Figure 107: Middle East Big Data Engineering Services Industry Revenue (Million), by Organization Size 2025 & 2033
- Figure 108: Middle East Big Data Engineering Services Industry Volume (K Unit), by Organization Size 2025 & 2033
- Figure 109: Middle East Big Data Engineering Services Industry Revenue Share (%), by Organization Size 2025 & 2033
- Figure 110: Middle East Big Data Engineering Services Industry Volume Share (%), by Organization Size 2025 & 2033
- Figure 111: Middle East Big Data Engineering Services Industry Revenue (Million), by Deployement Type 2025 & 2033
- Figure 112: Middle East Big Data Engineering Services Industry Volume (K Unit), by Deployement Type 2025 & 2033
- Figure 113: Middle East Big Data Engineering Services Industry Revenue Share (%), by Deployement Type 2025 & 2033
- Figure 114: Middle East Big Data Engineering Services Industry Volume Share (%), by Deployement Type 2025 & 2033
- Figure 115: Middle East Big Data Engineering Services Industry Revenue (Million), by End-user Industry 2025 & 2033
- Figure 116: Middle East Big Data Engineering Services Industry Volume (K Unit), by End-user Industry 2025 & 2033
- Figure 117: Middle East Big Data Engineering Services Industry Revenue Share (%), by End-user Industry 2025 & 2033
- Figure 118: Middle East Big Data Engineering Services Industry Volume Share (%), by End-user Industry 2025 & 2033
- Figure 119: Middle East Big Data Engineering Services Industry Revenue (Million), by Country 2025 & 2033
- Figure 120: Middle East Big Data Engineering Services Industry Volume (K Unit), by Country 2025 & 2033
- Figure 121: Middle East Big Data Engineering Services Industry Revenue Share (%), by Country 2025 & 2033
- Figure 122: Middle East Big Data Engineering Services Industry Volume Share (%), by Country 2025 & 2033
List of Tables
- Table 1: Global Big Data Engineering Services Industry Revenue Million Forecast, by Type 2020 & 2033
- Table 2: Global Big Data Engineering Services Industry Volume K Unit Forecast, by Type 2020 & 2033
- Table 3: Global Big Data Engineering Services Industry Revenue Million Forecast, by Business Function 2020 & 2033
- Table 4: Global Big Data Engineering Services Industry Volume K Unit Forecast, by Business Function 2020 & 2033
- Table 5: Global Big Data Engineering Services Industry Revenue Million Forecast, by Organization Size 2020 & 2033
- Table 6: Global Big Data Engineering Services Industry Volume K Unit Forecast, by Organization Size 2020 & 2033
- Table 7: Global Big Data Engineering Services Industry Revenue Million Forecast, by Deployement Type 2020 & 2033
- Table 8: Global Big Data Engineering Services Industry Volume K Unit Forecast, by Deployement Type 2020 & 2033
- Table 9: Global Big Data Engineering Services Industry Revenue Million Forecast, by End-user Industry 2020 & 2033
- Table 10: Global Big Data Engineering Services Industry Volume K Unit Forecast, by End-user Industry 2020 & 2033
- Table 11: Global Big Data Engineering Services Industry Revenue Million Forecast, by Region 2020 & 2033
- Table 12: Global Big Data Engineering Services Industry Volume K Unit Forecast, by Region 2020 & 2033
- Table 13: Global Big Data Engineering Services Industry Revenue Million Forecast, by Type 2020 & 2033
- Table 14: Global Big Data Engineering Services Industry Volume K Unit Forecast, by Type 2020 & 2033
- Table 15: Global Big Data Engineering Services Industry Revenue Million Forecast, by Business Function 2020 & 2033
- Table 16: Global Big Data Engineering Services Industry Volume K Unit Forecast, by Business Function 2020 & 2033
- Table 17: Global Big Data Engineering Services Industry Revenue Million Forecast, by Organization Size 2020 & 2033
- Table 18: Global Big Data Engineering Services Industry Volume K Unit Forecast, by Organization Size 2020 & 2033
- Table 19: Global Big Data Engineering Services Industry Revenue Million Forecast, by Deployement Type 2020 & 2033
- Table 20: Global Big Data Engineering Services Industry Volume K Unit Forecast, by Deployement Type 2020 & 2033
- Table 21: Global Big Data Engineering Services Industry Revenue Million Forecast, by End-user Industry 2020 & 2033
- Table 22: Global Big Data Engineering Services Industry Volume K Unit Forecast, by End-user Industry 2020 & 2033
- Table 23: Global Big Data Engineering Services Industry Revenue Million Forecast, by Country 2020 & 2033
- Table 24: Global Big Data Engineering Services Industry Volume K Unit Forecast, by Country 2020 & 2033
- Table 25: Global Big Data Engineering Services Industry Revenue Million Forecast, by Type 2020 & 2033
- Table 26: Global Big Data Engineering Services Industry Volume K Unit Forecast, by Type 2020 & 2033
- Table 27: Global Big Data Engineering Services Industry Revenue Million Forecast, by Business Function 2020 & 2033
- Table 28: Global Big Data Engineering Services Industry Volume K Unit Forecast, by Business Function 2020 & 2033
- Table 29: Global Big Data Engineering Services Industry Revenue Million Forecast, by Organization Size 2020 & 2033
- Table 30: Global Big Data Engineering Services Industry Volume K Unit Forecast, by Organization Size 2020 & 2033
- Table 31: Global Big Data Engineering Services Industry Revenue Million Forecast, by Deployement Type 2020 & 2033
- Table 32: Global Big Data Engineering Services Industry Volume K Unit Forecast, by Deployement Type 2020 & 2033
- Table 33: Global Big Data Engineering Services Industry Revenue Million Forecast, by End-user Industry 2020 & 2033
- Table 34: Global Big Data Engineering Services Industry Volume K Unit Forecast, by End-user Industry 2020 & 2033
- Table 35: Global Big Data Engineering Services Industry Revenue Million Forecast, by Country 2020 & 2033
- Table 36: Global Big Data Engineering Services Industry Volume K Unit Forecast, by Country 2020 & 2033
- Table 37: Global Big Data Engineering Services Industry Revenue Million Forecast, by Type 2020 & 2033
- Table 38: Global Big Data Engineering Services Industry Volume K Unit Forecast, by Type 2020 & 2033
- Table 39: Global Big Data Engineering Services Industry Revenue Million Forecast, by Business Function 2020 & 2033
- Table 40: Global Big Data Engineering Services Industry Volume K Unit Forecast, by Business Function 2020 & 2033
- Table 41: Global Big Data Engineering Services Industry Revenue Million Forecast, by Organization Size 2020 & 2033
- Table 42: Global Big Data Engineering Services Industry Volume K Unit Forecast, by Organization Size 2020 & 2033
- Table 43: Global Big Data Engineering Services Industry Revenue Million Forecast, by Deployement Type 2020 & 2033
- Table 44: Global Big Data Engineering Services Industry Volume K Unit Forecast, by Deployement Type 2020 & 2033
- Table 45: Global Big Data Engineering Services Industry Revenue Million Forecast, by End-user Industry 2020 & 2033
- Table 46: Global Big Data Engineering Services Industry Volume K Unit Forecast, by End-user Industry 2020 & 2033
- Table 47: Global Big Data Engineering Services Industry Revenue Million Forecast, by Country 2020 & 2033
- Table 48: Global Big Data Engineering Services Industry Volume K Unit Forecast, by Country 2020 & 2033
- Table 49: Global Big Data Engineering Services Industry Revenue Million Forecast, by Type 2020 & 2033
- Table 50: Global Big Data Engineering Services Industry Volume K Unit Forecast, by Type 2020 & 2033
- Table 51: Global Big Data Engineering Services Industry Revenue Million Forecast, by Business Function 2020 & 2033
- Table 52: Global Big Data Engineering Services Industry Volume K Unit Forecast, by Business Function 2020 & 2033
- Table 53: Global Big Data Engineering Services Industry Revenue Million Forecast, by Organization Size 2020 & 2033
- Table 54: Global Big Data Engineering Services Industry Volume K Unit Forecast, by Organization Size 2020 & 2033
- Table 55: Global Big Data Engineering Services Industry Revenue Million Forecast, by Deployement Type 2020 & 2033
- Table 56: Global Big Data Engineering Services Industry Volume K Unit Forecast, by Deployement Type 2020 & 2033
- Table 57: Global Big Data Engineering Services Industry Revenue Million Forecast, by End-user Industry 2020 & 2033
- Table 58: Global Big Data Engineering Services Industry Volume K Unit Forecast, by End-user Industry 2020 & 2033
- Table 59: Global Big Data Engineering Services Industry Revenue Million Forecast, by Country 2020 & 2033
- Table 60: Global Big Data Engineering Services Industry Volume K Unit Forecast, by Country 2020 & 2033
- Table 61: Global Big Data Engineering Services Industry Revenue Million Forecast, by Type 2020 & 2033
- Table 62: Global Big Data Engineering Services Industry Volume K Unit Forecast, by Type 2020 & 2033
- Table 63: Global Big Data Engineering Services Industry Revenue Million Forecast, by Business Function 2020 & 2033
- Table 64: Global Big Data Engineering Services Industry Volume K Unit Forecast, by Business Function 2020 & 2033
- Table 65: Global Big Data Engineering Services Industry Revenue Million Forecast, by Organization Size 2020 & 2033
- Table 66: Global Big Data Engineering Services Industry Volume K Unit Forecast, by Organization Size 2020 & 2033
- Table 67: Global Big Data Engineering Services Industry Revenue Million Forecast, by Deployement Type 2020 & 2033
- Table 68: Global Big Data Engineering Services Industry Volume K Unit Forecast, by Deployement Type 2020 & 2033
- Table 69: Global Big Data Engineering Services Industry Revenue Million Forecast, by End-user Industry 2020 & 2033
- Table 70: Global Big Data Engineering Services Industry Volume K Unit Forecast, by End-user Industry 2020 & 2033
- Table 71: Global Big Data Engineering Services Industry Revenue Million Forecast, by Country 2020 & 2033
- Table 72: Global Big Data Engineering Services Industry Volume K Unit Forecast, by Country 2020 & 2033
Frequently Asked Questions
1. What is the projected Compound Annual Growth Rate (CAGR) of the Big Data Engineering Services Industry?
The projected CAGR is approximately 15.38%.
2. Which companies are prominent players in the Big Data Engineering Services Industry?
Key companies in the market include Genpact Inc, L&T Technology Services, Mphasis Limited, Infosys Limited, Hexaware Technologies Inc, Accenture PLC, Capgemini SE, NTT Data Inc, Ernst & Young LLP, KPMG LLP, Cognizant Technology Solutions Corporation, Latentview Analytics Corporatio.
3. What are the main segments of the Big Data Engineering Services Industry?
The market segments include Type, Business Function, Organization Size, Deployement Type, End-user Industry.
4. Can you provide details about the market size?
The market size is estimated to be USD 79.34 Million as of 2022.
5. What are some drivers contributing to market growth?
Increasing Volume of Unstructured Data due to the Phenomenal Growth of Interconnected Devices and Social Media; Cost-effective Services and Cutting-edge Expertise Rendered by Data Servicing Companies.
6. What are the notable trends driving market growth?
Big Data Analytics in Banking is Expected to Grow Significantly.
7. Are there any restraints impacting market growth?
Inability of Service Providers to Provide Real-time Insights.
8. Can you provide examples of recent developments in the market?
August 2023: Five9, a CX Platform provider, finalized an agreement to acquire Aceyus, a key player in advanced data integration and analytics. Aceyus specializes in ingesting data from various sources, including CRM, WEM systems, ACDs, communication platforms, and digital channels. Their robust catalog of pre-built integrations enables seamless data migration from legacy systems to the Five9 platform. By maintaining consistent reports, data visualization, and dashboards, Aceyus ensures a smooth transition for businesses during migration and beyond. This strategic move enhances Five9’s ability to deliver personalized customer experiences by leveraging contextual data from disparate sources.
9. What pricing options are available for accessing the report?
Pricing options include single-user, multi-user, and enterprise licenses priced at USD 4750, USD 5250, and USD 8750 respectively.
10. Is the market size provided in terms of value or volume?
The market size is provided in terms of value, measured in Million and volume, measured in K Unit.
11. Are there any specific market keywords associated with the report?
Yes, the market keyword associated with the report is "Big Data Engineering Services Industry," which aids in identifying and referencing the specific market segment covered.
12. How do I determine which pricing option suits my needs best?
The pricing options vary based on user requirements and access needs. Individual users may opt for single-user licenses, while businesses requiring broader access may choose multi-user or enterprise licenses for cost-effective access to the report.
13. Are there any additional resources or data provided in the Big Data Engineering Services Industry report?
While the report offers comprehensive insights, it's advisable to review the specific contents or supplementary materials provided to ascertain if additional resources or data are available.
14. How can I stay updated on further developments or reports in the Big Data Engineering Services Industry?
To stay informed about further developments, trends, and reports in the Big Data Engineering Services Industry, consider subscribing to industry newsletters, following relevant companies and organizations, or regularly checking reputable industry news sources and publications.
Methodology
Step 1 - Identification of Relevant Samples Size from Population Database


Step 2 - Approaches for Defining Global Market Size (Value, Volume* & Price*)

Note*: In applicable scenarios
Step 3 - Data Sources
Primary Research
- Web Analytics
- Survey Reports
- Research Institute
- Latest Research Reports
- Opinion Leaders
Secondary Research
- Annual Reports
- White Paper
- Latest Press Release
- Industry Association
- Paid Database
- Investor Presentations

Step 4 - Data Triangulation
Involves using different sources of information in order to increase the validity of a study
These sources are likely to be stakeholders in a program - participants, other researchers, program staff, other community members, and so on.
Then we put all data in single framework & apply various statistical tools to find out the dynamic on the market.
During the analysis stage, feedback from the stakeholder groups would be compared to determine areas of agreement as well as areas of divergence