
Key Insights
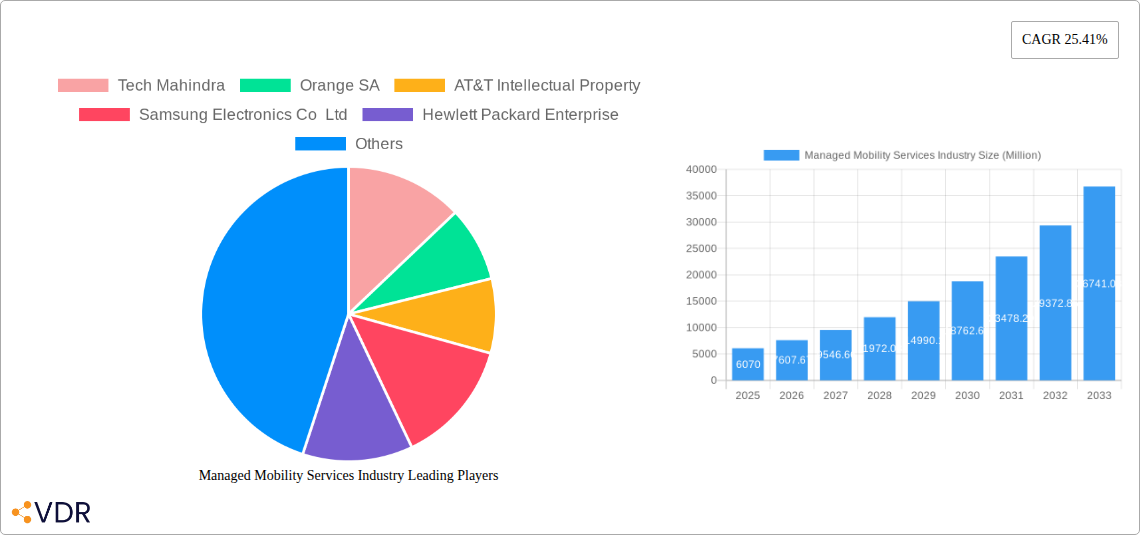
The Managed Mobility Services (MMS) market is experiencing robust growth, projected to reach $6.07 billion in 2025 and maintain a Compound Annual Growth Rate (CAGR) of 25.41% from 2025 to 2033. This expansion is driven by several key factors. The increasing adoption of mobile devices in various sectors, including IT and Telecom, BFSI (Banking, Financial Services, and Insurance), Healthcare, Manufacturing, and Retail, fuels the demand for secure and efficient mobile device management. Businesses are increasingly relying on mobile applications for operations and customer engagement, creating a strong need for robust Mobile Application Management (MAM) solutions. Furthermore, growing concerns about mobile security threats, including data breaches and malware, are pushing organizations to invest heavily in Mobile Security solutions, a significant segment within the MMS market. The shift towards cloud-based deployment models also contributes to market growth, offering scalability and cost-effectiveness compared to on-premise solutions. Competition among major players like Tech Mahindra, Orange SA, AT&T Intellectual Property, and Microsoft Corporation further accelerates innovation and market penetration.
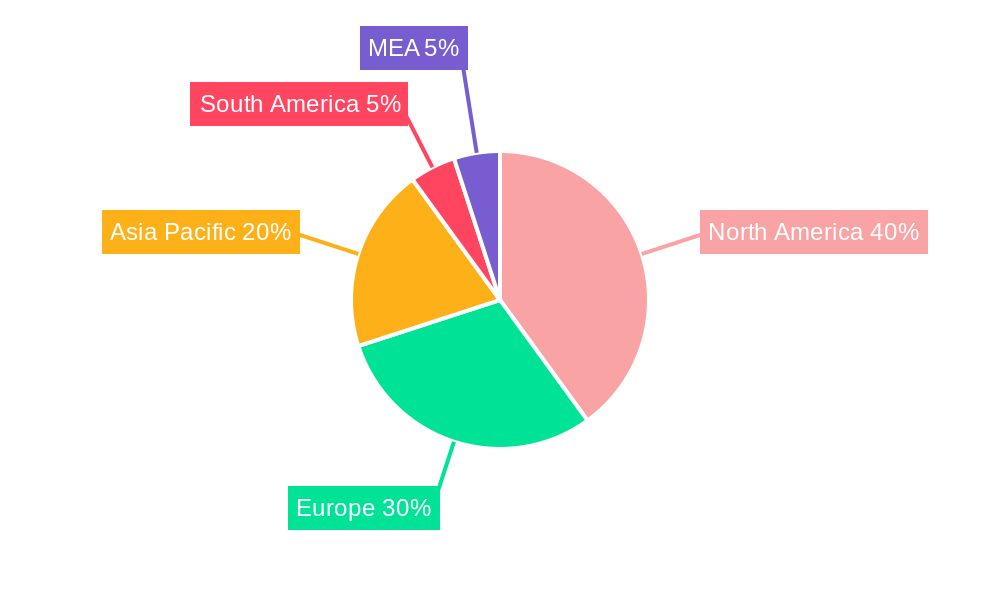
Geographical expansion is another key driver. North America currently holds a substantial market share due to early adoption and high technological advancements, but the Asia-Pacific region is projected to witness significant growth driven by increasing smartphone penetration and digital transformation initiatives in emerging economies like India and China. While the market faces potential restraints such as high initial investment costs and the complexity of integrating MMS solutions into existing IT infrastructure, the overall growth trajectory remains positive, fueled by the sustained demand for improved mobile device security, efficiency, and productivity across industries. The diverse range of services offered, encompassing Mobile Device Management (MDM), MAM, and Mobile Security, ensures the market's resilience and long-term potential. The continuous evolution of mobile technologies and the increasing reliance on mobile workforce necessitates ongoing investment in advanced MMS solutions.
Managed Mobility Services (MMS) Market Report: 2019-2033
This comprehensive report provides a detailed analysis of the Managed Mobility Services (MMS) industry, offering invaluable insights for businesses and investors seeking to navigate this rapidly evolving market. The report covers the period from 2019 to 2033, with a focus on the estimated year 2025. We analyze key market segments including end-user industries (IT & Telecom, BFSI, Healthcare, Manufacturing, Retail, Education, Others), functions (Mobile Device Management, Mobile Application Management, Mobile Security, Others), and deployment models (Cloud, On-premise). The report also profiles leading players like Tech Mahindra, Orange SA, AT&T Intellectual Property, Samsung Electronics Co Ltd, Hewlett Packard Enterprise, Microsoft Corporation, Kyndryl Inc, Wipro, Telefónica SA, Fujitsu, and Vodafone Group PLC, providing a 360-degree view of this dynamic sector. The market size is projected to reach xx Million units by 2033.
Managed Mobility Services Industry Market Dynamics & Structure
The Managed Mobility Services (MMS) market is characterized by moderate concentration, with several large players competing alongside numerous smaller specialized providers. Technological innovation, particularly in areas like 5G, AI, and IoT, is a major driver, while regulatory frameworks around data privacy and security significantly influence market dynamics. Competitive substitutes include in-house IT management, but the increasing complexity of mobile environments favors outsourced MMS solutions. The end-user demographic is diverse, spanning across various industries with varying levels of technological maturity and adoption rates. M&A activity has been steady, with larger players seeking to expand their service portfolios and geographical reach.
- Market Concentration: Moderately concentrated, with a top 5 market share of approximately xx%.
- Technological Innovation: Significant impact from 5G, AI-driven automation, and IoT integration.
- Regulatory Landscape: Stringent data privacy regulations (e.g., GDPR, CCPA) pose both challenges and opportunities.
- Competitive Substitutes: In-house IT management, but less cost-effective for complex environments.
- End-User Demographics: Significant presence across all major industries, with varying adoption rates.
- M&A Trends: Steady consolidation, with larger players acquiring smaller firms to broaden offerings.
Managed Mobility Services Industry Growth Trends & Insights
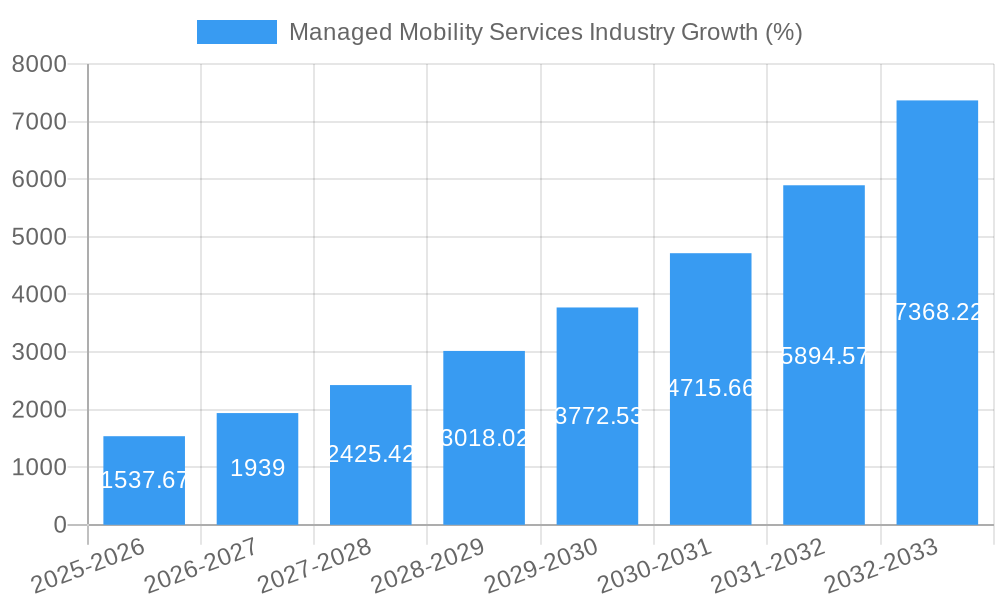
The Managed Mobility Services market has witnessed substantial growth over the historical period (2019-2024), driven by increasing mobile device adoption, the rise of remote work, and the need for robust security solutions. The market is expected to maintain a robust Compound Annual Growth Rate (CAGR) of xx% during the forecast period (2025-2033), reaching a market size of xx Million units by 2033. This growth reflects the increasing reliance on mobile devices for business operations and the associated demand for efficient and secure management solutions. Technological advancements such as 5G, AI, and improved security protocols further fuel this expansion. Shifting consumer behaviors towards cloud-based solutions and increased awareness of cybersecurity threats are also key factors driving market adoption. Market penetration is projected to reach xx% by 2033.
Dominant Regions, Countries, or Segments in Managed Mobility Services Industry
North America currently holds the largest market share in the MMS industry, driven by high mobile device penetration, robust IT infrastructure, and early adoption of advanced technologies. However, the Asia-Pacific region is poised for significant growth owing to increasing smartphone usage, expanding digital infrastructure, and government initiatives promoting digital transformation.
By End-user Industry: The IT and Telecom sector currently dominates, followed by BFSI, with Healthcare and Manufacturing showing strong growth potential.
- IT & Telecom: Highest adoption due to internal needs and expertise in managing complex systems.
- BFSI: Strong growth due to stringent security requirements and regulatory compliance.
- Healthcare: Rising adoption driven by telehealth initiatives and patient data management needs.
- Manufacturing: Growing demand for connected devices and industrial IoT solutions.
- Retail: Increasing focus on mobile commerce and customer experience management.
By Function: Mobile Device Management (MDM) holds the largest market share, followed by Mobile Application Management (MAM). Mobile Security is experiencing rapid growth driven by increasing cyber threats.
- Mobile Device Management (MDM): Core function with high adoption across all sectors.
- Mobile Application Management (MAM): Growing importance with increasing enterprise app usage.
- Mobile Security: Rapid growth due to rising cyber threats and data breaches.
By Deployment: Cloud deployment is gaining traction, surpassing on-premise due to its scalability, cost-effectiveness, and accessibility.
Managed Mobility Services Industry Product Landscape
The MMS product landscape is characterized by a diverse range of solutions, from basic MDM to comprehensive Enterprise Mobility Management (EMM) suites. These solutions incorporate advanced features such as AI-powered automation, robust security protocols, and seamless integration with various enterprise systems. Key innovations include improved analytics dashboards for real-time device monitoring, predictive maintenance capabilities, and enhanced security features to combat evolving cyber threats. Unique selling propositions often revolve around ease of use, robust security, and seamless integration with existing IT infrastructure.
Key Drivers, Barriers & Challenges in Managed Mobility Services Industry
Key Drivers:
- Increasing adoption of mobile devices and BYOD policies.
- Growing need for secure and efficient mobile workforce management.
- The rise of cloud computing and its integration with MMS solutions.
- Enhanced security protocols due to escalating cybersecurity threats.
- Stringent data privacy regulations driving demand for compliant solutions.
Key Barriers and Challenges:
- High initial investment costs for implementing MMS solutions.
- Complexity in integrating MMS with existing IT infrastructure.
- Lack of skilled professionals experienced in managing and securing mobile environments.
- Maintaining security and compliance with evolving regulatory landscapes. This adds an estimated xx Million units cost annually.
- Intense competition among providers, leading to price pressures.
Emerging Opportunities in Managed Mobility Services Industry
- Expanding into untapped markets, particularly in developing economies with rising mobile penetration.
- Leveraging AI and machine learning for improved device management and predictive maintenance.
- Developing solutions specifically catering to the unique needs of vertical industries like healthcare and manufacturing.
- Exploring new business models, such as subscription-based services and managed services offerings.
Growth Accelerators in the Managed Mobility Services Industry
Technological advancements, strategic partnerships, and expansion into emerging markets are key catalysts for long-term growth in the MMS industry. The development of innovative solutions addressing industry-specific needs and improving user experience will further drive market expansion. Strategic alliances between MMS providers and cloud platforms or other technology vendors will enable broader market reach and create new revenue opportunities.
Key Players Shaping the Managed Mobility Services Industry Market
- Tech Mahindra
- Orange SA
- AT&T Intellectual Property
- Samsung Electronics Co Ltd
- Hewlett Packard Enterprise
- Microsoft Corporation
- Kyndryl Inc
- Wipro
- Telefónica SA
- Fujitsu
- Vodafone Group PLC
Notable Milestones in Managed Mobility Services Industry Sector
- February 2023: Kyndryl and Microsoft established their first Latin American Center of Excellence, boosting cloud adoption and digital transformation in the region.
- February 2023: Telefónica SA partnered with SkydwellerAero Inc. to explore connectivity solutions for underserved areas, expanding broadband access.
In-Depth Managed Mobility Services Industry Market Outlook
The future of the MMS industry is bright, driven by continued technological advancements, increasing mobile device adoption, and the growing demand for secure and efficient mobile workforce management solutions. Strategic partnerships and expansion into emerging markets will further fuel growth. The market will witness increased adoption of cloud-based solutions and AI-driven automation, further improving efficiency and reducing costs. The focus will shift towards providing customized solutions tailored to the specific requirements of various industries, unlocking significant growth potential.
Managed Mobility Services Industry Segmentation
-
1. Function
- 1.1. Mobile Device Management
- 1.2. Mobile Application Management
- 1.3. Mobile Security
- 1.4. Other Functions
-
2. Deployment
- 2.1. Cloud
- 2.2. On-premise
-
3. End-user Industry
- 3.1. IT and Telecom
- 3.2. BFSI
- 3.3. Healthcare
- 3.4. Manufacturing
- 3.5. Retail
- 3.6. Education
- 3.7. Other End-user Industries
Managed Mobility Services Industry Segmentation By Geography
-
1. North America
- 1.1. United States
- 1.2. Canada
-
2. Europe
- 2.1. United Kingdom
- 2.2. Germany
- 2.3. France
- 2.4. Rest of Europe
-
3. Asia Pacific
- 3.1. China
- 3.2. India
- 3.3. Japan
- 3.4. Rest of Asia Pacific
-
4. Latin America
- 4.1. Brazil
- 4.2. Argentina
- 4.3. Mexico
- 4.4. Rest of Latin America
-
5. Middle East and Africa
- 5.1. United Arab Emirates
- 5.2. Saudi Arabia
- 5.3. South Africa
- 5.4. Rest of Middle East and Africa
Managed Mobility Services Industry REPORT HIGHLIGHTS
| Aspects | Details |
|---|---|
| Study Period | 2019-2033 |
| Base Year | 2024 |
| Estimated Year | 2025 |
| Forecast Period | 2025-2033 |
| Historical Period | 2019-2024 |
| Growth Rate | CAGR of 25.41% from 2019-2033 |
| Segmentation |
|
Table of Contents
- 1. Introduction
- 1.1. Research Scope
- 1.2. Market Segmentation
- 1.3. Research Methodology
- 1.4. Definitions and Assumptions
- 2. Executive Summary
- 2.1. Introduction
- 3. Market Dynamics
- 3.1. Introduction
- 3.2. Market Drivers
- 3.2.1. Increasing Adoption of BYOD in Multiple Industries; Companies Outsourcing IT Activities
- 3.3. Market Restrains
- 3.3.1. Lack of Control over Operations and Cost Visibility
- 3.4. Market Trends
- 3.4.1. IT and Telecom End-user Industry Segment Holds Significant Market Share
- 4. Market Factor Analysis
- 4.1. Porters Five Forces
- 4.2. Supply/Value Chain
- 4.3. PESTEL analysis
- 4.4. Market Entropy
- 4.5. Patent/Trademark Analysis
- 5. Global Managed Mobility Services Industry Analysis, Insights and Forecast, 2019-2031
- 5.1. Market Analysis, Insights and Forecast - by Function
- 5.1.1. Mobile Device Management
- 5.1.2. Mobile Application Management
- 5.1.3. Mobile Security
- 5.1.4. Other Functions
- 5.2. Market Analysis, Insights and Forecast - by Deployment
- 5.2.1. Cloud
- 5.2.2. On-premise
- 5.3. Market Analysis, Insights and Forecast - by End-user Industry
- 5.3.1. IT and Telecom
- 5.3.2. BFSI
- 5.3.3. Healthcare
- 5.3.4. Manufacturing
- 5.3.5. Retail
- 5.3.6. Education
- 5.3.7. Other End-user Industries
- 5.4. Market Analysis, Insights and Forecast - by Region
- 5.4.1. North America
- 5.4.2. Europe
- 5.4.3. Asia Pacific
- 5.4.4. Latin America
- 5.4.5. Middle East and Africa
- 5.1. Market Analysis, Insights and Forecast - by Function
- 6. North America Managed Mobility Services Industry Analysis, Insights and Forecast, 2019-2031
- 6.1. Market Analysis, Insights and Forecast - by Function
- 6.1.1. Mobile Device Management
- 6.1.2. Mobile Application Management
- 6.1.3. Mobile Security
- 6.1.4. Other Functions
- 6.2. Market Analysis, Insights and Forecast - by Deployment
- 6.2.1. Cloud
- 6.2.2. On-premise
- 6.3. Market Analysis, Insights and Forecast - by End-user Industry
- 6.3.1. IT and Telecom
- 6.3.2. BFSI
- 6.3.3. Healthcare
- 6.3.4. Manufacturing
- 6.3.5. Retail
- 6.3.6. Education
- 6.3.7. Other End-user Industries
- 6.1. Market Analysis, Insights and Forecast - by Function
- 7. Europe Managed Mobility Services Industry Analysis, Insights and Forecast, 2019-2031
- 7.1. Market Analysis, Insights and Forecast - by Function
- 7.1.1. Mobile Device Management
- 7.1.2. Mobile Application Management
- 7.1.3. Mobile Security
- 7.1.4. Other Functions
- 7.2. Market Analysis, Insights and Forecast - by Deployment
- 7.2.1. Cloud
- 7.2.2. On-premise
- 7.3. Market Analysis, Insights and Forecast - by End-user Industry
- 7.3.1. IT and Telecom
- 7.3.2. BFSI
- 7.3.3. Healthcare
- 7.3.4. Manufacturing
- 7.3.5. Retail
- 7.3.6. Education
- 7.3.7. Other End-user Industries
- 7.1. Market Analysis, Insights and Forecast - by Function
- 8. Asia Pacific Managed Mobility Services Industry Analysis, Insights and Forecast, 2019-2031
- 8.1. Market Analysis, Insights and Forecast - by Function
- 8.1.1. Mobile Device Management
- 8.1.2. Mobile Application Management
- 8.1.3. Mobile Security
- 8.1.4. Other Functions
- 8.2. Market Analysis, Insights and Forecast - by Deployment
- 8.2.1. Cloud
- 8.2.2. On-premise
- 8.3. Market Analysis, Insights and Forecast - by End-user Industry
- 8.3.1. IT and Telecom
- 8.3.2. BFSI
- 8.3.3. Healthcare
- 8.3.4. Manufacturing
- 8.3.5. Retail
- 8.3.6. Education
- 8.3.7. Other End-user Industries
- 8.1. Market Analysis, Insights and Forecast - by Function
- 9. Latin America Managed Mobility Services Industry Analysis, Insights and Forecast, 2019-2031
- 9.1. Market Analysis, Insights and Forecast - by Function
- 9.1.1. Mobile Device Management
- 9.1.2. Mobile Application Management
- 9.1.3. Mobile Security
- 9.1.4. Other Functions
- 9.2. Market Analysis, Insights and Forecast - by Deployment
- 9.2.1. Cloud
- 9.2.2. On-premise
- 9.3. Market Analysis, Insights and Forecast - by End-user Industry
- 9.3.1. IT and Telecom
- 9.3.2. BFSI
- 9.3.3. Healthcare
- 9.3.4. Manufacturing
- 9.3.5. Retail
- 9.3.6. Education
- 9.3.7. Other End-user Industries
- 9.1. Market Analysis, Insights and Forecast - by Function
- 10. Middle East and Africa Managed Mobility Services Industry Analysis, Insights and Forecast, 2019-2031
- 10.1. Market Analysis, Insights and Forecast - by Function
- 10.1.1. Mobile Device Management
- 10.1.2. Mobile Application Management
- 10.1.3. Mobile Security
- 10.1.4. Other Functions
- 10.2. Market Analysis, Insights and Forecast - by Deployment
- 10.2.1. Cloud
- 10.2.2. On-premise
- 10.3. Market Analysis, Insights and Forecast - by End-user Industry
- 10.3.1. IT and Telecom
- 10.3.2. BFSI
- 10.3.3. Healthcare
- 10.3.4. Manufacturing
- 10.3.5. Retail
- 10.3.6. Education
- 10.3.7. Other End-user Industries
- 10.1. Market Analysis, Insights and Forecast - by Function
- 11. North America Managed Mobility Services Industry Analysis, Insights and Forecast, 2019-2031
- 11.1. Market Analysis, Insights and Forecast - By Country/Sub-region
- 11.1.1 United States
- 11.1.2 Canada
- 11.1.3 Mexico
- 12. Europe Managed Mobility Services Industry Analysis, Insights and Forecast, 2019-2031
- 12.1. Market Analysis, Insights and Forecast - By Country/Sub-region
- 12.1.1 Germany
- 12.1.2 United Kingdom
- 12.1.3 France
- 12.1.4 Spain
- 12.1.5 Italy
- 12.1.6 Spain
- 12.1.7 Belgium
- 12.1.8 Netherland
- 12.1.9 Nordics
- 12.1.10 Rest of Europe
- 13. Asia Pacific Managed Mobility Services Industry Analysis, Insights and Forecast, 2019-2031
- 13.1. Market Analysis, Insights and Forecast - By Country/Sub-region
- 13.1.1 China
- 13.1.2 Japan
- 13.1.3 India
- 13.1.4 South Korea
- 13.1.5 Southeast Asia
- 13.1.6 Australia
- 13.1.7 Indonesia
- 13.1.8 Phillipes
- 13.1.9 Singapore
- 13.1.10 Thailandc
- 13.1.11 Rest of Asia Pacific
- 14. South America Managed Mobility Services Industry Analysis, Insights and Forecast, 2019-2031
- 14.1. Market Analysis, Insights and Forecast - By Country/Sub-region
- 14.1.1 Brazil
- 14.1.2 Argentina
- 14.1.3 Peru
- 14.1.4 Chile
- 14.1.5 Colombia
- 14.1.6 Ecuador
- 14.1.7 Venezuela
- 14.1.8 Rest of South America
- 15. North America Managed Mobility Services Industry Analysis, Insights and Forecast, 2019-2031
- 15.1. Market Analysis, Insights and Forecast - By Country/Sub-region
- 15.1.1 United States
- 15.1.2 Canada
- 15.1.3 Mexico
- 16. MEA Managed Mobility Services Industry Analysis, Insights and Forecast, 2019-2031
- 16.1. Market Analysis, Insights and Forecast - By Country/Sub-region
- 16.1.1 United Arab Emirates
- 16.1.2 Saudi Arabia
- 16.1.3 South Africa
- 16.1.4 Rest of Middle East and Africa
- 17. Competitive Analysis
- 17.1. Global Market Share Analysis 2024
- 17.2. Company Profiles
- 17.2.1 Tech Mahindra
- 17.2.1.1. Overview
- 17.2.1.2. Products
- 17.2.1.3. SWOT Analysis
- 17.2.1.4. Recent Developments
- 17.2.1.5. Financials (Based on Availability)
- 17.2.2 Orange SA
- 17.2.2.1. Overview
- 17.2.2.2. Products
- 17.2.2.3. SWOT Analysis
- 17.2.2.4. Recent Developments
- 17.2.2.5. Financials (Based on Availability)
- 17.2.3 AT&T Intellectual Property
- 17.2.3.1. Overview
- 17.2.3.2. Products
- 17.2.3.3. SWOT Analysis
- 17.2.3.4. Recent Developments
- 17.2.3.5. Financials (Based on Availability)
- 17.2.4 Samsung Electronics Co Ltd
- 17.2.4.1. Overview
- 17.2.4.2. Products
- 17.2.4.3. SWOT Analysis
- 17.2.4.4. Recent Developments
- 17.2.4.5. Financials (Based on Availability)
- 17.2.5 Hewlett Packard Enterprise
- 17.2.5.1. Overview
- 17.2.5.2. Products
- 17.2.5.3. SWOT Analysis
- 17.2.5.4. Recent Developments
- 17.2.5.5. Financials (Based on Availability)
- 17.2.6 Microsoft Corporation
- 17.2.6.1. Overview
- 17.2.6.2. Products
- 17.2.6.3. SWOT Analysis
- 17.2.6.4. Recent Developments
- 17.2.6.5. Financials (Based on Availability)
- 17.2.7 Kyndryl Inc
- 17.2.7.1. Overview
- 17.2.7.2. Products
- 17.2.7.3. SWOT Analysis
- 17.2.7.4. Recent Developments
- 17.2.7.5. Financials (Based on Availability)
- 17.2.8 Wipro
- 17.2.8.1. Overview
- 17.2.8.2. Products
- 17.2.8.3. SWOT Analysis
- 17.2.8.4. Recent Developments
- 17.2.8.5. Financials (Based on Availability)
- 17.2.9 Telefónica SA
- 17.2.9.1. Overview
- 17.2.9.2. Products
- 17.2.9.3. SWOT Analysis
- 17.2.9.4. Recent Developments
- 17.2.9.5. Financials (Based on Availability)
- 17.2.10 Fujitsu
- 17.2.10.1. Overview
- 17.2.10.2. Products
- 17.2.10.3. SWOT Analysis
- 17.2.10.4. Recent Developments
- 17.2.10.5. Financials (Based on Availability)
- 17.2.11 Vodafone Group PLC
- 17.2.11.1. Overview
- 17.2.11.2. Products
- 17.2.11.3. SWOT Analysis
- 17.2.11.4. Recent Developments
- 17.2.11.5. Financials (Based on Availability)
- 17.2.1 Tech Mahindra
List of Figures
- Figure 1: Global Managed Mobility Services Industry Revenue Breakdown (Million, %) by Region 2024 & 2032
- Figure 2: Global Managed Mobility Services Industry Volume Breakdown (K Unit, %) by Region 2024 & 2032
- Figure 3: North America Managed Mobility Services Industry Revenue (Million), by Country 2024 & 2032
- Figure 4: North America Managed Mobility Services Industry Volume (K Unit), by Country 2024 & 2032
- Figure 5: North America Managed Mobility Services Industry Revenue Share (%), by Country 2024 & 2032
- Figure 6: North America Managed Mobility Services Industry Volume Share (%), by Country 2024 & 2032
- Figure 7: Europe Managed Mobility Services Industry Revenue (Million), by Country 2024 & 2032
- Figure 8: Europe Managed Mobility Services Industry Volume (K Unit), by Country 2024 & 2032
- Figure 9: Europe Managed Mobility Services Industry Revenue Share (%), by Country 2024 & 2032
- Figure 10: Europe Managed Mobility Services Industry Volume Share (%), by Country 2024 & 2032
- Figure 11: Asia Pacific Managed Mobility Services Industry Revenue (Million), by Country 2024 & 2032
- Figure 12: Asia Pacific Managed Mobility Services Industry Volume (K Unit), by Country 2024 & 2032
- Figure 13: Asia Pacific Managed Mobility Services Industry Revenue Share (%), by Country 2024 & 2032
- Figure 14: Asia Pacific Managed Mobility Services Industry Volume Share (%), by Country 2024 & 2032
- Figure 15: South America Managed Mobility Services Industry Revenue (Million), by Country 2024 & 2032
- Figure 16: South America Managed Mobility Services Industry Volume (K Unit), by Country 2024 & 2032
- Figure 17: South America Managed Mobility Services Industry Revenue Share (%), by Country 2024 & 2032
- Figure 18: South America Managed Mobility Services Industry Volume Share (%), by Country 2024 & 2032
- Figure 19: North America Managed Mobility Services Industry Revenue (Million), by Country 2024 & 2032
- Figure 20: North America Managed Mobility Services Industry Volume (K Unit), by Country 2024 & 2032
- Figure 21: North America Managed Mobility Services Industry Revenue Share (%), by Country 2024 & 2032
- Figure 22: North America Managed Mobility Services Industry Volume Share (%), by Country 2024 & 2032
- Figure 23: MEA Managed Mobility Services Industry Revenue (Million), by Country 2024 & 2032
- Figure 24: MEA Managed Mobility Services Industry Volume (K Unit), by Country 2024 & 2032
- Figure 25: MEA Managed Mobility Services Industry Revenue Share (%), by Country 2024 & 2032
- Figure 26: MEA Managed Mobility Services Industry Volume Share (%), by Country 2024 & 2032
- Figure 27: North America Managed Mobility Services Industry Revenue (Million), by Function 2024 & 2032
- Figure 28: North America Managed Mobility Services Industry Volume (K Unit), by Function 2024 & 2032
- Figure 29: North America Managed Mobility Services Industry Revenue Share (%), by Function 2024 & 2032
- Figure 30: North America Managed Mobility Services Industry Volume Share (%), by Function 2024 & 2032
- Figure 31: North America Managed Mobility Services Industry Revenue (Million), by Deployment 2024 & 2032
- Figure 32: North America Managed Mobility Services Industry Volume (K Unit), by Deployment 2024 & 2032
- Figure 33: North America Managed Mobility Services Industry Revenue Share (%), by Deployment 2024 & 2032
- Figure 34: North America Managed Mobility Services Industry Volume Share (%), by Deployment 2024 & 2032
- Figure 35: North America Managed Mobility Services Industry Revenue (Million), by End-user Industry 2024 & 2032
- Figure 36: North America Managed Mobility Services Industry Volume (K Unit), by End-user Industry 2024 & 2032
- Figure 37: North America Managed Mobility Services Industry Revenue Share (%), by End-user Industry 2024 & 2032
- Figure 38: North America Managed Mobility Services Industry Volume Share (%), by End-user Industry 2024 & 2032
- Figure 39: North America Managed Mobility Services Industry Revenue (Million), by Country 2024 & 2032
- Figure 40: North America Managed Mobility Services Industry Volume (K Unit), by Country 2024 & 2032
- Figure 41: North America Managed Mobility Services Industry Revenue Share (%), by Country 2024 & 2032
- Figure 42: North America Managed Mobility Services Industry Volume Share (%), by Country 2024 & 2032
- Figure 43: Europe Managed Mobility Services Industry Revenue (Million), by Function 2024 & 2032
- Figure 44: Europe Managed Mobility Services Industry Volume (K Unit), by Function 2024 & 2032
- Figure 45: Europe Managed Mobility Services Industry Revenue Share (%), by Function 2024 & 2032
- Figure 46: Europe Managed Mobility Services Industry Volume Share (%), by Function 2024 & 2032
- Figure 47: Europe Managed Mobility Services Industry Revenue (Million), by Deployment 2024 & 2032
- Figure 48: Europe Managed Mobility Services Industry Volume (K Unit), by Deployment 2024 & 2032
- Figure 49: Europe Managed Mobility Services Industry Revenue Share (%), by Deployment 2024 & 2032
- Figure 50: Europe Managed Mobility Services Industry Volume Share (%), by Deployment 2024 & 2032
- Figure 51: Europe Managed Mobility Services Industry Revenue (Million), by End-user Industry 2024 & 2032
- Figure 52: Europe Managed Mobility Services Industry Volume (K Unit), by End-user Industry 2024 & 2032
- Figure 53: Europe Managed Mobility Services Industry Revenue Share (%), by End-user Industry 2024 & 2032
- Figure 54: Europe Managed Mobility Services Industry Volume Share (%), by End-user Industry 2024 & 2032
- Figure 55: Europe Managed Mobility Services Industry Revenue (Million), by Country 2024 & 2032
- Figure 56: Europe Managed Mobility Services Industry Volume (K Unit), by Country 2024 & 2032
- Figure 57: Europe Managed Mobility Services Industry Revenue Share (%), by Country 2024 & 2032
- Figure 58: Europe Managed Mobility Services Industry Volume Share (%), by Country 2024 & 2032
- Figure 59: Asia Pacific Managed Mobility Services Industry Revenue (Million), by Function 2024 & 2032
- Figure 60: Asia Pacific Managed Mobility Services Industry Volume (K Unit), by Function 2024 & 2032
- Figure 61: Asia Pacific Managed Mobility Services Industry Revenue Share (%), by Function 2024 & 2032
- Figure 62: Asia Pacific Managed Mobility Services Industry Volume Share (%), by Function 2024 & 2032
- Figure 63: Asia Pacific Managed Mobility Services Industry Revenue (Million), by Deployment 2024 & 2032
- Figure 64: Asia Pacific Managed Mobility Services Industry Volume (K Unit), by Deployment 2024 & 2032
- Figure 65: Asia Pacific Managed Mobility Services Industry Revenue Share (%), by Deployment 2024 & 2032
- Figure 66: Asia Pacific Managed Mobility Services Industry Volume Share (%), by Deployment 2024 & 2032
- Figure 67: Asia Pacific Managed Mobility Services Industry Revenue (Million), by End-user Industry 2024 & 2032
- Figure 68: Asia Pacific Managed Mobility Services Industry Volume (K Unit), by End-user Industry 2024 & 2032
- Figure 69: Asia Pacific Managed Mobility Services Industry Revenue Share (%), by End-user Industry 2024 & 2032
- Figure 70: Asia Pacific Managed Mobility Services Industry Volume Share (%), by End-user Industry 2024 & 2032
- Figure 71: Asia Pacific Managed Mobility Services Industry Revenue (Million), by Country 2024 & 2032
- Figure 72: Asia Pacific Managed Mobility Services Industry Volume (K Unit), by Country 2024 & 2032
- Figure 73: Asia Pacific Managed Mobility Services Industry Revenue Share (%), by Country 2024 & 2032
- Figure 74: Asia Pacific Managed Mobility Services Industry Volume Share (%), by Country 2024 & 2032
- Figure 75: Latin America Managed Mobility Services Industry Revenue (Million), by Function 2024 & 2032
- Figure 76: Latin America Managed Mobility Services Industry Volume (K Unit), by Function 2024 & 2032
- Figure 77: Latin America Managed Mobility Services Industry Revenue Share (%), by Function 2024 & 2032
- Figure 78: Latin America Managed Mobility Services Industry Volume Share (%), by Function 2024 & 2032
- Figure 79: Latin America Managed Mobility Services Industry Revenue (Million), by Deployment 2024 & 2032
- Figure 80: Latin America Managed Mobility Services Industry Volume (K Unit), by Deployment 2024 & 2032
- Figure 81: Latin America Managed Mobility Services Industry Revenue Share (%), by Deployment 2024 & 2032
- Figure 82: Latin America Managed Mobility Services Industry Volume Share (%), by Deployment 2024 & 2032
- Figure 83: Latin America Managed Mobility Services Industry Revenue (Million), by End-user Industry 2024 & 2032
- Figure 84: Latin America Managed Mobility Services Industry Volume (K Unit), by End-user Industry 2024 & 2032
- Figure 85: Latin America Managed Mobility Services Industry Revenue Share (%), by End-user Industry 2024 & 2032
- Figure 86: Latin America Managed Mobility Services Industry Volume Share (%), by End-user Industry 2024 & 2032
- Figure 87: Latin America Managed Mobility Services Industry Revenue (Million), by Country 2024 & 2032
- Figure 88: Latin America Managed Mobility Services Industry Volume (K Unit), by Country 2024 & 2032
- Figure 89: Latin America Managed Mobility Services Industry Revenue Share (%), by Country 2024 & 2032
- Figure 90: Latin America Managed Mobility Services Industry Volume Share (%), by Country 2024 & 2032
- Figure 91: Middle East and Africa Managed Mobility Services Industry Revenue (Million), by Function 2024 & 2032
- Figure 92: Middle East and Africa Managed Mobility Services Industry Volume (K Unit), by Function 2024 & 2032
- Figure 93: Middle East and Africa Managed Mobility Services Industry Revenue Share (%), by Function 2024 & 2032
- Figure 94: Middle East and Africa Managed Mobility Services Industry Volume Share (%), by Function 2024 & 2032
- Figure 95: Middle East and Africa Managed Mobility Services Industry Revenue (Million), by Deployment 2024 & 2032
- Figure 96: Middle East and Africa Managed Mobility Services Industry Volume (K Unit), by Deployment 2024 & 2032
- Figure 97: Middle East and Africa Managed Mobility Services Industry Revenue Share (%), by Deployment 2024 & 2032
- Figure 98: Middle East and Africa Managed Mobility Services Industry Volume Share (%), by Deployment 2024 & 2032
- Figure 99: Middle East and Africa Managed Mobility Services Industry Revenue (Million), by End-user Industry 2024 & 2032
- Figure 100: Middle East and Africa Managed Mobility Services Industry Volume (K Unit), by End-user Industry 2024 & 2032
- Figure 101: Middle East and Africa Managed Mobility Services Industry Revenue Share (%), by End-user Industry 2024 & 2032
- Figure 102: Middle East and Africa Managed Mobility Services Industry Volume Share (%), by End-user Industry 2024 & 2032
- Figure 103: Middle East and Africa Managed Mobility Services Industry Revenue (Million), by Country 2024 & 2032
- Figure 104: Middle East and Africa Managed Mobility Services Industry Volume (K Unit), by Country 2024 & 2032
- Figure 105: Middle East and Africa Managed Mobility Services Industry Revenue Share (%), by Country 2024 & 2032
- Figure 106: Middle East and Africa Managed Mobility Services Industry Volume Share (%), by Country 2024 & 2032
List of Tables
- Table 1: Global Managed Mobility Services Industry Revenue Million Forecast, by Region 2019 & 2032
- Table 2: Global Managed Mobility Services Industry Volume K Unit Forecast, by Region 2019 & 2032
- Table 3: Global Managed Mobility Services Industry Revenue Million Forecast, by Function 2019 & 2032
- Table 4: Global Managed Mobility Services Industry Volume K Unit Forecast, by Function 2019 & 2032
- Table 5: Global Managed Mobility Services Industry Revenue Million Forecast, by Deployment 2019 & 2032
- Table 6: Global Managed Mobility Services Industry Volume K Unit Forecast, by Deployment 2019 & 2032
- Table 7: Global Managed Mobility Services Industry Revenue Million Forecast, by End-user Industry 2019 & 2032
- Table 8: Global Managed Mobility Services Industry Volume K Unit Forecast, by End-user Industry 2019 & 2032
- Table 9: Global Managed Mobility Services Industry Revenue Million Forecast, by Region 2019 & 2032
- Table 10: Global Managed Mobility Services Industry Volume K Unit Forecast, by Region 2019 & 2032
- Table 11: Global Managed Mobility Services Industry Revenue Million Forecast, by Country 2019 & 2032
- Table 12: Global Managed Mobility Services Industry Volume K Unit Forecast, by Country 2019 & 2032
- Table 13: United States Managed Mobility Services Industry Revenue (Million) Forecast, by Application 2019 & 2032
- Table 14: United States Managed Mobility Services Industry Volume (K Unit) Forecast, by Application 2019 & 2032
- Table 15: Canada Managed Mobility Services Industry Revenue (Million) Forecast, by Application 2019 & 2032
- Table 16: Canada Managed Mobility Services Industry Volume (K Unit) Forecast, by Application 2019 & 2032
- Table 17: Mexico Managed Mobility Services Industry Revenue (Million) Forecast, by Application 2019 & 2032
- Table 18: Mexico Managed Mobility Services Industry Volume (K Unit) Forecast, by Application 2019 & 2032
- Table 19: Global Managed Mobility Services Industry Revenue Million Forecast, by Country 2019 & 2032
- Table 20: Global Managed Mobility Services Industry Volume K Unit Forecast, by Country 2019 & 2032
- Table 21: Germany Managed Mobility Services Industry Revenue (Million) Forecast, by Application 2019 & 2032
- Table 22: Germany Managed Mobility Services Industry Volume (K Unit) Forecast, by Application 2019 & 2032
- Table 23: United Kingdom Managed Mobility Services Industry Revenue (Million) Forecast, by Application 2019 & 2032
- Table 24: United Kingdom Managed Mobility Services Industry Volume (K Unit) Forecast, by Application 2019 & 2032
- Table 25: France Managed Mobility Services Industry Revenue (Million) Forecast, by Application 2019 & 2032
- Table 26: France Managed Mobility Services Industry Volume (K Unit) Forecast, by Application 2019 & 2032
- Table 27: Spain Managed Mobility Services Industry Revenue (Million) Forecast, by Application 2019 & 2032
- Table 28: Spain Managed Mobility Services Industry Volume (K Unit) Forecast, by Application 2019 & 2032
- Table 29: Italy Managed Mobility Services Industry Revenue (Million) Forecast, by Application 2019 & 2032
- Table 30: Italy Managed Mobility Services Industry Volume (K Unit) Forecast, by Application 2019 & 2032
- Table 31: Spain Managed Mobility Services Industry Revenue (Million) Forecast, by Application 2019 & 2032
- Table 32: Spain Managed Mobility Services Industry Volume (K Unit) Forecast, by Application 2019 & 2032
- Table 33: Belgium Managed Mobility Services Industry Revenue (Million) Forecast, by Application 2019 & 2032
- Table 34: Belgium Managed Mobility Services Industry Volume (K Unit) Forecast, by Application 2019 & 2032
- Table 35: Netherland Managed Mobility Services Industry Revenue (Million) Forecast, by Application 2019 & 2032
- Table 36: Netherland Managed Mobility Services Industry Volume (K Unit) Forecast, by Application 2019 & 2032
- Table 37: Nordics Managed Mobility Services Industry Revenue (Million) Forecast, by Application 2019 & 2032
- Table 38: Nordics Managed Mobility Services Industry Volume (K Unit) Forecast, by Application 2019 & 2032
- Table 39: Rest of Europe Managed Mobility Services Industry Revenue (Million) Forecast, by Application 2019 & 2032
- Table 40: Rest of Europe Managed Mobility Services Industry Volume (K Unit) Forecast, by Application 2019 & 2032
- Table 41: Global Managed Mobility Services Industry Revenue Million Forecast, by Country 2019 & 2032
- Table 42: Global Managed Mobility Services Industry Volume K Unit Forecast, by Country 2019 & 2032
- Table 43: China Managed Mobility Services Industry Revenue (Million) Forecast, by Application 2019 & 2032
- Table 44: China Managed Mobility Services Industry Volume (K Unit) Forecast, by Application 2019 & 2032
- Table 45: Japan Managed Mobility Services Industry Revenue (Million) Forecast, by Application 2019 & 2032
- Table 46: Japan Managed Mobility Services Industry Volume (K Unit) Forecast, by Application 2019 & 2032
- Table 47: India Managed Mobility Services Industry Revenue (Million) Forecast, by Application 2019 & 2032
- Table 48: India Managed Mobility Services Industry Volume (K Unit) Forecast, by Application 2019 & 2032
- Table 49: South Korea Managed Mobility Services Industry Revenue (Million) Forecast, by Application 2019 & 2032
- Table 50: South Korea Managed Mobility Services Industry Volume (K Unit) Forecast, by Application 2019 & 2032
- Table 51: Southeast Asia Managed Mobility Services Industry Revenue (Million) Forecast, by Application 2019 & 2032
- Table 52: Southeast Asia Managed Mobility Services Industry Volume (K Unit) Forecast, by Application 2019 & 2032
- Table 53: Australia Managed Mobility Services Industry Revenue (Million) Forecast, by Application 2019 & 2032
- Table 54: Australia Managed Mobility Services Industry Volume (K Unit) Forecast, by Application 2019 & 2032
- Table 55: Indonesia Managed Mobility Services Industry Revenue (Million) Forecast, by Application 2019 & 2032
- Table 56: Indonesia Managed Mobility Services Industry Volume (K Unit) Forecast, by Application 2019 & 2032
- Table 57: Phillipes Managed Mobility Services Industry Revenue (Million) Forecast, by Application 2019 & 2032
- Table 58: Phillipes Managed Mobility Services Industry Volume (K Unit) Forecast, by Application 2019 & 2032
- Table 59: Singapore Managed Mobility Services Industry Revenue (Million) Forecast, by Application 2019 & 2032
- Table 60: Singapore Managed Mobility Services Industry Volume (K Unit) Forecast, by Application 2019 & 2032
- Table 61: Thailandc Managed Mobility Services Industry Revenue (Million) Forecast, by Application 2019 & 2032
- Table 62: Thailandc Managed Mobility Services Industry Volume (K Unit) Forecast, by Application 2019 & 2032
- Table 63: Rest of Asia Pacific Managed Mobility Services Industry Revenue (Million) Forecast, by Application 2019 & 2032
- Table 64: Rest of Asia Pacific Managed Mobility Services Industry Volume (K Unit) Forecast, by Application 2019 & 2032
- Table 65: Global Managed Mobility Services Industry Revenue Million Forecast, by Country 2019 & 2032
- Table 66: Global Managed Mobility Services Industry Volume K Unit Forecast, by Country 2019 & 2032
- Table 67: Brazil Managed Mobility Services Industry Revenue (Million) Forecast, by Application 2019 & 2032
- Table 68: Brazil Managed Mobility Services Industry Volume (K Unit) Forecast, by Application 2019 & 2032
- Table 69: Argentina Managed Mobility Services Industry Revenue (Million) Forecast, by Application 2019 & 2032
- Table 70: Argentina Managed Mobility Services Industry Volume (K Unit) Forecast, by Application 2019 & 2032
- Table 71: Peru Managed Mobility Services Industry Revenue (Million) Forecast, by Application 2019 & 2032
- Table 72: Peru Managed Mobility Services Industry Volume (K Unit) Forecast, by Application 2019 & 2032
- Table 73: Chile Managed Mobility Services Industry Revenue (Million) Forecast, by Application 2019 & 2032
- Table 74: Chile Managed Mobility Services Industry Volume (K Unit) Forecast, by Application 2019 & 2032
- Table 75: Colombia Managed Mobility Services Industry Revenue (Million) Forecast, by Application 2019 & 2032
- Table 76: Colombia Managed Mobility Services Industry Volume (K Unit) Forecast, by Application 2019 & 2032
- Table 77: Ecuador Managed Mobility Services Industry Revenue (Million) Forecast, by Application 2019 & 2032
- Table 78: Ecuador Managed Mobility Services Industry Volume (K Unit) Forecast, by Application 2019 & 2032
- Table 79: Venezuela Managed Mobility Services Industry Revenue (Million) Forecast, by Application 2019 & 2032
- Table 80: Venezuela Managed Mobility Services Industry Volume (K Unit) Forecast, by Application 2019 & 2032
- Table 81: Rest of South America Managed Mobility Services Industry Revenue (Million) Forecast, by Application 2019 & 2032
- Table 82: Rest of South America Managed Mobility Services Industry Volume (K Unit) Forecast, by Application 2019 & 2032
- Table 83: Global Managed Mobility Services Industry Revenue Million Forecast, by Country 2019 & 2032
- Table 84: Global Managed Mobility Services Industry Volume K Unit Forecast, by Country 2019 & 2032
- Table 85: United States Managed Mobility Services Industry Revenue (Million) Forecast, by Application 2019 & 2032
- Table 86: United States Managed Mobility Services Industry Volume (K Unit) Forecast, by Application 2019 & 2032
- Table 87: Canada Managed Mobility Services Industry Revenue (Million) Forecast, by Application 2019 & 2032
- Table 88: Canada Managed Mobility Services Industry Volume (K Unit) Forecast, by Application 2019 & 2032
- Table 89: Mexico Managed Mobility Services Industry Revenue (Million) Forecast, by Application 2019 & 2032
- Table 90: Mexico Managed Mobility Services Industry Volume (K Unit) Forecast, by Application 2019 & 2032
- Table 91: Global Managed Mobility Services Industry Revenue Million Forecast, by Country 2019 & 2032
- Table 92: Global Managed Mobility Services Industry Volume K Unit Forecast, by Country 2019 & 2032
- Table 93: United Arab Emirates Managed Mobility Services Industry Revenue (Million) Forecast, by Application 2019 & 2032
- Table 94: United Arab Emirates Managed Mobility Services Industry Volume (K Unit) Forecast, by Application 2019 & 2032
- Table 95: Saudi Arabia Managed Mobility Services Industry Revenue (Million) Forecast, by Application 2019 & 2032
- Table 96: Saudi Arabia Managed Mobility Services Industry Volume (K Unit) Forecast, by Application 2019 & 2032
- Table 97: South Africa Managed Mobility Services Industry Revenue (Million) Forecast, by Application 2019 & 2032
- Table 98: South Africa Managed Mobility Services Industry Volume (K Unit) Forecast, by Application 2019 & 2032
- Table 99: Rest of Middle East and Africa Managed Mobility Services Industry Revenue (Million) Forecast, by Application 2019 & 2032
- Table 100: Rest of Middle East and Africa Managed Mobility Services Industry Volume (K Unit) Forecast, by Application 2019 & 2032
- Table 101: Global Managed Mobility Services Industry Revenue Million Forecast, by Function 2019 & 2032
- Table 102: Global Managed Mobility Services Industry Volume K Unit Forecast, by Function 2019 & 2032
- Table 103: Global Managed Mobility Services Industry Revenue Million Forecast, by Deployment 2019 & 2032
- Table 104: Global Managed Mobility Services Industry Volume K Unit Forecast, by Deployment 2019 & 2032
- Table 105: Global Managed Mobility Services Industry Revenue Million Forecast, by End-user Industry 2019 & 2032
- Table 106: Global Managed Mobility Services Industry Volume K Unit Forecast, by End-user Industry 2019 & 2032
- Table 107: Global Managed Mobility Services Industry Revenue Million Forecast, by Country 2019 & 2032
- Table 108: Global Managed Mobility Services Industry Volume K Unit Forecast, by Country 2019 & 2032
- Table 109: United States Managed Mobility Services Industry Revenue (Million) Forecast, by Application 2019 & 2032
- Table 110: United States Managed Mobility Services Industry Volume (K Unit) Forecast, by Application 2019 & 2032
- Table 111: Canada Managed Mobility Services Industry Revenue (Million) Forecast, by Application 2019 & 2032
- Table 112: Canada Managed Mobility Services Industry Volume (K Unit) Forecast, by Application 2019 & 2032
- Table 113: Global Managed Mobility Services Industry Revenue Million Forecast, by Function 2019 & 2032
- Table 114: Global Managed Mobility Services Industry Volume K Unit Forecast, by Function 2019 & 2032
- Table 115: Global Managed Mobility Services Industry Revenue Million Forecast, by Deployment 2019 & 2032
- Table 116: Global Managed Mobility Services Industry Volume K Unit Forecast, by Deployment 2019 & 2032
- Table 117: Global Managed Mobility Services Industry Revenue Million Forecast, by End-user Industry 2019 & 2032
- Table 118: Global Managed Mobility Services Industry Volume K Unit Forecast, by End-user Industry 2019 & 2032
- Table 119: Global Managed Mobility Services Industry Revenue Million Forecast, by Country 2019 & 2032
- Table 120: Global Managed Mobility Services Industry Volume K Unit Forecast, by Country 2019 & 2032
- Table 121: United Kingdom Managed Mobility Services Industry Revenue (Million) Forecast, by Application 2019 & 2032
- Table 122: United Kingdom Managed Mobility Services Industry Volume (K Unit) Forecast, by Application 2019 & 2032
- Table 123: Germany Managed Mobility Services Industry Revenue (Million) Forecast, by Application 2019 & 2032
- Table 124: Germany Managed Mobility Services Industry Volume (K Unit) Forecast, by Application 2019 & 2032
- Table 125: France Managed Mobility Services Industry Revenue (Million) Forecast, by Application 2019 & 2032
- Table 126: France Managed Mobility Services Industry Volume (K Unit) Forecast, by Application 2019 & 2032
- Table 127: Rest of Europe Managed Mobility Services Industry Revenue (Million) Forecast, by Application 2019 & 2032
- Table 128: Rest of Europe Managed Mobility Services Industry Volume (K Unit) Forecast, by Application 2019 & 2032
- Table 129: Global Managed Mobility Services Industry Revenue Million Forecast, by Function 2019 & 2032
- Table 130: Global Managed Mobility Services Industry Volume K Unit Forecast, by Function 2019 & 2032
- Table 131: Global Managed Mobility Services Industry Revenue Million Forecast, by Deployment 2019 & 2032
- Table 132: Global Managed Mobility Services Industry Volume K Unit Forecast, by Deployment 2019 & 2032
- Table 133: Global Managed Mobility Services Industry Revenue Million Forecast, by End-user Industry 2019 & 2032
- Table 134: Global Managed Mobility Services Industry Volume K Unit Forecast, by End-user Industry 2019 & 2032
- Table 135: Global Managed Mobility Services Industry Revenue Million Forecast, by Country 2019 & 2032
- Table 136: Global Managed Mobility Services Industry Volume K Unit Forecast, by Country 2019 & 2032
- Table 137: China Managed Mobility Services Industry Revenue (Million) Forecast, by Application 2019 & 2032
- Table 138: China Managed Mobility Services Industry Volume (K Unit) Forecast, by Application 2019 & 2032
- Table 139: India Managed Mobility Services Industry Revenue (Million) Forecast, by Application 2019 & 2032
- Table 140: India Managed Mobility Services Industry Volume (K Unit) Forecast, by Application 2019 & 2032
- Table 141: Japan Managed Mobility Services Industry Revenue (Million) Forecast, by Application 2019 & 2032
- Table 142: Japan Managed Mobility Services Industry Volume (K Unit) Forecast, by Application 2019 & 2032
- Table 143: Rest of Asia Pacific Managed Mobility Services Industry Revenue (Million) Forecast, by Application 2019 & 2032
- Table 144: Rest of Asia Pacific Managed Mobility Services Industry Volume (K Unit) Forecast, by Application 2019 & 2032
- Table 145: Global Managed Mobility Services Industry Revenue Million Forecast, by Function 2019 & 2032
- Table 146: Global Managed Mobility Services Industry Volume K Unit Forecast, by Function 2019 & 2032
- Table 147: Global Managed Mobility Services Industry Revenue Million Forecast, by Deployment 2019 & 2032
- Table 148: Global Managed Mobility Services Industry Volume K Unit Forecast, by Deployment 2019 & 2032
- Table 149: Global Managed Mobility Services Industry Revenue Million Forecast, by End-user Industry 2019 & 2032
- Table 150: Global Managed Mobility Services Industry Volume K Unit Forecast, by End-user Industry 2019 & 2032
- Table 151: Global Managed Mobility Services Industry Revenue Million Forecast, by Country 2019 & 2032
- Table 152: Global Managed Mobility Services Industry Volume K Unit Forecast, by Country 2019 & 2032
- Table 153: Brazil Managed Mobility Services Industry Revenue (Million) Forecast, by Application 2019 & 2032
- Table 154: Brazil Managed Mobility Services Industry Volume (K Unit) Forecast, by Application 2019 & 2032
- Table 155: Argentina Managed Mobility Services Industry Revenue (Million) Forecast, by Application 2019 & 2032
- Table 156: Argentina Managed Mobility Services Industry Volume (K Unit) Forecast, by Application 2019 & 2032
- Table 157: Mexico Managed Mobility Services Industry Revenue (Million) Forecast, by Application 2019 & 2032
- Table 158: Mexico Managed Mobility Services Industry Volume (K Unit) Forecast, by Application 2019 & 2032
- Table 159: Rest of Latin America Managed Mobility Services Industry Revenue (Million) Forecast, by Application 2019 & 2032
- Table 160: Rest of Latin America Managed Mobility Services Industry Volume (K Unit) Forecast, by Application 2019 & 2032
- Table 161: Global Managed Mobility Services Industry Revenue Million Forecast, by Function 2019 & 2032
- Table 162: Global Managed Mobility Services Industry Volume K Unit Forecast, by Function 2019 & 2032
- Table 163: Global Managed Mobility Services Industry Revenue Million Forecast, by Deployment 2019 & 2032
- Table 164: Global Managed Mobility Services Industry Volume K Unit Forecast, by Deployment 2019 & 2032
- Table 165: Global Managed Mobility Services Industry Revenue Million Forecast, by End-user Industry 2019 & 2032
- Table 166: Global Managed Mobility Services Industry Volume K Unit Forecast, by End-user Industry 2019 & 2032
- Table 167: Global Managed Mobility Services Industry Revenue Million Forecast, by Country 2019 & 2032
- Table 168: Global Managed Mobility Services Industry Volume K Unit Forecast, by Country 2019 & 2032
- Table 169: United Arab Emirates Managed Mobility Services Industry Revenue (Million) Forecast, by Application 2019 & 2032
- Table 170: United Arab Emirates Managed Mobility Services Industry Volume (K Unit) Forecast, by Application 2019 & 2032
- Table 171: Saudi Arabia Managed Mobility Services Industry Revenue (Million) Forecast, by Application 2019 & 2032
- Table 172: Saudi Arabia Managed Mobility Services Industry Volume (K Unit) Forecast, by Application 2019 & 2032
- Table 173: South Africa Managed Mobility Services Industry Revenue (Million) Forecast, by Application 2019 & 2032
- Table 174: South Africa Managed Mobility Services Industry Volume (K Unit) Forecast, by Application 2019 & 2032
- Table 175: Rest of Middle East and Africa Managed Mobility Services Industry Revenue (Million) Forecast, by Application 2019 & 2032
- Table 176: Rest of Middle East and Africa Managed Mobility Services Industry Volume (K Unit) Forecast, by Application 2019 & 2032
Frequently Asked Questions
1. What is the projected Compound Annual Growth Rate (CAGR) of the Managed Mobility Services Industry?
The projected CAGR is approximately 25.41%.
2. Which companies are prominent players in the Managed Mobility Services Industry?
Key companies in the market include Tech Mahindra, Orange SA, AT&T Intellectual Property, Samsung Electronics Co Ltd, Hewlett Packard Enterprise, Microsoft Corporation, Kyndryl Inc, Wipro, Telefónica SA, Fujitsu, Vodafone Group PLC.
3. What are the main segments of the Managed Mobility Services Industry?
The market segments include Function, Deployment, End-user Industry.
4. Can you provide details about the market size?
The market size is estimated to be USD 6.07 Million as of 2022.
5. What are some drivers contributing to market growth?
Increasing Adoption of BYOD in Multiple Industries; Companies Outsourcing IT Activities.
6. What are the notable trends driving market growth?
IT and Telecom End-user Industry Segment Holds Significant Market Share.
7. Are there any restraints impacting market growth?
Lack of Control over Operations and Cost Visibility.
8. Can you provide examples of recent developments in the market?
February 2023: Kyndryland Microsoft established its first Latin American Center of Excellence with multidisciplinary teams in Brazil, Colombia, Mexico, and Peru. The center combines Kyndryl'sexpertise and understanding of mission-critical IT systems with the Microsoft Cloud to assist companies in the region in accelerating their digital transformation journeys. Organizations throughout Latin America have identified the need to modernize their IT structures and legacy systems by migrating to cloud environments. This will allow them to increase hybrid cloud speed and agility. According to IDC, the cloud market in the region will grow by more than 30% by 2023. Furthermore, the Kyndryland Microsoft Center of Excellence will be a central hub of information, resources, and skills related to Microsoft technologies to support enterprise customers throughout Latin America. Kyndryl's experts in solutions, consulting, and managed services, will collaborate with Microsoft architects and technical staff to co-create replicable assets, conduct proof of concepts (POCs), and scale innovation best practices.
9. What pricing options are available for accessing the report?
Pricing options include single-user, multi-user, and enterprise licenses priced at USD 4750, USD 5250, and USD 8750 respectively.
10. Is the market size provided in terms of value or volume?
The market size is provided in terms of value, measured in Million and volume, measured in K Unit.
11. Are there any specific market keywords associated with the report?
Yes, the market keyword associated with the report is "Managed Mobility Services Industry," which aids in identifying and referencing the specific market segment covered.
12. How do I determine which pricing option suits my needs best?
The pricing options vary based on user requirements and access needs. Individual users may opt for single-user licenses, while businesses requiring broader access may choose multi-user or enterprise licenses for cost-effective access to the report.
13. Are there any additional resources or data provided in the Managed Mobility Services Industry report?
While the report offers comprehensive insights, it's advisable to review the specific contents or supplementary materials provided to ascertain if additional resources or data are available.
14. How can I stay updated on further developments or reports in the Managed Mobility Services Industry?
To stay informed about further developments, trends, and reports in the Managed Mobility Services Industry, consider subscribing to industry newsletters, following relevant companies and organizations, or regularly checking reputable industry news sources and publications.
Methodology
Step 1 - Identification of Relevant Samples Size from Population Database


Step 2 - Approaches for Defining Global Market Size (Value, Volume* & Price*)

Note*: In applicable scenarios
Step 3 - Data Sources
Primary Research
- Web Analytics
- Survey Reports
- Research Institute
- Latest Research Reports
- Opinion Leaders
Secondary Research
- Annual Reports
- White Paper
- Latest Press Release
- Industry Association
- Paid Database
- Investor Presentations

Step 4 - Data Triangulation
Involves using different sources of information in order to increase the validity of a study
These sources are likely to be stakeholders in a program - participants, other researchers, program staff, other community members, and so on.
Then we put all data in single framework & apply various statistical tools to find out the dynamic on the market.
During the analysis stage, feedback from the stakeholder groups would be compared to determine areas of agreement as well as areas of divergence


