

Key Insights
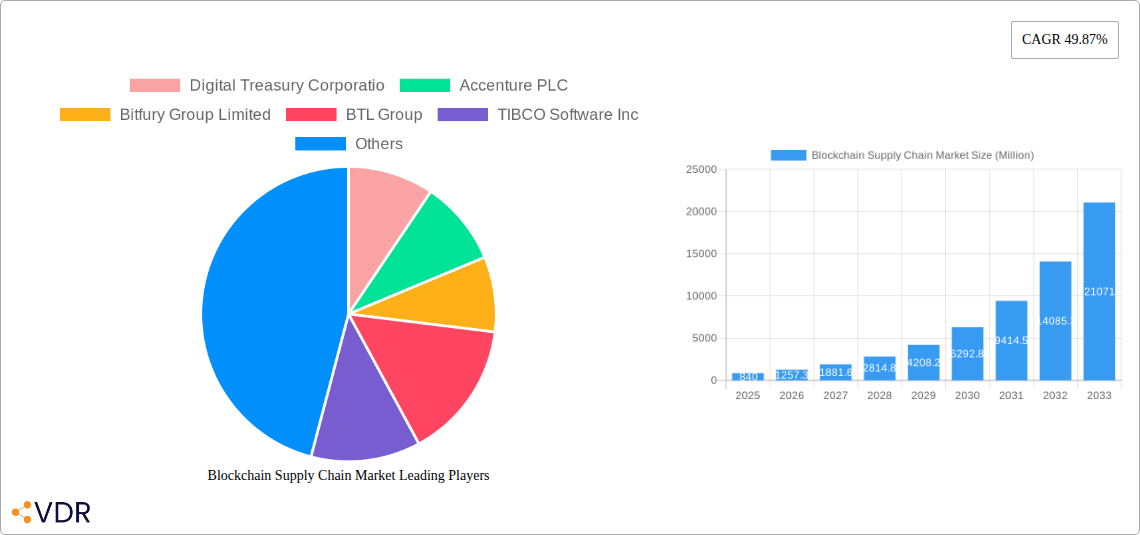
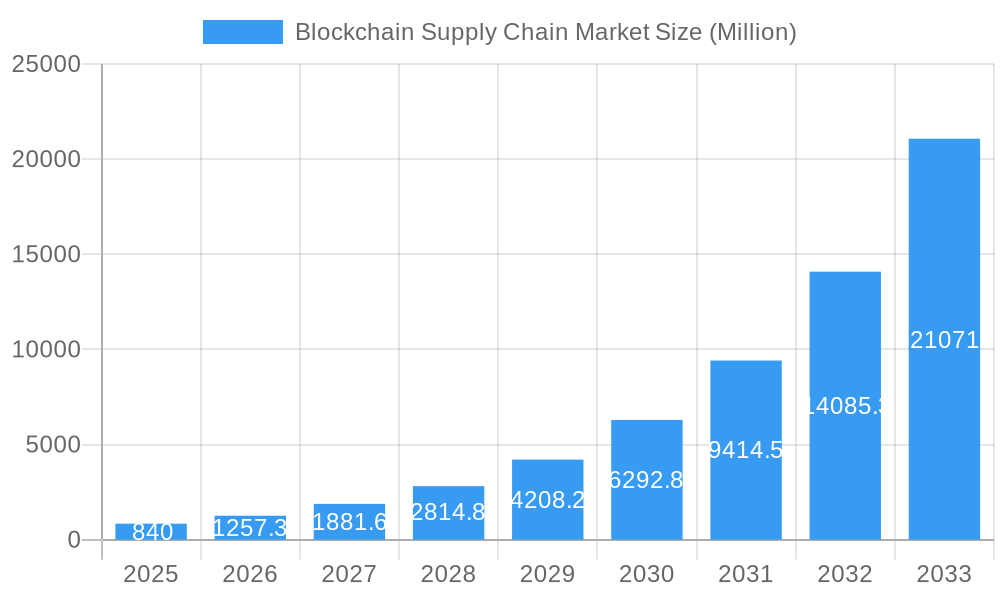
The Blockchain Supply Chain market is experiencing explosive growth, projected to reach a value of $0.84 billion in 2025 and exhibiting a remarkable Compound Annual Growth Rate (CAGR) of 49.87%. This robust expansion is driven by several key factors. The increasing need for enhanced transparency and traceability across complex supply chains is a primary driver, particularly within industries like retail, healthcare, and manufacturing. Businesses are actively seeking solutions to combat counterfeiting, improve efficiency, and enhance regulatory compliance. The inherent security and immutability of blockchain technology offer a compelling solution to these challenges, leading to its widespread adoption. Furthermore, the maturation of blockchain platforms and services, coupled with decreasing implementation costs, is making this technology increasingly accessible to a broader range of businesses. This market is segmented by component (platforms and services) and application (payment & settlement, product traceability, counterfeit detection, smart contracts, risk & compliance management, and other applications), offering diverse opportunities for specialized solutions. Geographic growth is expected to be robust across North America, Europe, and Asia Pacific, fueled by early adoption and substantial investment in blockchain technology within these regions. However, challenges such as regulatory uncertainty, technological complexity, and the need for robust integration with existing systems remain obstacles to wider market penetration.
Blockchain Supply Chain Market Market Size (In Million)
Despite these challenges, the long-term outlook for the Blockchain Supply Chain market remains exceptionally positive. Continued technological advancements, increased industry collaboration, and a growing understanding of the benefits of blockchain will contribute to sustained growth. The increasing demand for secure and transparent supply chain operations, driven by evolving consumer expectations and stringent regulatory compliance requirements, will be a pivotal force in shaping market dynamics. The market will likely see further specialization within the application segments, with companies developing tailored blockchain solutions to address specific industry needs. This will result in a diverse and dynamic market landscape with continued opportunities for innovation and market expansion. The projected growth trajectory suggests significant investment potential for businesses operating in this rapidly evolving space.
Blockchain Supply Chain Market Company Market Share
Blockchain Supply Chain Market: A Comprehensive Report (2019-2033)
This in-depth report provides a comprehensive analysis of the Blockchain Supply Chain Market, encompassing market dynamics, growth trends, regional dominance, product landscape, key players, and future outlook. The study period covers 2019-2033, with a base year of 2025 and a forecast period of 2025-2033. The market is segmented by component (Platform, Services), application (Payment & Settlement, Product Traceability, Counterfeit Detection, Smart Contracts, Risk & Compliance Management, Other Applications), and industry vertical (Retail & Consumer Goods, Healthcare & Life Sciences, Manufacturing, Logistics, Oil & Gas, Other Industry Verticals). The total market size in 2025 is estimated at xx Million.
Blockchain Supply Chain Market Dynamics & Structure
The Blockchain Supply Chain Market is characterized by a moderately concentrated landscape with several major players vying for market share. Technological innovation, particularly in areas like interoperability and scalability, is a key driver, while regulatory uncertainty and the need for robust security protocols present significant challenges. The market is witnessing a rise in mergers and acquisitions (M&A) activity, as larger players seek to consolidate their position and expand their capabilities. The adoption of blockchain technology is being propelled by increasing demand for transparency, traceability, and efficiency across various industries.
- Market Concentration: Moderately concentrated, with top 5 players holding approximately xx% market share in 2025.
- Technological Innovation: Focus on improving scalability, interoperability, and security of blockchain solutions.
- Regulatory Frameworks: Evolving regulations present both opportunities and challenges for market growth.
- Competitive Product Substitutes: Traditional supply chain management systems pose competition.
- End-User Demographics: Adoption is highest in industries with high value-added products and complex supply chains.
- M&A Trends: Increasing M&A activity, driven by the desire for market consolidation and technological integration. An estimated xx M&A deals were observed between 2019 and 2024.
Blockchain Supply Chain Market Growth Trends & Insights
The Blockchain Supply Chain Market is experiencing significant growth, driven by the increasing adoption of blockchain technology across various industries. The market size has grown considerably from xx Million in 2019 to an estimated xx Million in 2025, exhibiting a Compound Annual Growth Rate (CAGR) of xx% during the historical period. This growth is expected to continue at a CAGR of xx% from 2025 to 2033. Market penetration is gradually increasing, with particular traction in the retail, healthcare, and manufacturing sectors. Technological advancements, such as the development of more efficient consensus mechanisms and improved data privacy features, are further fueling this growth. A shift towards greater transparency and accountability in supply chains is also driving adoption. The rising consumer preference for ethically sourced and sustainable products is another factor significantly impacting market growth.
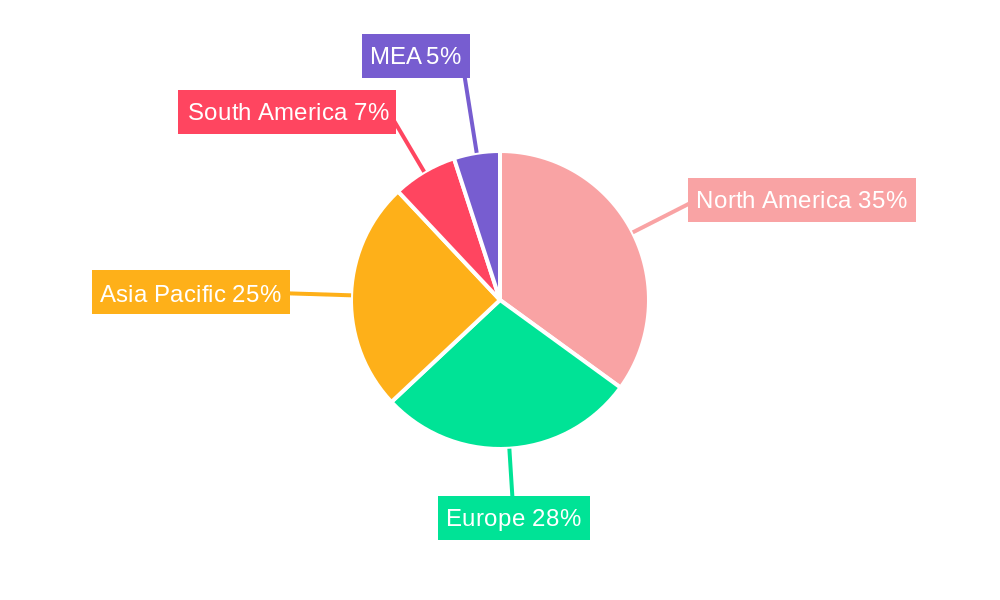
Dominant Regions, Countries, or Segments in Blockchain Supply Chain Market
The North American region currently dominates the Blockchain Supply Chain Market, driven by early adoption by large enterprises and supportive regulatory frameworks. However, the Asia-Pacific region is projected to experience the fastest growth in the forecast period due to its rapidly expanding technological infrastructure and growing e-commerce sector.
By Component: The Platform segment holds a larger market share compared to the Services segment due to its inherent value in establishing a fundamental blockchain architecture for supply chain solutions.
By Application: Product Traceability and Counterfeit Detection are the leading applications, driven by the increasing demand for product authenticity and supply chain transparency in various industries. Smart Contracts are also gaining traction, offering automation and enhanced efficiency.
By Industry Vertical: The Retail & Consumer Goods sector is currently the largest adopter of blockchain technology for supply chain management, followed by the Healthcare & Life Sciences and Manufacturing sectors.
- Key Drivers (North America): Strong technological infrastructure, early adoption by enterprises, supportive regulatory environment.
- Key Drivers (Asia-Pacific): Rapid economic growth, expanding e-commerce market, increasing government support for technological innovation.
- Market Share: North America holds approximately xx% of the market share in 2025, while Asia-Pacific is projected to reach xx% by 2033.
Blockchain Supply Chain Market Product Landscape
The Blockchain Supply Chain Market offers a range of solutions, from enterprise-grade platforms to specialized services catering to specific industry needs. Recent product innovations include improved scalability, enhanced security features, and greater interoperability between different blockchain networks. Companies are increasingly focusing on user-friendly interfaces and integrated analytics dashboards to make blockchain solutions more accessible and easier to implement. Unique selling propositions often involve features such as real-time tracking, improved data security, and reduced operational costs.
Key Drivers, Barriers & Challenges in Blockchain Supply Chain Market
Key Drivers:
- Increasing demand for transparency and traceability in supply chains.
- Growing adoption of IoT devices and their integration with blockchain solutions.
- Technological advancements improving scalability and interoperability.
- Government initiatives promoting the adoption of blockchain technology.
Challenges & Restraints:
- High implementation costs associated with blockchain technology.
- Regulatory uncertainty and the lack of standardized regulations.
- Scalability and interoperability issues across different blockchain networks.
- Lack of skilled professionals experienced in blockchain development and implementation. This translates to a xx% increase in project delays and cost overruns.
Emerging Opportunities in Blockchain Supply Chain Market
Emerging opportunities include the integration of blockchain with other emerging technologies like AI and IoT, expanding into new industry verticals (e.g., agriculture, energy), and developing more specialized blockchain solutions tailored to specific supply chain needs. The potential for improved sustainability tracking and ethical sourcing presents significant growth opportunities.
Growth Accelerators in the Blockchain Supply Chain Market Industry
Technological breakthroughs, such as the development of more energy-efficient consensus mechanisms and improved interoperability protocols, will significantly drive market growth. Strategic partnerships between technology providers, businesses, and governments will play a critical role in accelerating adoption. Market expansion into new geographies with strong economic growth and favorable regulatory environments will also contribute to market expansion.
Key Players Shaping the Blockchain Supply Chain Market Market
- Digital Treasury Corporation
- Accenture PLC
- Bitfury Group Limited
- BTL Group
- TIBCO Software Inc
- IBM Corporation
- Microsoft Corporation
- Amazon Web Services Inc
- Huawei Technologies Co Ltd
- Oracle Corporation
- VeChain Foundation
- Omnichain Inc
- Guardtime Inc
- Auxesis Group
- SAP SE
Notable Milestones in Blockchain Supply Chain Market Sector
- November 2023: MY E.G. Service’s Zetrix launches a supply chain financing project with Chinese banks.
- February 2023: The US Air Force invests USD 30 Million in SIMBA Chain for blockchain-based supply chain management.
- August 2022: Oracle partners with InfStones to expand its blockchain product portfolio.
- March 2022: Unilever adopts SAP SE's blockchain technology for palm oil supply chain tracking.
In-Depth Blockchain Supply Chain Market Market Outlook
The future of the Blockchain Supply Chain Market is bright, with significant potential for growth driven by continued technological advancements, increasing regulatory clarity, and expanding adoption across a wider range of industries. Strategic partnerships, innovative product development, and a focus on user experience will be critical success factors for companies operating in this dynamic market. The market is poised for substantial expansion, with opportunities for companies to capitalize on the growing demand for secure, transparent, and efficient supply chains.
Blockchain Supply Chain Market Segmentation
-
1. Application
- 1.1. Payment & Settlement
- 1.2. Product Traceability
- 1.3. Counterfeit Detection
- 1.4. Smart Contracts
- 1.5. Risk & Compliance Management
- 1.6. Other Applications
-
2. Industry Vertical
- 2.1. Retail & Consumer Goods
- 2.2. Healthcare & Life Sciences
- 2.3. Manufacturing
- 2.4. Logistics, Oil & Gas
- 2.5. Other Industry Verticals
-
3. Component
- 3.1. Platform
- 3.2. Services
Blockchain Supply Chain Market Segmentation By Geography
-
1. North America
- 1.1. United States
- 1.2. Canada
-
2. Europe
- 2.1. Germany
- 2.2. United Kingdom
- 2.3. France
- 2.4. Spain
-
3. Asia
- 3.1. China
- 3.2. Japan
- 3.3. India
- 3.4. Australia
-
4. Latin America
- 4.1. Brazil
- 4.2. Mexico
- 4.3. Argentina
-
5. Middle East and Africa
- 5.1. United Arab Emirates
- 5.2. Saudi Arabia
- 5.3. South Africa
Blockchain Supply Chain Market Regional Market Share
Geographic Coverage of Blockchain Supply Chain Market
Blockchain Supply Chain Market REPORT HIGHLIGHTS
| Aspects | Details |
|---|---|
| Study Period | 2020-2034 |
| Base Year | 2025 |
| Estimated Year | 2026 |
| Forecast Period | 2026-2034 |
| Historical Period | 2020-2025 |
| Growth Rate | CAGR of 49.87% from 2020-2034 |
| Segmentation |
|
Table of Contents
- 1. Introduction
- 1.1. Research Scope
- 1.2. Market Segmentation
- 1.3. Research Objective
- 1.4. Definitions and Assumptions
- 2. Executive Summary
- 2.1. Market Snapshot
- 3. Market Dynamics
- 3.1. Market Drivers
- 3.2. Market Restrains
- 3.3. Market Trends
- 3.4. Market Opportunities
- 4. Market Factor Analysis
- 4.1. Porters Five Forces
- 4.1.1. Bargaining Power of Suppliers
- 4.1.2. Bargaining Power of Buyers
- 4.1.3. Threat of New Entrants
- 4.1.4. Threat of Substitutes
- 4.1.5. Competitive Rivalry
- 4.2. PESTEL analysis
- 4.3. BCG Analysis
- 4.3.1. Stars (High Growth, High Market Share)
- 4.3.2. Cash Cows (Low Growth, High Market Share)
- 4.3.3. Question Mark (High Growth, Low Market Share)
- 4.3.4. Dogs (Low Growth, Low Market Share)
- 4.4. Ansoff Matrix Analysis
- 4.5. Supply Chain Analysis
- 4.6. Regulatory Landscape
- 4.7. Current Market Potential and Opportunity Assessment (TAM–SAM–SOM Framework)
- 4.8. VDR Analyst Note
- 4.1. Porters Five Forces
- 5. Market Analysis, Insights and Forecast 2021-2033
- 5.1. Market Analysis, Insights and Forecast - by Application
- 5.1.1. Payment & Settlement
- 5.1.2. Product Traceability
- 5.1.3. Counterfeit Detection
- 5.1.4. Smart Contracts
- 5.1.5. Risk & Compliance Management
- 5.1.6. Other Applications
- 5.2. Market Analysis, Insights and Forecast - by Industry Vertical
- 5.2.1. Retail & Consumer Goods
- 5.2.2. Healthcare & Life Sciences
- 5.2.3. Manufacturing
- 5.2.4. Logistics, Oil & Gas
- 5.2.5. Other Industry Verticals
- 5.3. Market Analysis, Insights and Forecast - by Component
- 5.3.1. Platform
- 5.3.2. Services
- 5.4. Market Analysis, Insights and Forecast - by Region
- 5.4.1. North America
- 5.4.2. Europe
- 5.4.3. Asia
- 5.4.4. Latin America
- 5.4.5. Middle East and Africa
- 5.1. Market Analysis, Insights and Forecast - by Application
- 6. Global Blockchain Supply Chain Market Analysis, Insights and Forecast, 2021-2033
- 6.1. Market Analysis, Insights and Forecast - by Application
- 6.1.1. Payment & Settlement
- 6.1.2. Product Traceability
- 6.1.3. Counterfeit Detection
- 6.1.4. Smart Contracts
- 6.1.5. Risk & Compliance Management
- 6.1.6. Other Applications
- 6.2. Market Analysis, Insights and Forecast - by Industry Vertical
- 6.2.1. Retail & Consumer Goods
- 6.2.2. Healthcare & Life Sciences
- 6.2.3. Manufacturing
- 6.2.4. Logistics, Oil & Gas
- 6.2.5. Other Industry Verticals
- 6.3. Market Analysis, Insights and Forecast - by Component
- 6.3.1. Platform
- 6.3.2. Services
- 6.1. Market Analysis, Insights and Forecast - by Application
- 7. North America Blockchain Supply Chain Market Analysis, Insights and Forecast, 2021-2033
- 7.1. Market Analysis, Insights and Forecast - by Application
- 7.1.1. Payment & Settlement
- 7.1.2. Product Traceability
- 7.1.3. Counterfeit Detection
- 7.1.4. Smart Contracts
- 7.1.5. Risk & Compliance Management
- 7.1.6. Other Applications
- 7.2. Market Analysis, Insights and Forecast - by Industry Vertical
- 7.2.1. Retail & Consumer Goods
- 7.2.2. Healthcare & Life Sciences
- 7.2.3. Manufacturing
- 7.2.4. Logistics, Oil & Gas
- 7.2.5. Other Industry Verticals
- 7.3. Market Analysis, Insights and Forecast - by Component
- 7.3.1. Platform
- 7.3.2. Services
- 7.1. Market Analysis, Insights and Forecast - by Application
- 8. Europe Blockchain Supply Chain Market Analysis, Insights and Forecast, 2021-2033
- 8.1. Market Analysis, Insights and Forecast - by Application
- 8.1.1. Payment & Settlement
- 8.1.2. Product Traceability
- 8.1.3. Counterfeit Detection
- 8.1.4. Smart Contracts
- 8.1.5. Risk & Compliance Management
- 8.1.6. Other Applications
- 8.2. Market Analysis, Insights and Forecast - by Industry Vertical
- 8.2.1. Retail & Consumer Goods
- 8.2.2. Healthcare & Life Sciences
- 8.2.3. Manufacturing
- 8.2.4. Logistics, Oil & Gas
- 8.2.5. Other Industry Verticals
- 8.3. Market Analysis, Insights and Forecast - by Component
- 8.3.1. Platform
- 8.3.2. Services
- 8.1. Market Analysis, Insights and Forecast - by Application
- 9. Asia Blockchain Supply Chain Market Analysis, Insights and Forecast, 2021-2033
- 9.1. Market Analysis, Insights and Forecast - by Application
- 9.1.1. Payment & Settlement
- 9.1.2. Product Traceability
- 9.1.3. Counterfeit Detection
- 9.1.4. Smart Contracts
- 9.1.5. Risk & Compliance Management
- 9.1.6. Other Applications
- 9.2. Market Analysis, Insights and Forecast - by Industry Vertical
- 9.2.1. Retail & Consumer Goods
- 9.2.2. Healthcare & Life Sciences
- 9.2.3. Manufacturing
- 9.2.4. Logistics, Oil & Gas
- 9.2.5. Other Industry Verticals
- 9.3. Market Analysis, Insights and Forecast - by Component
- 9.3.1. Platform
- 9.3.2. Services
- 9.1. Market Analysis, Insights and Forecast - by Application
- 10. Latin America Blockchain Supply Chain Market Analysis, Insights and Forecast, 2021-2033
- 10.1. Market Analysis, Insights and Forecast - by Application
- 10.1.1. Payment & Settlement
- 10.1.2. Product Traceability
- 10.1.3. Counterfeit Detection
- 10.1.4. Smart Contracts
- 10.1.5. Risk & Compliance Management
- 10.1.6. Other Applications
- 10.2. Market Analysis, Insights and Forecast - by Industry Vertical
- 10.2.1. Retail & Consumer Goods
- 10.2.2. Healthcare & Life Sciences
- 10.2.3. Manufacturing
- 10.2.4. Logistics, Oil & Gas
- 10.2.5. Other Industry Verticals
- 10.3. Market Analysis, Insights and Forecast - by Component
- 10.3.1. Platform
- 10.3.2. Services
- 10.1. Market Analysis, Insights and Forecast - by Application
- 11. Middle East and Africa Blockchain Supply Chain Market Analysis, Insights and Forecast, 2021-2033
- 11.1. Market Analysis, Insights and Forecast - by Application
- 11.1.1. Payment & Settlement
- 11.1.2. Product Traceability
- 11.1.3. Counterfeit Detection
- 11.1.4. Smart Contracts
- 11.1.5. Risk & Compliance Management
- 11.1.6. Other Applications
- 11.2. Market Analysis, Insights and Forecast - by Industry Vertical
- 11.2.1. Retail & Consumer Goods
- 11.2.2. Healthcare & Life Sciences
- 11.2.3. Manufacturing
- 11.2.4. Logistics, Oil & Gas
- 11.2.5. Other Industry Verticals
- 11.3. Market Analysis, Insights and Forecast - by Component
- 11.3.1. Platform
- 11.3.2. Services
- 11.1. Market Analysis, Insights and Forecast - by Application
- 12. Competitive Analysis
- 12.1. Company Profiles
- 12.1.1 Digital Treasury Corporatio
- 12.1.1.1. Company Overview
- 12.1.1.2. Products
- 12.1.1.3. Company Financials
- 12.1.1.4. SWOT Analysis
- 12.1.2 Accenture PLC
- 12.1.2.1. Company Overview
- 12.1.2.2. Products
- 12.1.2.3. Company Financials
- 12.1.2.4. SWOT Analysis
- 12.1.3 Bitfury Group Limited
- 12.1.3.1. Company Overview
- 12.1.3.2. Products
- 12.1.3.3. Company Financials
- 12.1.3.4. SWOT Analysis
- 12.1.4 BTL Group
- 12.1.4.1. Company Overview
- 12.1.4.2. Products
- 12.1.4.3. Company Financials
- 12.1.4.4. SWOT Analysis
- 12.1.5 TIBCO Software Inc
- 12.1.5.1. Company Overview
- 12.1.5.2. Products
- 12.1.5.3. Company Financials
- 12.1.5.4. SWOT Analysis
- 12.1.6 IBM Corporation
- 12.1.6.1. Company Overview
- 12.1.6.2. Products
- 12.1.6.3. Company Financials
- 12.1.6.4. SWOT Analysis
- 12.1.7 Microsoft Corporation
- 12.1.7.1. Company Overview
- 12.1.7.2. Products
- 12.1.7.3. Company Financials
- 12.1.7.4. SWOT Analysis
- 12.1.8 Amazon Web Services Inc
- 12.1.8.1. Company Overview
- 12.1.8.2. Products
- 12.1.8.3. Company Financials
- 12.1.8.4. SWOT Analysis
- 12.1.9 Huawei Technologies Co Ltd
- 12.1.9.1. Company Overview
- 12.1.9.2. Products
- 12.1.9.3. Company Financials
- 12.1.9.4. SWOT Analysis
- 12.1.10 Oracle Corporation
- 12.1.10.1. Company Overview
- 12.1.10.2. Products
- 12.1.10.3. Company Financials
- 12.1.10.4. SWOT Analysis
- 12.1.11 VeChain Foundation
- 12.1.11.1. Company Overview
- 12.1.11.2. Products
- 12.1.11.3. Company Financials
- 12.1.11.4. SWOT Analysis
- 12.1.12 Omnichain Inc
- 12.1.12.1. Company Overview
- 12.1.12.2. Products
- 12.1.12.3. Company Financials
- 12.1.12.4. SWOT Analysis
- 12.1.13 Guardtime Inc
- 12.1.13.1. Company Overview
- 12.1.13.2. Products
- 12.1.13.3. Company Financials
- 12.1.13.4. SWOT Analysis
- 12.1.14 Auxesis Group
- 12.1.14.1. Company Overview
- 12.1.14.2. Products
- 12.1.14.3. Company Financials
- 12.1.14.4. SWOT Analysis
- 12.1.15 SAP SE
- 12.1.15.1. Company Overview
- 12.1.15.2. Products
- 12.1.15.3. Company Financials
- 12.1.15.4. SWOT Analysis
- 12.1.1 Digital Treasury Corporatio
- 12.2. Market Entropy
- 12.2.1 Company's Key Areas Served
- 12.2.2 Recent Developments
- 12.3. Company Market Share Analysis 2025
- 12.3.1 Top 5 Companies Market Share Analysis
- 12.3.2 Top 3 Companies Market Share Analysis
- 12.4. List of Potential Customers
- 13. Research Methodology
List of Figures
- Figure 1: Global Blockchain Supply Chain Market Revenue Breakdown (Million, %) by Region 2025 & 2033
- Figure 2: North America Blockchain Supply Chain Market Revenue (Million), by Application 2025 & 2033
- Figure 3: North America Blockchain Supply Chain Market Revenue Share (%), by Application 2025 & 2033
- Figure 4: North America Blockchain Supply Chain Market Revenue (Million), by Industry Vertical 2025 & 2033
- Figure 5: North America Blockchain Supply Chain Market Revenue Share (%), by Industry Vertical 2025 & 2033
- Figure 6: North America Blockchain Supply Chain Market Revenue (Million), by Component 2025 & 2033
- Figure 7: North America Blockchain Supply Chain Market Revenue Share (%), by Component 2025 & 2033
- Figure 8: North America Blockchain Supply Chain Market Revenue (Million), by Country 2025 & 2033
- Figure 9: North America Blockchain Supply Chain Market Revenue Share (%), by Country 2025 & 2033
- Figure 10: Europe Blockchain Supply Chain Market Revenue (Million), by Application 2025 & 2033
- Figure 11: Europe Blockchain Supply Chain Market Revenue Share (%), by Application 2025 & 2033
- Figure 12: Europe Blockchain Supply Chain Market Revenue (Million), by Industry Vertical 2025 & 2033
- Figure 13: Europe Blockchain Supply Chain Market Revenue Share (%), by Industry Vertical 2025 & 2033
- Figure 14: Europe Blockchain Supply Chain Market Revenue (Million), by Component 2025 & 2033
- Figure 15: Europe Blockchain Supply Chain Market Revenue Share (%), by Component 2025 & 2033
- Figure 16: Europe Blockchain Supply Chain Market Revenue (Million), by Country 2025 & 2033
- Figure 17: Europe Blockchain Supply Chain Market Revenue Share (%), by Country 2025 & 2033
- Figure 18: Asia Blockchain Supply Chain Market Revenue (Million), by Application 2025 & 2033
- Figure 19: Asia Blockchain Supply Chain Market Revenue Share (%), by Application 2025 & 2033
- Figure 20: Asia Blockchain Supply Chain Market Revenue (Million), by Industry Vertical 2025 & 2033
- Figure 21: Asia Blockchain Supply Chain Market Revenue Share (%), by Industry Vertical 2025 & 2033
- Figure 22: Asia Blockchain Supply Chain Market Revenue (Million), by Component 2025 & 2033
- Figure 23: Asia Blockchain Supply Chain Market Revenue Share (%), by Component 2025 & 2033
- Figure 24: Asia Blockchain Supply Chain Market Revenue (Million), by Country 2025 & 2033
- Figure 25: Asia Blockchain Supply Chain Market Revenue Share (%), by Country 2025 & 2033
- Figure 26: Latin America Blockchain Supply Chain Market Revenue (Million), by Application 2025 & 2033
- Figure 27: Latin America Blockchain Supply Chain Market Revenue Share (%), by Application 2025 & 2033
- Figure 28: Latin America Blockchain Supply Chain Market Revenue (Million), by Industry Vertical 2025 & 2033
- Figure 29: Latin America Blockchain Supply Chain Market Revenue Share (%), by Industry Vertical 2025 & 2033
- Figure 30: Latin America Blockchain Supply Chain Market Revenue (Million), by Component 2025 & 2033
- Figure 31: Latin America Blockchain Supply Chain Market Revenue Share (%), by Component 2025 & 2033
- Figure 32: Latin America Blockchain Supply Chain Market Revenue (Million), by Country 2025 & 2033
- Figure 33: Latin America Blockchain Supply Chain Market Revenue Share (%), by Country 2025 & 2033
- Figure 34: Middle East and Africa Blockchain Supply Chain Market Revenue (Million), by Application 2025 & 2033
- Figure 35: Middle East and Africa Blockchain Supply Chain Market Revenue Share (%), by Application 2025 & 2033
- Figure 36: Middle East and Africa Blockchain Supply Chain Market Revenue (Million), by Industry Vertical 2025 & 2033
- Figure 37: Middle East and Africa Blockchain Supply Chain Market Revenue Share (%), by Industry Vertical 2025 & 2033
- Figure 38: Middle East and Africa Blockchain Supply Chain Market Revenue (Million), by Component 2025 & 2033
- Figure 39: Middle East and Africa Blockchain Supply Chain Market Revenue Share (%), by Component 2025 & 2033
- Figure 40: Middle East and Africa Blockchain Supply Chain Market Revenue (Million), by Country 2025 & 2033
- Figure 41: Middle East and Africa Blockchain Supply Chain Market Revenue Share (%), by Country 2025 & 2033
List of Tables
- Table 1: Global Blockchain Supply Chain Market Revenue Million Forecast, by Application 2020 & 2033
- Table 2: Global Blockchain Supply Chain Market Revenue Million Forecast, by Industry Vertical 2020 & 2033
- Table 3: Global Blockchain Supply Chain Market Revenue Million Forecast, by Component 2020 & 2033
- Table 4: Global Blockchain Supply Chain Market Revenue Million Forecast, by Region 2020 & 2033
- Table 5: Global Blockchain Supply Chain Market Revenue Million Forecast, by Application 2020 & 2033
- Table 6: Global Blockchain Supply Chain Market Revenue Million Forecast, by Industry Vertical 2020 & 2033
- Table 7: Global Blockchain Supply Chain Market Revenue Million Forecast, by Component 2020 & 2033
- Table 8: Global Blockchain Supply Chain Market Revenue Million Forecast, by Country 2020 & 2033
- Table 9: United States Blockchain Supply Chain Market Revenue (Million) Forecast, by Application 2020 & 2033
- Table 10: Canada Blockchain Supply Chain Market Revenue (Million) Forecast, by Application 2020 & 2033
- Table 11: Global Blockchain Supply Chain Market Revenue Million Forecast, by Application 2020 & 2033
- Table 12: Global Blockchain Supply Chain Market Revenue Million Forecast, by Industry Vertical 2020 & 2033
- Table 13: Global Blockchain Supply Chain Market Revenue Million Forecast, by Component 2020 & 2033
- Table 14: Global Blockchain Supply Chain Market Revenue Million Forecast, by Country 2020 & 2033
- Table 15: Germany Blockchain Supply Chain Market Revenue (Million) Forecast, by Application 2020 & 2033
- Table 16: United Kingdom Blockchain Supply Chain Market Revenue (Million) Forecast, by Application 2020 & 2033
- Table 17: France Blockchain Supply Chain Market Revenue (Million) Forecast, by Application 2020 & 2033
- Table 18: Spain Blockchain Supply Chain Market Revenue (Million) Forecast, by Application 2020 & 2033
- Table 19: Global Blockchain Supply Chain Market Revenue Million Forecast, by Application 2020 & 2033
- Table 20: Global Blockchain Supply Chain Market Revenue Million Forecast, by Industry Vertical 2020 & 2033
- Table 21: Global Blockchain Supply Chain Market Revenue Million Forecast, by Component 2020 & 2033
- Table 22: Global Blockchain Supply Chain Market Revenue Million Forecast, by Country 2020 & 2033
- Table 23: China Blockchain Supply Chain Market Revenue (Million) Forecast, by Application 2020 & 2033
- Table 24: Japan Blockchain Supply Chain Market Revenue (Million) Forecast, by Application 2020 & 2033
- Table 25: India Blockchain Supply Chain Market Revenue (Million) Forecast, by Application 2020 & 2033
- Table 26: Australia Blockchain Supply Chain Market Revenue (Million) Forecast, by Application 2020 & 2033
- Table 27: Global Blockchain Supply Chain Market Revenue Million Forecast, by Application 2020 & 2033
- Table 28: Global Blockchain Supply Chain Market Revenue Million Forecast, by Industry Vertical 2020 & 2033
- Table 29: Global Blockchain Supply Chain Market Revenue Million Forecast, by Component 2020 & 2033
- Table 30: Global Blockchain Supply Chain Market Revenue Million Forecast, by Country 2020 & 2033
- Table 31: Brazil Blockchain Supply Chain Market Revenue (Million) Forecast, by Application 2020 & 2033
- Table 32: Mexico Blockchain Supply Chain Market Revenue (Million) Forecast, by Application 2020 & 2033
- Table 33: Argentina Blockchain Supply Chain Market Revenue (Million) Forecast, by Application 2020 & 2033
- Table 34: Global Blockchain Supply Chain Market Revenue Million Forecast, by Application 2020 & 2033
- Table 35: Global Blockchain Supply Chain Market Revenue Million Forecast, by Industry Vertical 2020 & 2033
- Table 36: Global Blockchain Supply Chain Market Revenue Million Forecast, by Component 2020 & 2033
- Table 37: Global Blockchain Supply Chain Market Revenue Million Forecast, by Country 2020 & 2033
- Table 38: United Arab Emirates Blockchain Supply Chain Market Revenue (Million) Forecast, by Application 2020 & 2033
- Table 39: Saudi Arabia Blockchain Supply Chain Market Revenue (Million) Forecast, by Application 2020 & 2033
- Table 40: South Africa Blockchain Supply Chain Market Revenue (Million) Forecast, by Application 2020 & 2033
Frequently Asked Questions
1. What is the projected Compound Annual Growth Rate (CAGR) of the Blockchain Supply Chain Market?
The projected CAGR is approximately 49.87%.
2. Which companies are prominent players in the Blockchain Supply Chain Market?
Key companies in the market include Digital Treasury Corporatio, Accenture PLC, Bitfury Group Limited, BTL Group, TIBCO Software Inc, IBM Corporation, Microsoft Corporation, Amazon Web Services Inc, Huawei Technologies Co Ltd, Oracle Corporation, VeChain Foundation, Omnichain Inc, Guardtime Inc, Auxesis Group, SAP SE.
3. What are the main segments of the Blockchain Supply Chain Market?
The market segments include Application , Industry Vertical , Component.
4. Can you provide details about the market size?
The market size is estimated to be USD 0.84 Million as of 2022.
5. What are some drivers contributing to market growth?
Augmented Demand for Improved Security of Supply Chain Transactions; Growing Requirement for Supply Chain Transparency; Rising use of Blockchain in Retail & Consumer Goods sector.
6. What are the notable trends driving market growth?
Retail & Consumer Goods to Dominate the Market.
7. Are there any restraints impacting market growth?
Absence of Awareness of the Blockchain Technology.
8. Can you provide examples of recent developments in the market?
November 2023, MY E.G. Service’s blockchain unit in Malaysia, Zetrix, made an announcement regarding the commencement of an initial project to offer supply chain bankrolling products in conjunction with Chinese banks for international importers in addition to exporters.
9. What pricing options are available for accessing the report?
Pricing options include single-user, multi-user, and enterprise licenses priced at USD 4750, USD 5250, and USD 8750 respectively.
10. Is the market size provided in terms of value or volume?
The market size is provided in terms of value, measured in Million.
11. Are there any specific market keywords associated with the report?
Yes, the market keyword associated with the report is "Blockchain Supply Chain Market," which aids in identifying and referencing the specific market segment covered.
12. How do I determine which pricing option suits my needs best?
The pricing options vary based on user requirements and access needs. Individual users may opt for single-user licenses, while businesses requiring broader access may choose multi-user or enterprise licenses for cost-effective access to the report.
13. Are there any additional resources or data provided in the Blockchain Supply Chain Market report?
While the report offers comprehensive insights, it's advisable to review the specific contents or supplementary materials provided to ascertain if additional resources or data are available.
14. How can I stay updated on further developments or reports in the Blockchain Supply Chain Market?
To stay informed about further developments, trends, and reports in the Blockchain Supply Chain Market, consider subscribing to industry newsletters, following relevant companies and organizations, or regularly checking reputable industry news sources and publications.
Methodology
Step 1 - Identification of Relevant Samples Size from Population Database


Step 2 - Approaches for Defining Global Market Size (Value, Volume* & Price*)

Note*: In applicable scenarios
Step 3 - Data Sources
Primary Research
- Web Analytics
- Survey Reports
- Research Institute
- Latest Research Reports
- Opinion Leaders
Secondary Research
- Annual Reports
- White Paper
- Latest Press Release
- Industry Association
- Paid Database
- Investor Presentations

Step 4 - Data Triangulation
Involves using different sources of information in order to increase the validity of a study
These sources are likely to be stakeholders in a program - participants, other researchers, program staff, other community members, and so on.
Then we put all data in single framework & apply various statistical tools to find out the dynamic on the market.
During the analysis stage, feedback from the stakeholder groups would be compared to determine areas of agreement as well as areas of divergence