

Key Insights
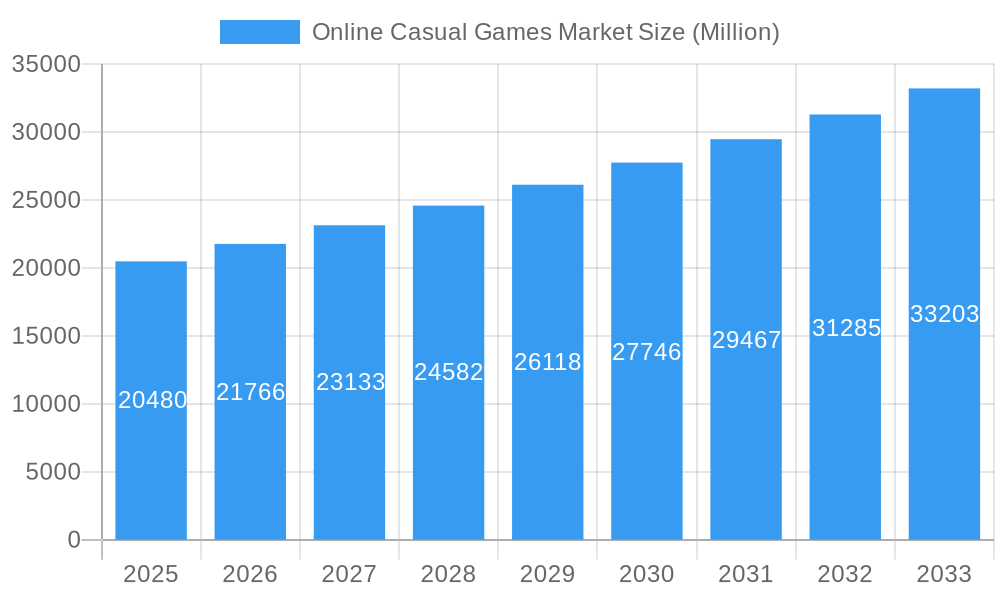
The online casual games market is experiencing robust growth, projected to reach \$20.48 billion in 2025 and maintain a Compound Annual Growth Rate (CAGR) of 6.12% from 2025 to 2033. This expansion is fueled by several key drivers. The increasing accessibility of smartphones and mobile internet, coupled with the inherently engaging nature of casual games, contributes significantly to market expansion. Furthermore, the rise of free-to-play models with in-app purchases as a monetization strategy has broadened the player base and revenue streams. The integration of social features and competitive elements within these games further enhances user engagement and retention, driving sustained growth. While market penetration is already high in developed regions like North America and Europe, significant growth potential remains in rapidly developing economies of Asia-Pacific and Latin America, where smartphone adoption continues to accelerate. The industry is also witnessing a trend towards hyper-casual games characterized by their simple mechanics and easy accessibility, further widening the appeal to a broader demographic.
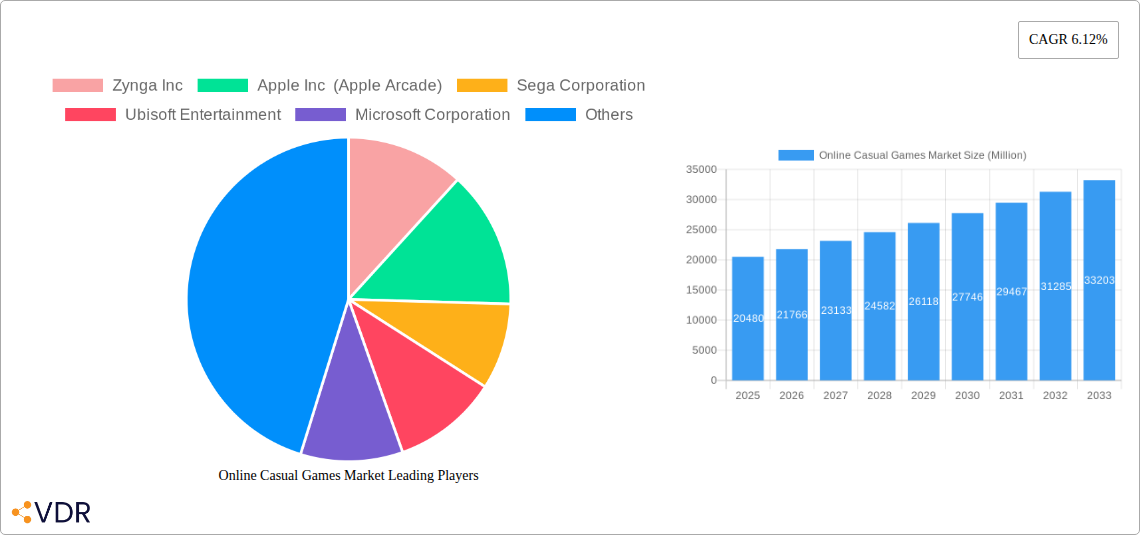
Online Casual Games Market Market Size (In Billion)
However, the market faces challenges. Increasing competition among established players and new entrants requires continuous innovation in game design and monetization strategies. Furthermore, fluctuations in user engagement and potential regulation regarding in-app purchases and advertising practices can influence market performance. The market segmentation by type (advertising, in-app purchases, paid apps) highlights the diversification of revenue models and suggests ongoing evolution in player preferences and spending habits. Leading companies such as Zynga, Tencent, and Nintendo are at the forefront of this evolution, constantly adapting to changing consumer demands and technological advancements. The continued success of the online casual games market hinges on its ability to innovate, engage players, and adapt to emerging trends within the gaming landscape.
Online Casual Games Market Company Market Share
Online Casual Games Market: A Comprehensive Market Report (2019-2033)
This comprehensive report provides a detailed analysis of the Online Casual Games market, encompassing market dynamics, growth trends, regional dominance, product landscape, key players, and future outlook. The study period covers 2019-2033, with a base year of 2025 and a forecast period of 2025-2033. The report segments the market by type: Advertising, In-app Purchase, and Paid App, providing granular insights into each segment's performance and future potential. The parent market is the broader gaming industry, while the child market focuses specifically on online casual games accessible through various platforms. The market value is presented in million units.
Estimated Market Size in 2025: xx Million
Online Casual Games Market Market Dynamics & Structure
The online casual games market is characterized by high competition, rapid technological advancements, and evolving regulatory landscapes. Market concentration is moderate, with a few large players holding significant shares, but a multitude of smaller independent developers also contributing significantly. Technological innovation, particularly in areas like AI and improved graphics, acts as a key driver, constantly pushing the boundaries of gameplay and user experience. Regulatory frameworks, varying across different geographies, impact monetization strategies and data privacy. The emergence of subscription models and cloud gaming platforms presents both opportunities and challenges. Substitutes include other forms of entertainment like social media and streaming services. The end-user demographic is diverse, spanning across age groups and geographic locations, though certain demographics show higher engagement levels. Mergers and acquisitions (M&A) activity is frequent, with larger companies acquiring smaller studios to expand their portfolios and technological capabilities.
- Market Concentration: Moderate, with xx% market share held by the top 5 players in 2025.
- Technological Innovation: AI integration, improved graphics, and cloud gaming are major drivers.
- Regulatory Frameworks: Varying data privacy regulations and monetization policies across regions.
- Competitive Substitutes: Social media, streaming services, and other forms of entertainment.
- End-User Demographics: Broad appeal, with significant engagement from specific age groups and regions.
- M&A Activity: High level of activity, with xx deals recorded between 2019-2024.
Online Casual Games Market Growth Trends & Insights
The online casual games market has experienced substantial growth over the historical period (2019-2024), driven by increased smartphone penetration, improved internet access, and the rising popularity of free-to-play models. The market size has grown from xx million units in 2019 to xx million units in 2024, exhibiting a CAGR of xx%. This growth is expected to continue throughout the forecast period (2025-2033), although at a potentially slower pace due to market saturation in certain regions. Technological disruptions, such as the rise of cloud gaming and the increasing adoption of cross-platform play, are reshaping consumer behavior and creating new opportunities. Consumers are increasingly demanding high-quality graphics, innovative gameplay, and seamless cross-device experiences. The shift towards mobile gaming remains a significant trend, with mobile platforms dominating the market share.
Dominant Regions, Countries, or Segments in Online Casual Games Market
North America and Asia currently dominate the online casual games market, driven by high smartphone penetration, robust internet infrastructure, and a large consumer base with high disposable income. Within these regions, specific countries like the United States, China, and Japan show exceptionally strong growth. The "In-app Purchase" segment currently holds the largest market share, demonstrating the effectiveness of this monetization model. The growth of this segment is further fueled by increasingly sophisticated in-game economies and user engagement strategies.
- North America: High disposable income, advanced technology infrastructure, and established gaming culture.
- Asia: Huge population base, rapidly growing smartphone penetration, and strong mobile gaming culture.
- In-app Purchase: Dominant monetization model, with increasing sophistication in in-game economies.
- Paid App: Shows steady growth, driven by high-quality and engaging single purchases.
- Advertising: Continues to be a viable monetization channel, adapting to new ad formats and targeting strategies.
Online Casual Games Market Product Landscape
The online casual games market showcases a diverse range of products, from simple puzzle games to complex strategy titles. Key features include intuitive gameplay, visually appealing graphics, and social elements that foster engagement and encourage repeat play. Many games incorporate in-app purchase mechanics to drive monetization. Technological advancements continuously push the boundaries, such as the integration of augmented reality (AR) and virtual reality (VR) features. Unique selling propositions (USPs) often involve novel gameplay mechanics or innovative social features.
Key Drivers, Barriers & Challenges in Online Casual Games Market
Key Drivers:
- Increasing smartphone penetration and internet accessibility.
- Growing popularity of free-to-play models and in-app purchases.
- Advancements in game design and technology, such as AI and AR/VR.
- Rise of esports and competitive gaming.
Challenges and Restraints:
- Intense competition among developers and publishers.
- Stricter regulations regarding data privacy and in-app purchases.
- Potential market saturation in certain regions.
- Dependence on monetization strategies that may affect user experience.
Emerging Opportunities in Online Casual Games Market
- Expansion into untapped markets: Emerging economies in Africa and Latin America hold significant potential.
- Innovative applications: Integration of AR/VR, blockchain, and metaverse technologies offers new opportunities.
- Evolving consumer preferences: Catering to diverse demographics and gaming styles is crucial.
Growth Accelerators in the Online Casual Games Market Industry
Technological breakthroughs, strategic partnerships, and expansion into new markets are key growth accelerators. The increasing sophistication of game design, coupled with advancements in mobile technology, creates a positive feedback loop of growth. Strategic alliances between game developers and technology companies can lead to innovation and wider market reach. Finally, exploring new and untapped markets provides additional avenues for growth.
Key Players Shaping the Online Casual Games Market Market
- Zynga Inc
- Apple Inc (Apple Arcade)
- Sega Corporation
- Ubisoft Entertainment
- Microsoft Corporation
- Betsson AB
- Beijing Kunlun Tech Co Ltd
- Tencent Holdings Ltd
- Konami Digital Entertainment
- Nintendo Co Ltd
- Sony Corporation
- Bandai Namco Entertainment Inc
Notable Milestones in Online Casual Games Market Sector
- February 2022: Ubisoft expands its La Forge R&D model globally, enhancing AI and machine learning capabilities in game development.
- March 2022: Netflix acquires Boss Fight Entertainment, expanding its presence in the gaming industry.
In-Depth Online Casual Games Market Market Outlook
The online casual games market is poised for continued growth, driven by technological innovation and evolving consumer preferences. Strategic partnerships and expansion into new markets will further accelerate this growth. The increasing integration of diverse technologies like AR/VR, cloud gaming, and blockchain will create new opportunities for developers and publishers alike. The market offers substantial potential for players who can adapt to shifting consumer demands and leverage technological advancements.
Online Casual Games Market Segmentation
-
1. Type
- 1.1. Advertising
- 1.2. In-app Purchase
- 1.3. Paid App
Online Casual Games Market Segmentation By Geography
-
1. North America
- 1.1. United States
- 1.2. Canada
-
2. Europe
- 2.1. United Kingdom
- 2.2. France
- 2.3. Germany
- 2.4. Rest of Europe
-
3. Asia Pacific
- 3.1. China
- 3.2. India
- 3.3. Japan
- 3.4. Rest of Asia Pacific
- 4. Latin America
- 5. Middle East and Africa
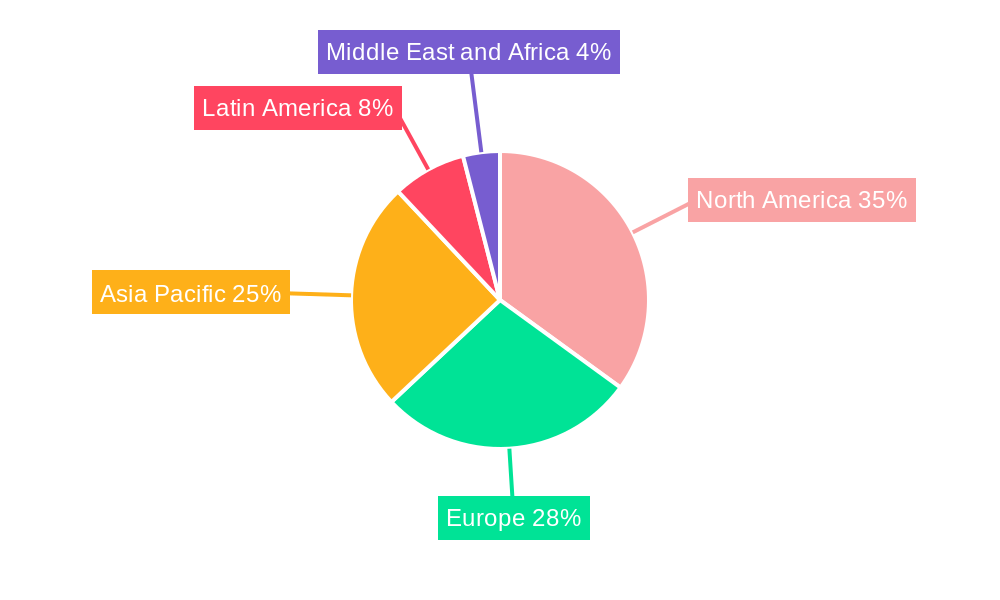
Online Casual Games Market Regional Market Share
Geographic Coverage of Online Casual Games Market
Online Casual Games Market REPORT HIGHLIGHTS
| Aspects | Details |
|---|---|
| Study Period | 2020-2034 |
| Base Year | 2025 |
| Estimated Year | 2026 |
| Forecast Period | 2026-2034 |
| Historical Period | 2020-2025 |
| Growth Rate | CAGR of 6.12% from 2020-2034 |
| Segmentation |
|
Table of Contents
- 1. Introduction
- 1.1. Research Scope
- 1.2. Market Segmentation
- 1.3. Research Objective
- 1.4. Definitions and Assumptions
- 2. Executive Summary
- 2.1. Market Snapshot
- 3. Market Dynamics
- 3.1. Market Drivers
- 3.2. Market Restrains
- 3.3. Market Trends
- 3.4. Market Opportunities
- 4. Market Factor Analysis
- 4.1. Porters Five Forces
- 4.1.1. Bargaining Power of Suppliers
- 4.1.2. Bargaining Power of Buyers
- 4.1.3. Threat of New Entrants
- 4.1.4. Threat of Substitutes
- 4.1.5. Competitive Rivalry
- 4.2. PESTEL analysis
- 4.3. BCG Analysis
- 4.3.1. Stars (High Growth, High Market Share)
- 4.3.2. Cash Cows (Low Growth, High Market Share)
- 4.3.3. Question Mark (High Growth, Low Market Share)
- 4.3.4. Dogs (Low Growth, Low Market Share)
- 4.4. Ansoff Matrix Analysis
- 4.5. Supply Chain Analysis
- 4.6. Regulatory Landscape
- 4.7. Current Market Potential and Opportunity Assessment (TAM–SAM–SOM Framework)
- 4.8. VDR Analyst Note
- 4.1. Porters Five Forces
- 5. Market Analysis, Insights and Forecast 2021-2033
- 5.1. Market Analysis, Insights and Forecast - by Type
- 5.1.1. Advertising
- 5.1.2. In-app Purchase
- 5.1.3. Paid App
- 5.2. Market Analysis, Insights and Forecast - by Region
- 5.2.1. North America
- 5.2.2. Europe
- 5.2.3. Asia Pacific
- 5.2.4. Latin America
- 5.2.5. Middle East and Africa
- 5.1. Market Analysis, Insights and Forecast - by Type
- 6. Global Online Casual Games Market Analysis, Insights and Forecast, 2021-2033
- 6.1. Market Analysis, Insights and Forecast - by Type
- 6.1.1. Advertising
- 6.1.2. In-app Purchase
- 6.1.3. Paid App
- 6.1. Market Analysis, Insights and Forecast - by Type
- 7. North America Online Casual Games Market Analysis, Insights and Forecast, 2021-2033
- 7.1. Market Analysis, Insights and Forecast - by Type
- 7.1.1. Advertising
- 7.1.2. In-app Purchase
- 7.1.3. Paid App
- 7.1. Market Analysis, Insights and Forecast - by Type
- 8. Europe Online Casual Games Market Analysis, Insights and Forecast, 2021-2033
- 8.1. Market Analysis, Insights and Forecast - by Type
- 8.1.1. Advertising
- 8.1.2. In-app Purchase
- 8.1.3. Paid App
- 8.1. Market Analysis, Insights and Forecast - by Type
- 9. Asia Pacific Online Casual Games Market Analysis, Insights and Forecast, 2021-2033
- 9.1. Market Analysis, Insights and Forecast - by Type
- 9.1.1. Advertising
- 9.1.2. In-app Purchase
- 9.1.3. Paid App
- 9.1. Market Analysis, Insights and Forecast - by Type
- 10. Latin America Online Casual Games Market Analysis, Insights and Forecast, 2021-2033
- 10.1. Market Analysis, Insights and Forecast - by Type
- 10.1.1. Advertising
- 10.1.2. In-app Purchase
- 10.1.3. Paid App
- 10.1. Market Analysis, Insights and Forecast - by Type
- 11. Middle East and Africa Online Casual Games Market Analysis, Insights and Forecast, 2021-2033
- 11.1. Market Analysis, Insights and Forecast - by Type
- 11.1.1. Advertising
- 11.1.2. In-app Purchase
- 11.1.3. Paid App
- 11.1. Market Analysis, Insights and Forecast - by Type
- 12. Competitive Analysis
- 12.1. Company Profiles
- 12.1.1 Zynga Inc
- 12.1.1.1. Company Overview
- 12.1.1.2. Products
- 12.1.1.3. Company Financials
- 12.1.1.4. SWOT Analysis
- 12.1.2 Apple Inc (Apple Arcade)
- 12.1.2.1. Company Overview
- 12.1.2.2. Products
- 12.1.2.3. Company Financials
- 12.1.2.4. SWOT Analysis
- 12.1.3 Sega Corporation
- 12.1.3.1. Company Overview
- 12.1.3.2. Products
- 12.1.3.3. Company Financials
- 12.1.3.4. SWOT Analysis
- 12.1.4 Ubisoft Entertainment
- 12.1.4.1. Company Overview
- 12.1.4.2. Products
- 12.1.4.3. Company Financials
- 12.1.4.4. SWOT Analysis
- 12.1.5 Microsoft Corporation
- 12.1.5.1. Company Overview
- 12.1.5.2. Products
- 12.1.5.3. Company Financials
- 12.1.5.4. SWOT Analysis
- 12.1.6 Betsson AB
- 12.1.6.1. Company Overview
- 12.1.6.2. Products
- 12.1.6.3. Company Financials
- 12.1.6.4. SWOT Analysis
- 12.1.7 Beijing Kunlun Tech Co Ltd*List Not Exhaustive
- 12.1.7.1. Company Overview
- 12.1.7.2. Products
- 12.1.7.3. Company Financials
- 12.1.7.4. SWOT Analysis
- 12.1.8 Tencent Holdings Ltd
- 12.1.8.1. Company Overview
- 12.1.8.2. Products
- 12.1.8.3. Company Financials
- 12.1.8.4. SWOT Analysis
- 12.1.9 Konami Digital Entertainment
- 12.1.9.1. Company Overview
- 12.1.9.2. Products
- 12.1.9.3. Company Financials
- 12.1.9.4. SWOT Analysis
- 12.1.10 Nintendo Co Ltd
- 12.1.10.1. Company Overview
- 12.1.10.2. Products
- 12.1.10.3. Company Financials
- 12.1.10.4. SWOT Analysis
- 12.1.11 Sony Corporation
- 12.1.11.1. Company Overview
- 12.1.11.2. Products
- 12.1.11.3. Company Financials
- 12.1.11.4. SWOT Analysis
- 12.1.12 Bandai Namco Entertainment Inc
- 12.1.12.1. Company Overview
- 12.1.12.2. Products
- 12.1.12.3. Company Financials
- 12.1.12.4. SWOT Analysis
- 12.1.1 Zynga Inc
- 12.2. Market Entropy
- 12.2.1 Company's Key Areas Served
- 12.2.2 Recent Developments
- 12.3. Company Market Share Analysis 2025
- 12.3.1 Top 5 Companies Market Share Analysis
- 12.3.2 Top 3 Companies Market Share Analysis
- 12.4. List of Potential Customers
- 13. Research Methodology
List of Figures
- Figure 1: Global Online Casual Games Market Revenue Breakdown (Million, %) by Region 2025 & 2033
- Figure 2: North America Online Casual Games Market Revenue (Million), by Type 2025 & 2033
- Figure 3: North America Online Casual Games Market Revenue Share (%), by Type 2025 & 2033
- Figure 4: North America Online Casual Games Market Revenue (Million), by Country 2025 & 2033
- Figure 5: North America Online Casual Games Market Revenue Share (%), by Country 2025 & 2033
- Figure 6: Europe Online Casual Games Market Revenue (Million), by Type 2025 & 2033
- Figure 7: Europe Online Casual Games Market Revenue Share (%), by Type 2025 & 2033
- Figure 8: Europe Online Casual Games Market Revenue (Million), by Country 2025 & 2033
- Figure 9: Europe Online Casual Games Market Revenue Share (%), by Country 2025 & 2033
- Figure 10: Asia Pacific Online Casual Games Market Revenue (Million), by Type 2025 & 2033
- Figure 11: Asia Pacific Online Casual Games Market Revenue Share (%), by Type 2025 & 2033
- Figure 12: Asia Pacific Online Casual Games Market Revenue (Million), by Country 2025 & 2033
- Figure 13: Asia Pacific Online Casual Games Market Revenue Share (%), by Country 2025 & 2033
- Figure 14: Latin America Online Casual Games Market Revenue (Million), by Type 2025 & 2033
- Figure 15: Latin America Online Casual Games Market Revenue Share (%), by Type 2025 & 2033
- Figure 16: Latin America Online Casual Games Market Revenue (Million), by Country 2025 & 2033
- Figure 17: Latin America Online Casual Games Market Revenue Share (%), by Country 2025 & 2033
- Figure 18: Middle East and Africa Online Casual Games Market Revenue (Million), by Type 2025 & 2033
- Figure 19: Middle East and Africa Online Casual Games Market Revenue Share (%), by Type 2025 & 2033
- Figure 20: Middle East and Africa Online Casual Games Market Revenue (Million), by Country 2025 & 2033
- Figure 21: Middle East and Africa Online Casual Games Market Revenue Share (%), by Country 2025 & 2033
List of Tables
- Table 1: Global Online Casual Games Market Revenue Million Forecast, by Type 2020 & 2033
- Table 2: Global Online Casual Games Market Revenue Million Forecast, by Region 2020 & 2033
- Table 3: Global Online Casual Games Market Revenue Million Forecast, by Type 2020 & 2033
- Table 4: Global Online Casual Games Market Revenue Million Forecast, by Country 2020 & 2033
- Table 5: United States Online Casual Games Market Revenue (Million) Forecast, by Application 2020 & 2033
- Table 6: Canada Online Casual Games Market Revenue (Million) Forecast, by Application 2020 & 2033
- Table 7: Global Online Casual Games Market Revenue Million Forecast, by Type 2020 & 2033
- Table 8: Global Online Casual Games Market Revenue Million Forecast, by Country 2020 & 2033
- Table 9: United Kingdom Online Casual Games Market Revenue (Million) Forecast, by Application 2020 & 2033
- Table 10: France Online Casual Games Market Revenue (Million) Forecast, by Application 2020 & 2033
- Table 11: Germany Online Casual Games Market Revenue (Million) Forecast, by Application 2020 & 2033
- Table 12: Rest of Europe Online Casual Games Market Revenue (Million) Forecast, by Application 2020 & 2033
- Table 13: Global Online Casual Games Market Revenue Million Forecast, by Type 2020 & 2033
- Table 14: Global Online Casual Games Market Revenue Million Forecast, by Country 2020 & 2033
- Table 15: China Online Casual Games Market Revenue (Million) Forecast, by Application 2020 & 2033
- Table 16: India Online Casual Games Market Revenue (Million) Forecast, by Application 2020 & 2033
- Table 17: Japan Online Casual Games Market Revenue (Million) Forecast, by Application 2020 & 2033
- Table 18: Rest of Asia Pacific Online Casual Games Market Revenue (Million) Forecast, by Application 2020 & 2033
- Table 19: Global Online Casual Games Market Revenue Million Forecast, by Type 2020 & 2033
- Table 20: Global Online Casual Games Market Revenue Million Forecast, by Country 2020 & 2033
- Table 21: Global Online Casual Games Market Revenue Million Forecast, by Type 2020 & 2033
- Table 22: Global Online Casual Games Market Revenue Million Forecast, by Country 2020 & 2033
Frequently Asked Questions
1. What is the projected Compound Annual Growth Rate (CAGR) of the Online Casual Games Market?
The projected CAGR is approximately 6.12%.
2. Which companies are prominent players in the Online Casual Games Market?
Key companies in the market include Zynga Inc, Apple Inc (Apple Arcade), Sega Corporation, Ubisoft Entertainment, Microsoft Corporation, Betsson AB, Beijing Kunlun Tech Co Ltd*List Not Exhaustive, Tencent Holdings Ltd, Konami Digital Entertainment, Nintendo Co Ltd, Sony Corporation, Bandai Namco Entertainment Inc.
3. What are the main segments of the Online Casual Games Market?
The market segments include Type.
4. Can you provide details about the market size?
The market size is estimated to be USD 20.48 Million as of 2022.
5. What are some drivers contributing to market growth?
The Increasing Penetration of Internet and Smartphones Boosted the Demand for the Online Casual Games Market; Rising Popularity of Cloud Gaming Encouraging the Expansion of the Gaming Industry.
6. What are the notable trends driving market growth?
The Increasing Penetration of Internet and Smartphones Boosted the Demand for the Online Casual Games Market.
7. Are there any restraints impacting market growth?
Uncertain Regulatory Standards and Frameworks.
8. Can you provide examples of recent developments in the market?
February 2022: Ubisoft announced the expansion of La Forge, its successful R&D model, to multiple studios across the world, with teams now operating in Canada (Ubisoft Montreal, Ubisoft Toronto), China (Ubisoft Chengdu, Ubisoft Shanghai), and France (Ubisoft Bordeaux). The UDC conference, Ubisoft's annual meeting dedicated to technological innovation in video game creation, includes a specific track on artificial intelligence and machine learning.
9. What pricing options are available for accessing the report?
Pricing options include single-user, multi-user, and enterprise licenses priced at USD 4750, USD 5250, and USD 8750 respectively.
10. Is the market size provided in terms of value or volume?
The market size is provided in terms of value, measured in Million.
11. Are there any specific market keywords associated with the report?
Yes, the market keyword associated with the report is "Online Casual Games Market," which aids in identifying and referencing the specific market segment covered.
12. How do I determine which pricing option suits my needs best?
The pricing options vary based on user requirements and access needs. Individual users may opt for single-user licenses, while businesses requiring broader access may choose multi-user or enterprise licenses for cost-effective access to the report.
13. Are there any additional resources or data provided in the Online Casual Games Market report?
While the report offers comprehensive insights, it's advisable to review the specific contents or supplementary materials provided to ascertain if additional resources or data are available.
14. How can I stay updated on further developments or reports in the Online Casual Games Market?
To stay informed about further developments, trends, and reports in the Online Casual Games Market, consider subscribing to industry newsletters, following relevant companies and organizations, or regularly checking reputable industry news sources and publications.
Methodology
Step 1 - Identification of Relevant Samples Size from Population Database


Step 2 - Approaches for Defining Global Market Size (Value, Volume* & Price*)

Note*: In applicable scenarios
Step 3 - Data Sources
Primary Research
- Web Analytics
- Survey Reports
- Research Institute
- Latest Research Reports
- Opinion Leaders
Secondary Research
- Annual Reports
- White Paper
- Latest Press Release
- Industry Association
- Paid Database
- Investor Presentations

Step 4 - Data Triangulation
Involves using different sources of information in order to increase the validity of a study
These sources are likely to be stakeholders in a program - participants, other researchers, program staff, other community members, and so on.
Then we put all data in single framework & apply various statistical tools to find out the dynamic on the market.
During the analysis stage, feedback from the stakeholder groups would be compared to determine areas of agreement as well as areas of divergence